


 text new page (beta)
 English (pdf)
 Article in xml format
 Article references
 Send this article by e-mail
 Cited by SciELO
  Similars in
SciELO
Similars in
SciELO 
 Permalink
Introduction
The easily adjustable chemical structure of proteins and their biocompatibility allow the development of unique functional systems. Among these, protein nanoparticles (PN) stand out, which are of interest to the food and pharmaceutical industries as vehicles for the transport and release of drugs and bioactive compounds (Zhang et al., 2023). The protein sources to produce PN can be of animal or vegetable origin (Kianfar, 2021), highlighting the agro-industrial by-products due to the sustainable use that can be made of them (Álvarez-Castillo et al., 2021). Among the agro-industrial by-products studied to make PN are soybean (Yuan et al., 2023), bovine milk whey (Liu et al., 2022), rice bran (Peng et al., 2017), chicken feathers (Saleh et al., 2020), wheat bran (Chaquilla-Quilca et al., 2016), tea leaves (Ren et al., 2020), gluten flours from wet milling of cereals, as well as distillers dried grains with soluble and Brewer's spent grain (Tapia-Hernández et al., 2019).
Strategies to produce PN include physical and chemical methods, as well as controlled enzymatic hydrolysis. The first two are aggressive for the same proteins and have a high energy cost, while enzymatic hydrolysis is carried out under mild conditions and can be highly selective, releasing peptides with specific sequences (Shen et al., 2020). Peptides released by proteolysis act as building blocks that spontaneously self-assemble to form PN, whose morphology depends on the amino acid sequence of the peptides (Mandal et al., 2014). Self-assembled PN is stabilized by non-covalent interactions (Li et al., 2022) and sometimes by divalent cations bridging (Graveland-Bikker et al., 2004).
Among the highly selective proteases is the V8 protease (also known as Glu-C endoproteinase), which in phosphate buffer at pH 7.8 specifically cleaves aspartic acid (Asp) and glutamic acid (Glu) residues (Drapeau et al., 1972). In a previous study, the formation of tubular nanoparticles through hydrolysis of a protein-rich wheat bran aqueous extract (WBAE) by V8 protease was reported. The hydrolysis was carried out in the presence of CaCl2 as the source of stabilizing Ca2+ ions (Chaquilla-Quilca et al., 2016). A model was proposed to explain the formation of the tubular nanoparticles, but it has not been demonstrated experimentally. The objective of the present work was to explore the mechanistic aspect of the formation of said nanoparticles, given the importance from a point of view of fundamental science and in a sustainability context.
The heterogeneity and complexity of the WBAE make it laborious to elucidate the components and molecular interactions involved in the formation of PN. In a first approximation, it was hypothesized that PN is formed in a fraction of the WBAE with a particular composition. To test this hypothesis, a bottom-up method based on fractioning the WBAE by size exclusion chromatography (SEC) was used. The obtained SEC fractions were subjected to V8 proteolysis in the presence of Ca2+ to determine which SEC fraction or fractions are involved in the PN formation. From the chemical characterization of the WBAE and the electrophoretic, spectroscopic, and electron microscopy analysis of the SEC fractions and hydrolysates, a probable formation mechanism is proposed.
Material and methods
Raw material
The wheat bran was obtained from a commercial mill in Hermosillo Son., Mexico, on the same day of its production. The bran was immediately packed in polyethylene bags and stored at 5 °C until use, which occurred no later than 2 weeks.
Obtaining the aqueous extract of wheat bran
Wheat bran was prepared according to the methodology reported by Chaquilla-Quilca et al. (2016). After sieving through #40 mesh (0.45 mm aperture), the retained wheat bran was washed with HPLC water and dried at 40 °C for 18 h. Once dry, it was extracted with cold HPLC water in a 1:10 w/v ratio, at 5 ± 1 °C for 3 h, with magnetic stirring inside a refrigerator. The solids were then removed by filtration through organza cloth and the filtrate was centrifuged at 5,500 × g for 20 min at 5 °C. The supernatant was recovered and dialyzed against ultrapure water with a 14 kDa pore-opening membrane, making 3 fluid exchanges over the course of 24 h. The dialysate was lyophilized, and the obtained powder was identified as WBAE and stored at -40 °C until use.
Protein determinations
The total protein content was determined by the AOAC (2005) micro-Kjeldahl method (955.04) using a nitrogen-protein conversion factor of 5.75. The soluble protein was estimated by the Bradford method (Bradford, 1976).
Determination of neutral sugars
Neutral sugars were analyzed in the WBAE by high-performance liquid chromatography (HPLC) (Dionex, Sunnyvale, CA, USA) to quantify the presence of non-starch polysaccharides (Luna-Valdez et al., 2017). After hydrolyzing the samples with HCl, the sugars were separated on a Dionex-CarboPac PA10 analytical column (4 × 250 mm) and the HPLC instrument was equipped with an ED50 pulsed amperometric detector. Water and 0.3 M NaOH were used as eluents. Neutral sugars were identified by comparing the elution times of the samples with those of standard sugars from kits 29,387-3 (Aldrich Chemical Company Inc., WI, USA).
Size Exclusion Chromatography (SEC)
SEC was performed on an XK70 preparative column (16 × 700 mm) packed with Superdex 75 (GE Healthcare Bio-Sciences AB, Uppsala, SWE), according to the method reported by Luna-Valdez et al. (2019). The WBAE, prepared in 10% w/v 50 mM sodium phosphate buffer, was injected into the column, and eluted with 50 mM sodium phosphate, 150 mM NaCl, pH 7.2, at a flow rate of 1 mL/min. Eluates of 0.75 mL were recovered and the absorbance at 280 nm (Abs280) of each one of them was read in a Cary 60 spectrophotometer (Agilent Technologies Inc., Santa Clara, CA, USA). The SEC chromatogram was obtained by plotting Abs280 vs volume. Each chromatogram peak was considered an SEC fraction, the molecular weight of which was calculated using a standard curve constructed with proteins of known molecular weight (GE Healthcare Bio-Sciences). Eluates from each SEC fraction were pooled, and each pool was dialyzed against ultrapure water with a 14 kDa opening pore membrane. After estimating the soluble protein content, all fractions were lyophilized and stored at -20 °C until use. Thirty chromatographic runs were carried out through the column, to collect enough of each SEC fraction before carrying out the characterizations and the hydrolysis experiment.
Polyacrylamide gel electrophoresis
To determine the molecular mass profiles, the WBAE and the SEC fractions were analyzed by sodium dodecyl sulfate-polyacrylamide gel electrophoresis (SDS-PAGE), under reducing and denaturing conditions, according to the Laemmli (1970) methodology. Samples with 15 µg of protein were loaded into the gel wells, except for SEC fractions F4 and F5 since, due to the minimum protein concentrations in these fractions, every effort was made to load the maximum without exceeding the volume allowed by the wells. Gels prepared at 14% were used and each run was performed by applying a current of 15 mA per gel in a Mini-Protean Tetra Cell (Bio-Rad) unit. The relative molecular mass of the proteins in the gels was estimated by comparison with the Bio-Rad Precision Plus molecular weight marker (Cat. 161-0374). All gels were stained with 1% Coomassie blue R-250 (Bio-Rad) in 30% methanol and 10% acetic acid and documented on the Bio-Rad Gel DocTM XR+ system.
Total phenols
For the determination of total phenolic compounds in both WBAE and the SEC fractions, the Folin-Ciocalteu method was used, according to the methodology reported by Xu & Chang (2007). Total phenol content was calculated from a gallic acid standard curve. The determinations were made in triplicate and the results were expressed as mg of total phenols in equivalents of gallic acid per 100 g of sample (mg EGA/100 g).
UV-Vis spectroscopy
To support the chemical characterization, the UV-Vis spectra of the WBAE solutions and the SEC fractions, prepared in 50 mM sodium phosphate buffer, were obtained. The UV-Vis spectrum of the phosphate buffer was also obtained, as a control. Scans were made in the 200 to 800 nm range in a Cary 60 spectrophotometer.
Proteolysis with the V8 protease
The WBAE and the SEC fractions were subjected to proteolysis with V8 in a reaction medium in the presence of Ca2+, according to the methodology reported by Chaquilla-Quilca et al. (2016). V8 protease, EC 3.4.21.19 (Sigma-Aldrich, St. Louis, MO, USA), WBAE, and each of the SEC fractions were separately prepared in 0.1 M Tris-PO4 buffer, pH 7.8. The reaction was carried out in test tubes, in which the samples, V8 protease, and CaCl2 were mixed in a molar ratio of 62.5:2:2000 on a protein basis. Control samples were also run, without CaCl2 or V8. After gentle manual mixing, the tubes were incubated for 4 h at 37°C in a water bath (VWR International, Radnor, PA). The reaction was stopped by immersing the test tubes in water at 100 °C for 10 min, then the tubes were cooled in an ice bath and the hydrolysates were frozen at -40 °C and lyophilized. Lyophilized hydrolysates were identified as F1H, FintH, F2H, F3H, F4H, and F5H, while controls were identified as CF1, CFint, CF2, CF3, CF4, and CF5. All samples were stored at -40 °C in 2 mL conical tubes, capped, until use.
Infrared spectroscopy
Identification of functional groups in the lyophilized SEC fractions and hydrolyzed SEC fractions was performed by Fourier transform infrared (FTIR) spectroscopy on a Nicolet FT-IR iS50 spectrometer (Thermo Fisher Scientific Inc., Waltham, MA). The spectra were run in the range of 400 to 4,000 cm-1 with a resolution of 4 cm-1. Each spectrum was the result of 64 scans and was obtained by plotting transmittance vs wavenumber.
Scanning electron microscopy
The morphology of the particles obtained in the hydrolysates was analyzed by scanning electron microscopy (SEM). Each sample was dissolved in deionized water and sonicated for 10 min. A sample drop was then placed on a holder and air-dried at room temperature. Each sample was covered with an Au-Pd layer and visualized on a JEOL microscope (FESEM-7600, Tokyo, Japan) at 2.0 kV. Control samples, prepared using the same methodology as the hydrolysates, were also visualized.
Results and discussion
Characterization of the WBAE
Protein content
After aqueous extraction, dialysis, and lyophilization, a wheat bran aqueous extract with 47 ± 0.6 % total protein by weight was obtained. This is a value close to that reported by Chaquilla-Quilca et al. (2016), which indicates the reproducibility of the method regarding protein extraction.
Neutral sugar content
The arabinose/xylose ratio (Ara/Xyl) indicates the number of Ara units attached to the Xyl backbone and is routinely used for the determination of arabinoxylans in a biological sample (Morales-Ortega et al., 2013). On the other hand, the ratio arabinose/galactose (Ara/Gal) helps to identify arabinogalactans (Saeed et al., 2011), often represented as a linear skeleton of Gal with short lateral branches of different sugars, mainly Ara (Fincher et al., 1983). Table 1 shows the composition of neutral sugars of the WBAE, where glucose (Glc) was the most abundant. The Gal and Xyl contents were half of those of Glc, while the Ara content was the lowest, with less than a quarter of that of Glc. In wheat bran, the neutral sugars Ara, Gal, Glc, and Xyl are reported (Maes & Delcour, 2002; Hollmann et al., 2009), as well as in the WBAE (Luna-Valdez et al., 2017). In the present work, these sugars belong to water-extractable polysaccharides, such as starch, β-glucans, arabinoxylans, or arabinogalactans (Loosvel et al., 1997). The last two are usually attached to peptides and proteins through covalent bonds (Fincher et al., 1983; Cipriani et al., 2009).
Table 1 The neutral sugar content of the wheat bran aqueous extract (WBAE); molecular mass, soluble protein content, and total phenols of the SEC fractions.
| WBAE neutral sugar content (mg/kg) | Molecular mass (MM), soluble protein content, and total phenols of the SEC fractions | ||||
|---|---|---|---|---|---|
| SEC fraction | MM (kDa)a | Protein (mg/mL)b | Total phenols (mg EGA/100 g)c | ||
| Arabinose | 8.75 | F1 | 102.8 | 0.36 | 536 ± 35 |
| Galactose | 15.31 | Fint | 58.4 | 0.35 | 419 ± 2 |
| Glucose | 36.47 | F2 | 15.1 | 1.00 | 820 ± 155 |
| Xylose | 17.71 | F3 | 6.9 | 0.52 | 861 ± 67 |
| Relaciones | F4 | 2.4 | 0.12 | 274 ± 12 | |
| Ara/Xyl | 0.49 | F5 | 0.3 | 0.01 | ndd |
| Ara/Gal | 0.55 | ||||
aMolecular mass determined by SEC; bBradford method; cFolin-Ciocalteau method; dnd= not detected.
The WBAE Ara/Xyl ratio (Table 1) was very close to that reported by Maes & Delcour (2002) and Khan & Shewry (2009), who reported ratios of 0.45 for water-extractable arabinoxylans from wheat bran and 0.60 for whole wheat grain, respectively. Thus, the presence of arabinoxylans in the WBAE is confirmed. On the other hand, the Ara/Gal relationship (Table 1) is like that reported by Izydorczyk et al. (1991) for extractable arabinogalactans in wheat water (0.66 to 0.75), thus confirming their presence in the WBAE.
In the present work, the Xyl content was higher than that of Ara, unlike what was reported by Luna-Valdez et al. (2017), so the Ara/Xyl ratio is inverted (1.6 vs 0.49, respectively). The arabinoxylans of the outer pericarp are of low molecular weight, easily extractable with water, and have an Ara/Xyl ratio greater than 1.0 (Antoine et al., 2003). The extracts reported by Luna-Valdez et al. (2017) were not dialyzed, therefore, in the present study, low molecular weight arabinoxylans were possibly removed during dialysis.
Content of total phenolic compounds
The content of total phenols in the WBAE was 1,430 ± 2.0 mg EGA/100 g. The most representative bioactive compounds of wheat bran are phenolic acids and flavonoids. Among the former, the most abundant is ferulic acid. Both compounds are very difficult to extract, due to their insolubility and because they form complexes with non-starch polysaccharides (Călinoiu & Vodnar, 2019). Most likely, the vast majority of the phenolic compounds in the WBAE correspond to ferulic acid esterified to arabinoxylans, since the latter is soluble in water.
The presence of proteins, arabinoxylans, arabinogalactans, and phenolic compounds confirms the chemical complexity of WBAE and suggests that these components are forming macromolecular complexes. Therefore, several components could be involved in the formation of PN, each with a particular function.
Size Exclusion Chromatography (SEC)
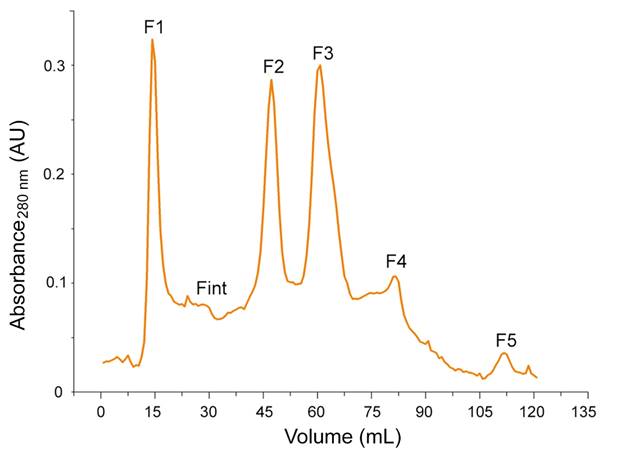
The WBAE was separated into six SEC fractions, identified as F1, Fint, F2, F3, F4, and F5, as shown in Figure 1, with a molecular mass profile of 0.3 to 102.8 kDa (Table 1). These results are like those found for WBAE by Luna-Valdez et al. (2019). They are also approximate to what was found by De Brier et al. (2015), who reported molecular masses in the range of 14.4 to 97 kDa after fractionation of wheat bran albumin/globulin by size exclusion HPLC chromatography.
Characterization of SEC fractions
Soluble protein content
Soluble protein was detected in all SEC fractions (Table 1), with fraction F2 having the highest content, followed by F3. The protein content of F5 is considered a trace. Obtaining two fractions in which at least one of the major components does not exist or at least is found in minimal amounts, in this case, proteins, allows a process of discrimination between fractions, under the assumption that not in all these will form PN.
Total phenols content
The total phenols contained in the WBAE were distributed in the SEC fractions as shown in Table 1. The phenolic compounds were more concentrated in F3 and F2, followed by F1, Fint, and F4, while in the F5 fraction, were not detected (Table 1). The presence of phenolic compounds in almost all the fractions has the following explanation. The main phenolic compound in wheat bran is ferulic acid, frequently esterified to arabinoxylans, which in turn form complexes with proteins (Adams et al., 2003). Therefore, the presence of phenolic compounds in the fractions containing protein, as well as the relationship of their concentrations, is consistent. That is, the fractions with the highest protein content are also those that contain more phenolic compounds, as reported in Table 1. The phenolic compounds present in fraction F5 probably correspond to free ferulic acid. Due to technical impediments, it was not possible to quantify non-starch polysaccharides in the SEC fractions nor to characterize the profile of specific phenolic compounds. However, spectroscopic characterization provides valuable information in this regard.
UV-Vis spectroscopy
In Figure 2 the UV-Vis spectra of the WBAE and the SEC fractions are shown. The WBAE spectrum is presented as a reference, so the discussion will be directed to the spectra of the fractions. The Abs280 in F1, Fint, F2, F3, and F4 is typical of proteins, but phenolic compounds can also absorb at this wavelength so there could be an overlap in the absorption bands. However, the absorbances at approx. 220 nm and 340 nm help distinguish proteins from phenols. Peaks at 220 nm in F1, Fint, F2, and F3 are due to peptide bonding (Aitken & Learmonth, 2002) and this result is related to soluble protein content (Table 1). On the other hand, the shoulders at 340 nm in F1, Fint, F2, F3, and F4 are indicative of esterified ferulic acid (Hromádková et al., 2013). Free ferulic acid could additionally contribute to Abs280 in F1 to F4. Thus, due to the coexistence of proteins and esterified ferulic acid, and according to the content of neutral sugars and the WBAE Ara/Xyl ratio (Table 1), it is concluded that the feruoylated arabinoxylans are contained in F1, Fint, F2 and F3, linked to proteins through a feruloyl sugar monomer (Obel et al., 2003) as already discussed by Luna-Valdez et al. (2019). The F4 fraction consists of low molecular weight polysaccharides, probably minor amounts of free ferulic acid and protein. The spectrum of F5 is almost identical to the control, except for the weak absorbance at 340 and 280 nm, so in F5 minor amounts of low molecular weight arabinoxylans and/or phenolic compounds are not ruled out, although the latter were not detected by the Folin-Ciocalteau method as reported in Table 1.
IR spectroscopy
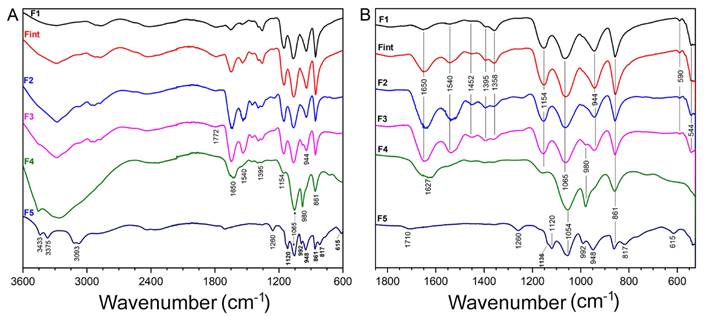
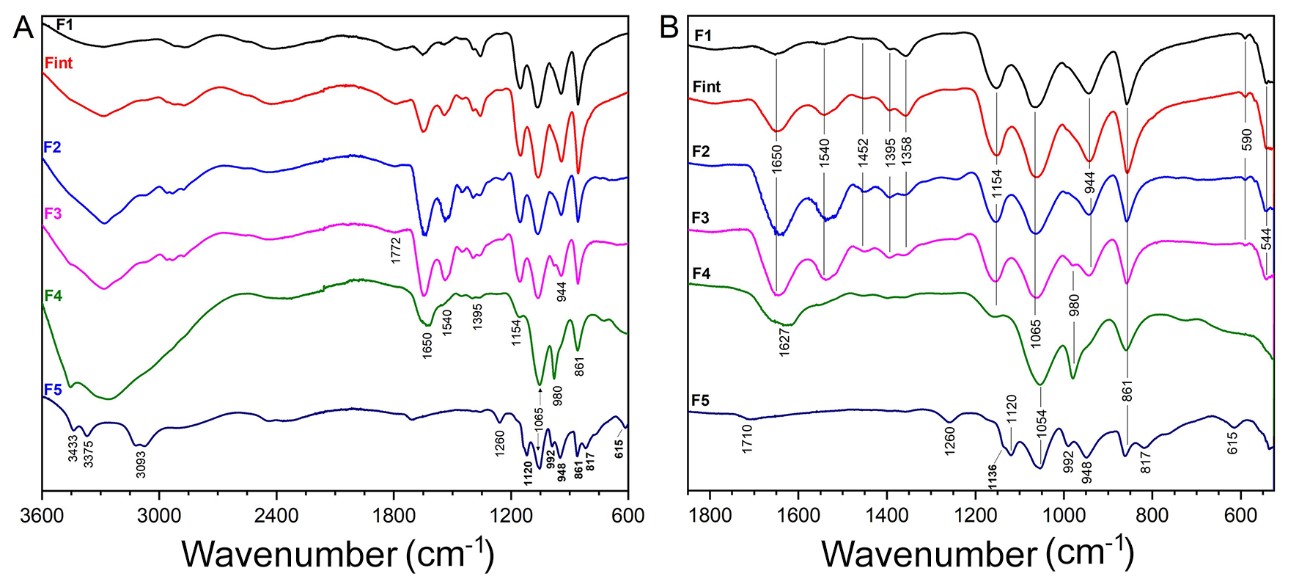
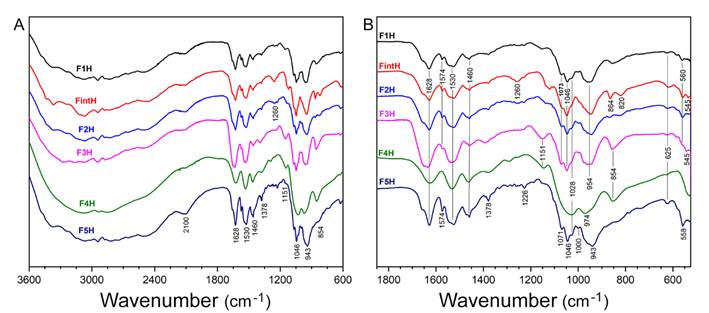
Figure 3 IR spectra of the SEC fractions of wheat bran aqueous extract (A). Magnification of the 800 - 1200 cm-1 region of the same IR spectra (B). Source: Own elaboration, based on the results of this work.
The strongest signal at 1,065 cm−1 is assigned to the C−OH bending (Barron & Rouau, 2008) and is very close to that of (1→4)−β−xylans (Robert et al., 2005). The peak at 1,154 cm−1, most intense in F1, Fint, F2, and F3, is assigned to the asymmetric C−O−C stretching of the glycosidic bond (Kačuráková & Wilson, 2001; Robert et al., 2005), while the signal from 944 cm-1 in F1 to F3 could be a signal shifted from the β configuration of C1, which appears at 895 cm-1 in crystalline xylans (Marschessault et al., 1962). Both the 154 cm−1 and 944 cm−1 signals are less intense in F4 than in F1, Fint, F2, or F3 and are absent in F5. Such a change in intensity is characteristic of arabinoxylans with different degrees of substitution, the higher the degree of substitution, the lower the intensity. Thus, the presence of arabinoxylans in F1 to F4 is confirmed, indicating that those in F4 have a higher degree of Ara substitution in O3 (Robert et al., 2005).
Intense signals at 1,065 cm−1 and 980 cm−1 in the spectrum of F4 indicate a galactopyranose backbone with branched arabinofuranose, thus arabinogalactans are identified in F4. The peak at 980 cm−1 is weak in F3 and absent in F1, Fint, or F2, indicating that most of the arabinogalactans are in F4. The signal close to 1,030 cm−1 is assigned to (1→4)-β-glucans, so these, with different molecular weights, are not discarded in all SEC fractions. Glucuronic acid substituted xylans could be in F4 and F5, assigned to the signal at 1,627 cm-1 (Marchessault et al., 1962), provided no protein is present. However, the 1,627 cm−1 signal could also be assigned to the C=C and C=O stretching of the phenolic compounds.
In the spectra from F1 to F4, protein bands are observed, characteristic of the C=O stretch (1,650 cm−1) and the N-H stretch (1,540 cm−1) (Barth, 2007). These bands are more intense in F2 and F3 and coincide with the protein concentration (Table 1). The weak band of 1,772 cm−1 is close to that of the aromatic esters (Séné et al., 1994), which suggests a low degree of esterification, possibly with ferulic acid, so that the latter could form complexes with polysaccharides, in support of what has already been discussed. A peak is observed between 2,800 and 3,000 cm-1 in the F1 to F4 spectra, as well as a broad band near 3,400 cm-1. The peak corresponds to the C-H stretching of carbohydrates, while the broadband is in the stretching region of polymeric hydrogen bonds (Hollmann et al., 2009) and is less intense in the F1 fraction.
There is a notable difference between the spectra of F4 and F5 and those corresponding to the other fractions. Protein peaks are not seen in the F5 spectrum, which is consistent with the near absence of protein in this fraction. On the other hand, the broadband in regions close to 3,400 cm−1 corresponds to the stretching of the OH groups and is characteristic of polymeric hydrogen bonds (Hollmann et al., 2009). In the F5 spectrum, the peak at 1,260 cm−1 corresponds to C−OH stretching of phenols, while at 1,710 cm−1 it implies a low degree of esterification with aromatic esters, such as ferulic acid (Séné et al., 1994). The appearance of peaks at 3,400-3,000 cm-1, corresponding to the stretching of phenols with C-H and O-H (Stuart, 2004), suggests the presence of phenolic compounds bound to arabinoxylans in F5. Feruloylated arabinoxylans have the ferulic acid attached to the O-5 arabinose position through an ester bond (Saulnier and Thibault., 1999).
The results of the IR spectroscopy coincide with the results of the rest of the characterizations. It is concluded that fractions F1, Fint, F2, and F3 consist of protein-polysaccharide-ferulic acid complexes, while F4 and F5 contain mainly arabinoxylans esterified with ferulic acid and/or arabinogalactans, with minor amounts of protein.
Polyacrylamide gel electrophoresis (SDS-PAGE)
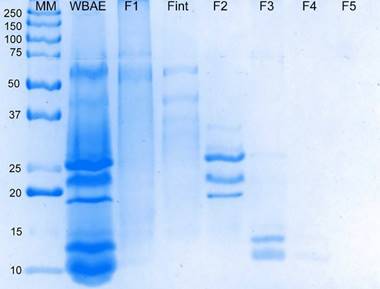
In Figure 4 the results of the SDS-PAGE analysis are shown. A pattern of decreasing molecular mass of the SEC fractions is observed in the F1 to F4 direction, which is according to the size exclusion chromatography analysis (Table 1). However, as expected, the absolute values of molecular mass between the SEC and SDS-PAGE methods are different due to the complexity of the WBAE. The molecular mass was estimated by SEC from the maximum Abs280 of each peak, but each SEC fraction contains more than one protein, as indicated by the several bands in the lanes of Figure 4. Furthermore, arabinoxylans are esterified to ferulic acid, which contributes to the Abs280 of the SEC fractions. Also, proteins and arabinoxylans form complexes (Adams et al., 2003), so they elute together through the SEC column or SDS-PAGE gel. Carbohydrates can substantially modify the apparent mass due to their influence on the Stokes radius of the protein (Stafstrom & Staehelin, 1986).
Source: Own elaboration based on the results of this work.
Figure 4 SDS-PAGE gel with the molecular mass profile of the wheat bran aqueous extract (WBAE) and its fractions separated by size exclusion chromatography. MM=molecular marker.
A very faint band is observed in lane F4, while no band was revealed in lane F5. This result agrees with that reported for the protein content of F4 and F5 in Table 1. The protein content of F5 is so insignificant that it might only be possible to reveal it using another staining method, such as silver staining.
The chromatographic and electrophoresis results indicate that the separation resulted in discernible fractions regarding the presence of proteins. This is important because, if the formation of PN occurs in any of the fractions that contain proteins, the analysis of their primary sequence would facilitate elucidation of the mechanisms of PN formation.
Characterization of hydrolysates
IR spectroscopy
The IR spectra of the hydrolyzed SEC fractions (Figure 5A) are like the spectra of the non-hydrolyzed SEC fractions (Figure 3), but there were shifts and intensity changes in some bands due to interactions between the components after proteolysis. In Figure 5B, the 800-1,200 cm-1 region has been enlarged for clarity. he signal at 1,154 cm-1 in the SEC fractions (Figure 3B) shifted to 1,151 cm-1 in F3H and F4H and almost disappeared in F2H and F1H, indicating changes in the degree of substitution of arabinoxylans. The peak of 944 cm-1 in the SEC fractions shifted to 954 cm-1 in the hydrolyzed SEC fractions. In F1H to F3H, the 1,065 cm-1 band observed in the SEC fractions split into two signals, at 1,073 and 1,046 cm-1. The amide I and amide II bands were slightly shifted, appearing at 1,628 cm-1 and 1.530 cm-1. There is also a greater intensity of protein signals in L4H and the appearance of these in L5H, which is due to the addition of protease.
It is difficult to accurately assign all signals and interpret displacements within the region of 800 to 1,200 cm-1 due to overlapping bands (Kačuráková et al., 2000). Likewise, the appearance of a signal at 1,574 cm-1 in the IR spectra of the hydrolysates is striking, which is not observed in the spectra corresponding to the SEC fractions of Figure 3. However, based on the information provided from the IR spectra, it can be inferred that previously unavailable functional groups are exposed during the proteolysis of WBAE proteins. This gives rise to spontaneous interactions with the subsequent formation of supramolecular structures.
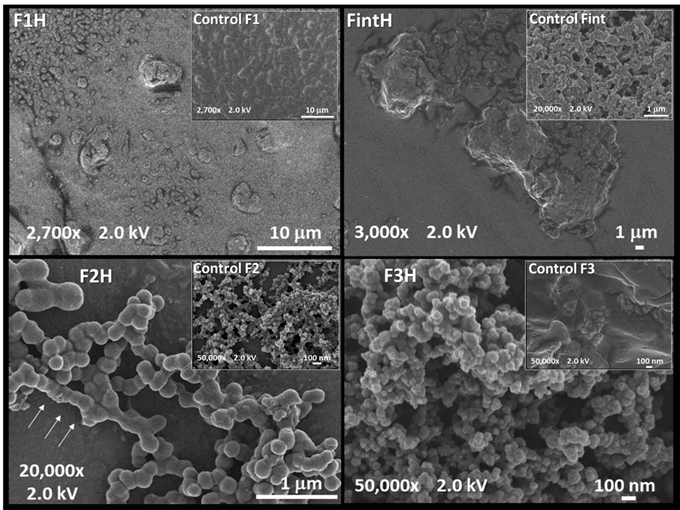
Scanning Electron Microscopy (SEM)
The SEM images of the hydrolysates corresponding to each SEC fraction and their respective controls (insets) are shown in Figure 6. No well-defined structures are observed in F1H or FintH, except for several micrometer-scale structures. In Control F1, attention is drawn to what appear to be spheres immersed in a matrix, approximately 2 m in diameter. Similar spherical structures, 200 nm in diameter, are shown in the Control Fint, many of which coalesce to form a porous three-dimensional network. Structures like those of Control F1 and Control Fint have been reported, which are induced by the application of heat, without the intervention of proteases or calcium (Luna-Valdez et al., 2019).
Control F3 has a smooth surface, with small incrustations and some agglomerates, while in hydrolysate F3H, apparently spherical structures within the nanometer range are observed, agglomerated, and held together by what appears to be glue. At higher magnification, these structures do not appear to be individual spheres, but instead form a continuum with the glue (image not shown). In Control F2, structures like those of Control Fint are again observed and it is intuited that their formation is induced by the heat administered during the inactivation of the V8 protease. On the other hand, in the F2H hydrolysate, well-defined spherical structures are present, of approx. 200 nm in diameter, where the matrix completely disappeared under the action of ultrasound in the step prior to SEM analysis, thus revealing individual spheres. These spheres merge longitudinally (indicated by the arrows in Figure 6), forming lines or fibers that resemble the SEM images reported by Chaquilla-Quilca et al. (2016). Fusion or elongation of spherical peptide micelles has been reported by other authors (Khoe et al., 2009). In the F4H and F5H hydrolysates, only particles with a polydisperse size distribution and no defined shape were observed (images not shown), indicating that proteins play an important role in the formation of nanospheres. In the F2H hydrolysate of Figure 6, spheres attached to a growing central structure are also observed, at different angles, which could give rise to branching sites.
In a previous study, reported by Chaquilla-Quilca et al. (2016), bifurcated tubular structures with 200 nm external diameter were found. To explain the mechanism of formation, it was proposed that, after proteolysis, long sheets consisting of proteins and arabinoxylans are formed, which are rolled up to form nanotubes. Instead, the set of results of the present work indicates that the creation of complex nanostructures begins with the formation of nanospheres and that the F2 chromatographic fraction of the aqueous extract of wheat bran contains the necessary components for it. This fraction is distinguished from the rest by a higher protein content and a high content of phenolic compounds, most likely ferulic acid esterified to arabinoxylans. Since these three components are forming large molecular complexes, the following sequence of events is proposed to explain the mechanism of nanosphere formation. In this model, a particular primary structure of the proteins contained in the F2 fraction must be recognized as fundamental. In the first step, the V8 protease cleaves at the Asp and Glu residues of the proteins, destabilizing the large molecular complexes while exposing many negatively charged carboxyl groups. The proteins thus hydrolyzed are reduced in size and, therefore, also the molecular complexes of which they are a part. In the second step, the new, smaller complexes, considered as the molecular building blocks, self-assemble through multiple unions mediated by the Ca2+ ions present in the medium. The latter step gives rise to nanometric structures that adopt a spherical shape because it is one that offers greater thermodynamic stability. Finally, through other types of interactions, the spheres join each other at different angles; these interactions could occur through bridges between Ca2+ ions and phytates, which are possibly present in the bran extracts, also complexed to proteins. In the model, the arabinoxylans would be exposed on the surface, forming a continuum with the set of spherical structures, which is detached by ultrasound action. If the nanospheres turned out to be hollow, it would explain the formation of the tubular structures reported by Chaquilla-Quilca et al. (2016) since these and the nanospheres have the same diameter. Currently, work is being done on these aspects to elucidate with more precision the composition and structure of the nanoparticles, as well as the mechanism of their formation.
Conclusions
In a single fraction of the wheat bran aqueous extract, which contains arabinoxylan-protein-ferulic acid complexes with molecular masses between 18 and 25 kDa estimated by SDS-PAGE, the formation of nanoparticles occurs by hydrolysis with V8 protease in the presence of Ca2+. The resulting nanoparticles are nanospheres 200 nm in diameter, fused in the longitudinal direction and at different angles, providing attachment sites for branching. Taken together, the information obtained in this work is important to better understand the molecular self-assembly of protein nanoparticles, since it puts into perspective the study of unexpected molecular interactions that can give rise to nanostructures with innovative applications.

