


Services on Demand
Journal
Article
 text in
  English (pdf)
 Article in xml format
 Article references
 Send this article by e-mail
Indicators
-
 Cited by SciELO
 -
 Access statistics
Related links
-
 Similars in
SciELO
Similars in
SciELO
Share

 Permalink
Revista mexicana de ciencias forestales
Print version ISSN 2007-1132
Rev. mex. de cienc. forestales vol.7 n.35 México May./Jun. 2016
Articles
Modeling of biomass and aboveground arboreal carbon in forests of the state of Durango
1 Facultad de Ciencias Forestales, Universidad Autónoma de Nuevo León. Linares, Nuevo León, México.
2Instituto Tecnológico de El Salto, Durango, México.
Forest ecosystems are particularly important as carbon reservoirs, since the trees retain large amounts of this element per surface area unit, compared to other types of vegetation. Within this context, the carbon reservoirs in various evaluated systems in the state of Durango, aged 5 to 60 years, were quantified; the biomass and aboveground arboreal carbon were spatially modeled using satellite imagery, and biomass (Mg ha-1) and aboveground arboreal carbon (Mg ha-1) maps of the selected area were generated. This study presents the relationships between biomass and carbon in forests obtained from the spectral data analysis by the Landsat TM (Thematic Mapper), in the State of Durango, Mexico. The multiple linear regression method was utilized to determine relationships and estimations. The results showed a good correlation between forest variables and spectral indices related to vegetation moisture. The generated models used for quantifying the biomass and aboveground carbon were those with the best fit and fewest errors. For the biomass, the root mean square error was RMSE = 54.74 Mg ha-1, B = 334.69 - 12.83(B2) +107.13(B3) + 8 250.39(NDVI) - 8 265.91(NDVI41) + 6 548.72(NDVI43), and for carbon, RMSE = 26.87 Mg ha-1, C = 164.71 - 55.23(B2) + 52.54(B3) + 4 052.05(NDVI) - 4 059.76(NDVI41) + 3 215.18(NDVI43). Landsat TM images provide valuable information to estimate the biomass and quantify the aboveground arboreal carbon.
Key words: Forest biomass; aboveground arboreal carbon; spectral data; Landsat TM; reflectances; SPOT satellite
Los ecosistemas forestales son particularmente importantes como reservorio de carbono, porque los árboles retienen altas cantidades de ese elemento por unidad de área, en comparación con otros tipos de vegetación. En este contexto, se trabajó en bosques del estado de Durango con el propósito de cuantificar los almacenes de carbono en diferentes sistemas evaluados, de 5 a 60 años; modelar espacialmente la biomasa y carbono arbóreo aéreo, mediante el uso de imágenes de satélite; generar mapas de biomasa (Mg ha-1) y carbono arbóreo aéreo (Mg ha-1) de las áreas de seleccionadas. El estudio presenta las relaciones entre los datos espectrales obtenidos con el sensor Landsat TM (Thematic Mapper) y las variables de biomasa y carbono porque los datos obtenidos por medio de la percepción remota pueden ser útiles para la estimación indirecta del valor de la biomasa/carbono. Para las relaciones y estimaciones se utilizó el método de regresión lineal múltiple. Los resultados indican una buena correlación entre las variables forestales y los índices espectrales relacionados con la humedad de la vegetación. Los modelos generados para la estimación de biomasa y cuantificación de carbono arbóreo aéreo presentaron los mejores ajustes y menores errores; para la primera, la raíz del error medio cuadrático fue de RMSE = 54.74 Mg ha-1, B = 334.69 -12.83(B2) +107.13(B3) + 8 250.39(NDVI) - 8 265.91(NDVI41) + 6 548.72(NDVI43); y para carbono un RMSE = 26.87 Mg ha-1, C =164.71 - 55.23(B2) + 52.54(B3) + 4 052.05(NDVI) - 4 059.76(NDVI41) + 3 215.18(NDVI43). Se concluye que las imágenes Landsat TM proveen información valiosa para la estimación de biomasa y cuantificación de carbono arbóreo aéreo.
Palabras clave: Biomasa forestal; carbón arbóreo aéreo; datos espectrales; Landsat TM; reflectancias; satélite SPOT
Introduction
One of the most important carbon deposits in the biosphere is concentrated in the terrestrial ecosystems: in the living organic matter, in the necromass and in the organic matter of the soil (Ruiz et al., 2014). Among the terrestrial ecosystems, the forest systems are particularly noteworthy as carbon reservoirs because the trees retain large amounts of this element per surface area unit, compared to other types of vegetation (IPCC, 2001).
Thus, the biomass level is an indicator of the carbon potential, and has received much attention since the agreements reached in the Kyoto Protocol. However, there is uncertainty as to the estimates of the forests as carbon deposits (Houghton, 2005); therefore, the use of remote perception techniques has been identified as a valuable tool to support estimations in this regard and to quantify the aerial biomass stock and the associated changes (Rosenqvist et al., 2003; Tomppo et al., 2002). Thus, the data obtained through this means can be useful for the indirect estimation of the biomass carbon ratio -a datum that must be complemented with field data and with measurements of the dasometric variables used in empirical biomass equations (Zianis and Mencuccini, 2004).
The use of remote perception data offers certain advantages, since these can cover a large area and provide systematic observation forms (Rosenqvist et al., 2003). By carrying out the right multitemporal analyses, it is possible to establish tasks for the prediction, prevention and determination of future scenarios, monitoring of certain elements of the natural environment, and estimation of the change produced in the various types of land use and occupation (Bedón and Pinto, 2007). Techniques based on remote perception acquire a high potential for this kind of tasks, given the regularity in the collection of the data and the growing variety in the spatial resolution of the available images, which allows identification of the changes from different work scales.
This study describes the modeling of forest biomass and aboveground arboreal carbon in the forests of the state of Durango, using images from the Landsat TM satellite and forest dasometric parameters. The objectives of the study were the quantification of the carbon stores in various evaluated forest systems aged 5 to 60 years; spatial modeling of the biomass and aboveground arboreal carbon through the use of satellite imagery, and generation of biomass (Mg ha-1) and aboveground arboreal carbon (Mg ha-1) maps of the study zones.
Materials and Methods
Study area
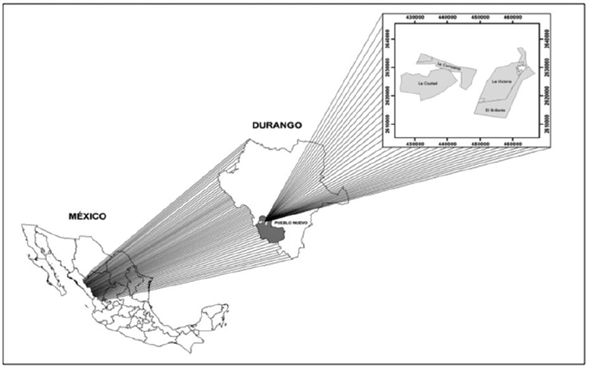
The study area comprises temperate forests of the municipality of Pueblo Nuevo, specifically in the El Brillante, La Ciudad, La Victoria and La Campana ejidos, in the state of Durango, Mexico (Figure 1). It is located in the physiographic province of the Western Sierra Madre and in the subprovince known as the Grand Plateau and the Durango Canyons. Its altitudes vary between 1 400 and 2 600 masl. The climate is semi-humid temperate or semi-cold, becoming temperate or semi-dry on the eastern side of the Sierra. The mean annual temperature ranges between 20 °C and 22 °C, and the mean annual precipitation, between 800 msm and 1 200 mm. Because of its geographical location, it includes various vegetation conditions, among them pure oak and pine-oak forests (Ucodefo 6, 1997).
Field work
The carbon reservoirs were quantified based on the dasometric data of thirty-nine 50 x 50 m quadrangular sites belonging to the Network of Permanent Forest Research Plots established by the Universidad Juárez del Estado de Durango and the Instituto Tecnológico de El Salto (Corral et al., 2009). The biomass of each sampling site was estimated using allometric equations previously generated for the main species (biomass production) of the state of Durango, which were applied to the dasometric data collected at the sampling sites. The biomass results were converted to stored amounts of carbon by multiplying the biomass by the specific total carbon factor for each species. The values of these percentages range between 0.43 and 0.51. The models were validated using 10 permanent sampling sites established in the La Campana ejido because the ecological and silvicultural conditions of this area resemble those of the El Brillante, La Ciudad and La Victoria ejidos.
The biomass and total carbon contents in each sampling site were determined by adding the amounts for both factors per tree. Furthermore, the results of these variables from the 39 sites were extrapolated to tons per hectare in order to facilitate the generation and construction of the models so as to predict their estimation through remote perception.
Landsat TM (Thematic Mapper) spectral data
The satellite image was based on the United States Geological Service (USGS, 2013) and was taken on June 19, 201, with a spatial resolution of 30 m. It has been orthorectified, i.e. it represents the objects in the site at their actual coordinates. This sensor operates with seven spectral bands especially selected to monitor the vegetation, with the exception of band 7, which was added for geological applications (Table 1).
Table 1 Characteristics of the bands and main applications of the Landsat TM.
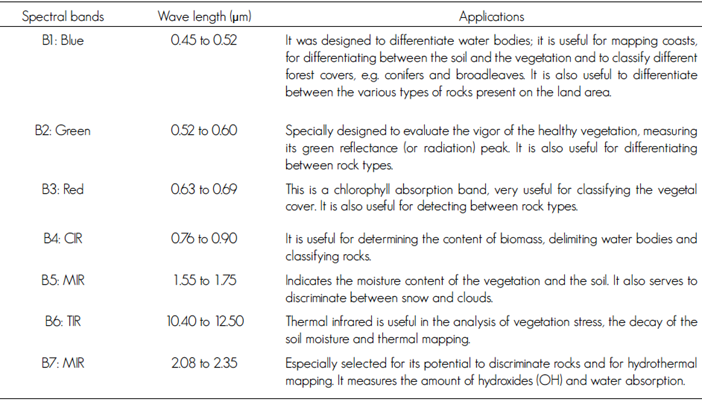
Bi = Spectral bands; CIR = Close infrared; MIR = Medium infrared; TIR = Thermal infrared; μm = Microns.
The spectral data were taken from the central UTM coordinates of the sampling sites, which were identified by the pixels of the images. The spectral data consisted in the reflectances obtained from four individual bands of the image and four mathematical transformations applied to the reflectance: 1) Normalized difference vegetation index (NDVI) = CIR-R)/(CIR+R) (Rouse et al., 1974); 2) NDVI41, consisting of the medium infrared (MIR) and green (G) spectral bands; calculated as NDVI = (MIR-G)/(MIR+G); 3) NDVI42, calculated as NDVI42 = (MIR-R)/(MIR+R); it is made up of the medium infrared and red spectral bands; 4) NDVI43, calculated as NDVI43 = (MIR-CIR)/ (MIR+CIR); this index is known as hydric stress (Rock et al., 1986), and consists of the medium infrared and close infrared spectral bands. These indices were built in order to highlight certain characteristics of the vegetation, mainly in terms of chlorophyll, the cell structure, and the water content of the vegetation (Chuvieco, 1998; Soria and Granados, 2005; Aguirre et al., 2009); they are most sensitive at a given portion of the electromagnetic spectrum and can be best detected in specific bands (Cohen and Goward, 2004).
Relationship between field data and spectral data
An analysis of the correlation between the forest variables of interest and the spectral data was performed in order to determine the behavior and relationship between them. The stepwise statistical procedure was applied in order to select a multiple linear regression model by which to estimate the biomass (Mg ha-1) and carbon (Mg ha-1) with a minimum of variables. The coefficient or determination (R2), the root mean square error (RMSE), and a significance level below 0.05 for each variable were used as statistical indicators of the goodness of fit. Once the best regression models were developed, the biomass and the carbon were estimated for the sampling sites corresponding with the spectral data, and, based on them, biomass maps and aboveground arboreal carbon maps were generated for the studied locations.
Validation
With the support of the methodology described above, the dasometric data and central UTM coordinates of 10 sampling sites other than the 39 used for building the models -located within the La Campana ejido- were processed. The results obtained through the application of the predicted regression models were compared to the observed field data, estimated by means of allometric equations and carbon factors.
Results and Discussion
Relationship between the forest variables and the spectral data
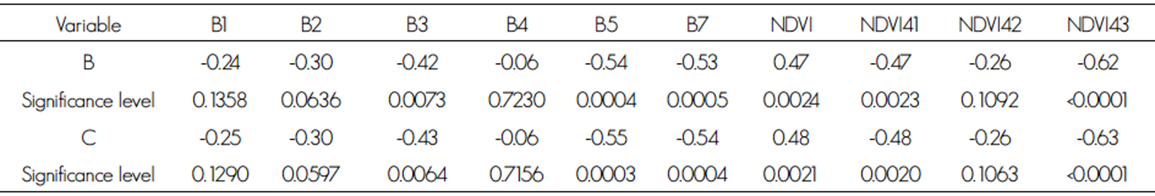
The forest variables biomass and carbon showed a negative correlation with the spectral data (Table 2). According to Hall et al. (2006) and Aguirre et al. (2009), this is accounted for by the decreased albedo in areas with dense, closed vegetation. Although little correlation was found between the biomass and the carbon with the reflectances of bands 1, 2, 4, and the NDVI42 vegetation index, the NDVI43 vegetation index had the highest correlation, with a value of -0.62 for biomass and -0.63 for carbon. Aguirre et al. (2009) recorded a correlation value of -0.80 between the NDVI43 and the aboveground arboreal carbon. The results obtained confirmed the findings of Gong et al. (2003) and Aguirre et al. (2009): that the density of conifer forests (with needle leaves) is better accounted for by moisture sensitive indices than by chlorophyll sensitive indices. The negative sign indicates that the forest density is inversely proportional to the hydric stress of the vegetation (NDVI43). Therefore, the NDVI has good correlations with the forest variables of interest, due to the reflectivity caused by the vegetation’s chlorophyll. As observed by Chuvieco (1998) and Soria and Granados (2005), when the vegetation suffers from any type of stress (pests, drought, etc.), its reflectance in NDVI is lower, and therefore, an area with healthy vegetation will have a higher contrast between the bands that make up this index (close infrared and red).
Selected models
Vegetation indices based on the reflectance of the green, red, and close and medium infrared best described the behavior of the biomass and carbon, due to the strong absorption of energy caused by the presence of vigorous, healthy vegetation, chlorophyll absorption, and vegetation moisture (Soria and Granados, 2005). Table 3 shows the models selected with the stepwise regression procedure for estimating biomass and carbon based on spectral data.
Table 3 Selected regression models.
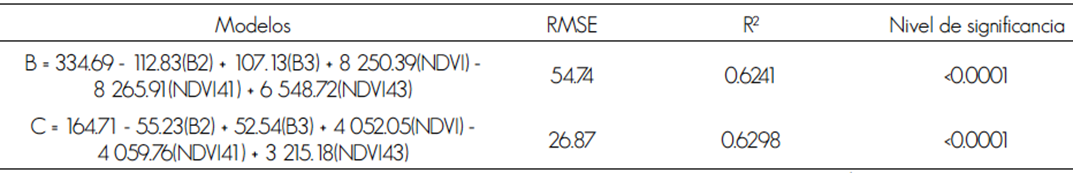
B= Biomasa (Mg ha-1); C= Carbono (Mg ha-1); B2 = Reflectancia en banda verde; B3 = Reflectancia en banda rojo; NDVI = Índice de vegetación de diferencia normalizada.
Various studies have utilized spectral data to estimate the forest variables that have shown a wide variety of precision levels (RMSE) and determination coefficients (R2). Aguirre et al. (2009) calculated a carbon RMSE of 22.24 Mg ha-1 in a Pinus patula Schiede ex Schltdl. & Cham. forest in central Mexico, using data from the SPOT 5 HRG sensor; they made estimates using multiple linear regression and the non-parametric k-nearest neighbor procedure (k-nn). Furthermore, 0.70 was the value of R2 for the regression model selected to quantify carbon with a confidence level of 99 %.
On their part, Labrecque et al. (2006) determined RMSE values of 59, 59 and 58 (Mg ha-1) for conifer, deciduous and mixed forests, respectively, in order to map the forest biomass in a pilot region in western Canada using Landsat TM imagery. Escandón et al. (1999) utilized the same sensor, but with a different approach, and evaluated two methods to estimate the arboreal biomass. The former method consisted in a six- band supervised multispectral classification; it used vegetation types identified by the makeup of the biomass of the dominant genera and by the estimated average height of the canopy. The latter method used normalized difference vegetation indices (NDVI) of bands TM4/TM3; TM4/TM5 and TM4/TM7; subsequently, they applied a regression model that related the average biomass with digital values or levels (DL) to the NDVIs. The exponential model turned out to have the best fit for the three NDVIs; the values obtained for the NDVIs were TM4/ TM3 (R2= 0.61), TM4/TM5 (R2= 0.67) and TM4/TM7 (R2= 0.68). Comparatively, the values obtained by Aguirre et al. (2009) are closer to those of the present study and are considered to be acceptable for this type of research.
The identified differences with respect to the previously cited experiences may be accounted for by the different spatial (Aguirre et al., 2009) and spectral resolutions (Soria and Granados, 2005) provided by the LANDSAT and SPOT satellites.
Comparison between the biomass-carbon estimates with the selected models
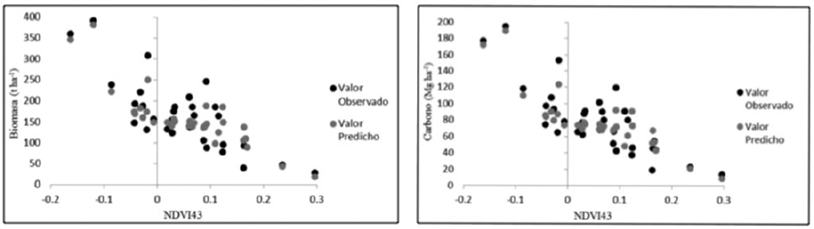
Figure 2 shows the relationship between the regression models developed as viable for use in forests. The utilized variable was the hydric stress index (NDVI43) because it proved to be highly significant (p≤0.0001) and had the highest correlation with the variables of interest. An inversely proportional relation was identified, i.e. the values for biomass and carbon were observed to increase with lower hydric stress indices (NVDI43), reflecting the carbon capture potential of this type of vegetation.
Application and validation of the models
The selected models were applied to the reflectances of the bands and to the corresponding vegetation indices, and the biomass and aboveground arboreal carbon content were estimated by extrapolating them to the study area.
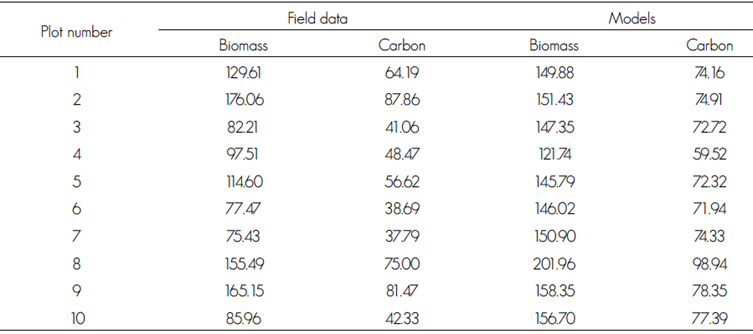
Table 4 shows the comparison between the values estimated for in-field biomass and carbon and those derived from the generated regression models.
Table 4 Biomass (Mg ha-1) and carbon contents (Mg ha-1), estimated in field vs. with the generated models.
The availability of data from remote sensors with an enhanced spectral resolution can improve these assessments (Thenkabail et al., 2004). Within this context, the obtained results coincide with the findings of Fernández et al. (2005), according to whom, despite certain limitations, the images from this source are valid for estimating forest parameters at a regional scale.
Generation of biomass and aboveground arboreal carbon maps
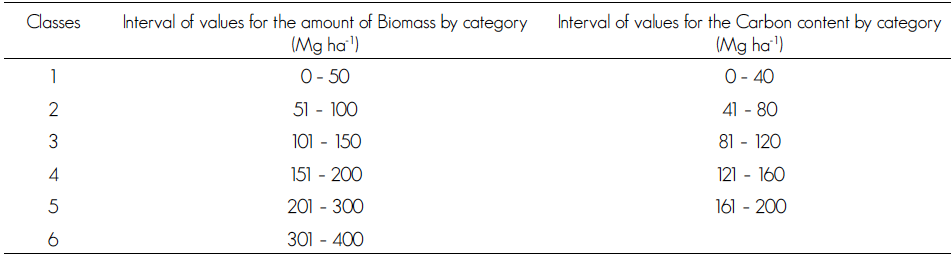
Based on the analysis of the maximum biomass and carbon values of the sampling sites, numbers were determined for the pixels of the 400 Mg ha-1 images of the biomass and for those of the 200 Mg ha-1 images of the carbon content. In order to facilitate the interpretation of both maps, the data were grouped into classes and intervals (Table 5).
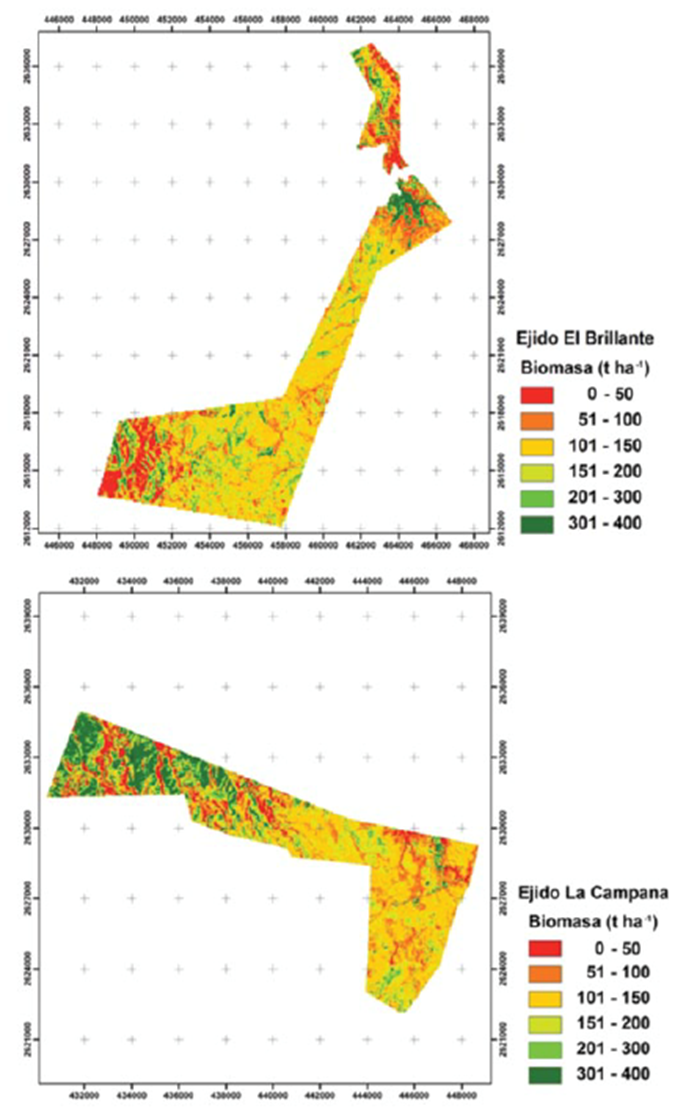
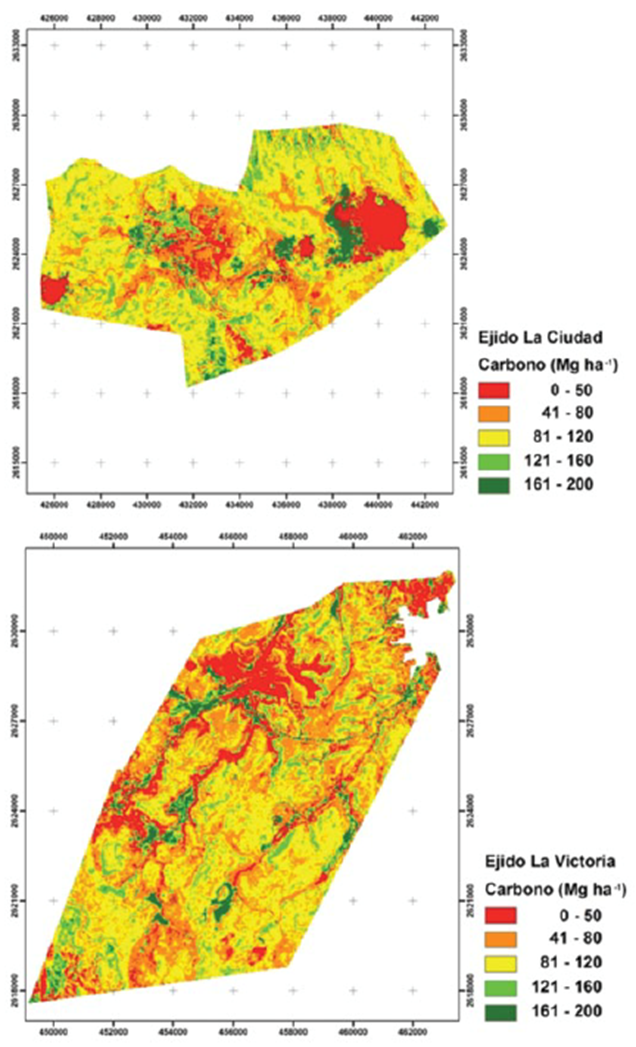
Figures 3 and 4 show the generated maps of the biomass in the ejidos El Brillante and La Campana and the total carbon content of the plots in the ejidos La Ciudad and La Victoria.
In the maps generated for the forest regions of the study area, the various colors represent the different values of the biomass and aboveground arboreal carbon contents present in the assessed ejidos, in tons per hectare. For example, when taking the carbon map for ejido La Victoria as a parameter, each color refers to the carbon contents in this plot, with a maximum value of up to 200 tons in the forest areas.
Furthermore, this type of maps can prove useful to those who work with the natural resources, as a contribution to raising awareness of the causes of the loss of forests and forest carbon through the enhancement of forest management and the preservation of the forest’s biodiversity.
Conclusions
The variables estimated based on the selected spectral bands of the Landsat TM sensor showed the highest correlations with the forest parameters of interest, among which the hydric stress index attained the highest value (NDVI43); this confirms the importance of the spectral indices related to moisture in the prediction of forest components. The generated regression models allow reliable estimations, although the success of the results will depend on the incidence of both the spectral and the spatial resolution, as well as on the quality of the field data. In this case, the Landsat TM sensor has a spatial resolution of 30 m, compared to other satellites, which have a resolution of less than 10 m, like SPOT. Therefore, the selection of the satellite and the achievement of the best results will be determined by the level of detail and by the set objectives.
The images from remote sensors provide valuable information that can be related to the field data in order to develop new methodologies by which to estimate the forest variables -specifically biomass and aboveground arboreal carbon- at a regional scale, based on the role of forests in carbon sequestration and emissions.
Contribution by autor
René Alejandro Martínez Barrón: drafting, structuring and design of the manuscript; Óscar Alberto Aguirre Calderón: revision and editing of the article for publication; Benedicto Vargas Larreta: revision and editing of the article for publication; Eduardo Javier Jiménez Pérez: revision and editing of the article for publication; Eduardo Javier Treviño Garza: interpretation of the results and editing of the article; José Israel Yerena Yamallel: interpretation of the results and editing of the article.
Acknowledgements
We wish to express our gratitude to the Mixed Fund of Conacyt and the State Government of Durango for the financial support provided for this research through the project “Estimation of the potential of the forests of Durango for climate change mitigation”, code DGO-201-C01-165681.
REFERENCES
Aguirre S., C. A., J. R. Valdez L., G. Ángeles P., H. M. de los Santos P., R. Haapanen y A. I. Aguirre S. 2009. Mapeo de carbono arbóreo aéreo en bosques manejados de Pinus patula en Hidalgo, México. Agrociencia 43: 209-220. [ Links ]
Bedón F., P. P. y S. Pinto A. 2007. Evaluación de técnicas de detección de cambios del uso de la tierra a través del análisis multitemporal de imágenes satelitales en el Cantón Daule. www.repositorio.espe.edu.ec/bitstream/21000/514/2/T-ESPE033066-A.pdf (2 de junio de 2014). [ Links ]
Chuvieco, E. 1998. El factor de temporalidad en teledetección: evolución fenomenológica y análisis de cambios. Revista de Teledetección 10: 1-9. [ Links ]
Cohen, W. B. and S. Goward. 2004. Landsat’s role in ecological applications of remote sensing. Bioscience 54 (6): 535-545. [ Links ]
Corral R., J. J., L. B. Vargas, C. Wehenkel, O. Aguirre C., J. Álvarez G. y A. Rojo A. 2009. Guía para el establecimiento de sitios de investigación forestal y de suelos en bosques del estado de Durango. Editorial UJED. Durango, Dgo., México. 81p. [ Links ]
Escandón C., J., B. H J. de Jong, S. Ochoa G. , I. March M. y M. A. Castillo. 1999. Evaluación de dos métodos para la estimación de biomasa arbórea a través de datos Landsat TM en Jusnajab La Laguna, Chiapas, México: estudio de caso. Investigaciones Geográficas 40: 71-84. [ Links ]
Fernández M., A., C. Quintano, O. Fernández M., J. R. Dos Santos and F. D. Maldonado. 2005. Spectral Mixture Modeling to estimate wood volume in the north of Spain from optical satellite data. Ambiência 1 (2): 213-222. [ Links ]
Gong, P., R. Pu, G. S. Biging and M. R. Larrieu. 2003. Estimation of forest leaf area index using vegetation indexes derived from Hyperion hyperspectral data. IEEE Transactions on Geoscience and Remote Sensing 41:1355-1362. [ Links ]
Intergovernmental Panel on Climate Change (IPCC). 2001. Climate Change 2001: Synthesis Report. A Contribution of Working Groups I, II, and III to the Third Assessment Report. Cambridge University Press. Cambridge, UK. 398p. [ Links ]
Hall, R. J., R. S. Skakun, E. J. Arsenault and B. S. Case. 2006. Modeling forest stand structure attributes using Landsat ETM+ data. Application to mapping of aboveground biomass and stand volume. Forest Ecology and Management 225: 378-390. [ Links ]
Houghton R., A. 2005. Aboveground forest biomass and the global carbon balance. Global Change Biology 1: 945-958. [ Links ]
Labrecque, S., R. Fournier,J. Luther and D. Piercey, 2006. A comparison of four methods to map biomass from Landsat-TM and inventory data in western Newfoundland. Forest Ecology and Management 226:129-144. [ Links ]
Rock, B. N., J. E. Vogelmann, D. L. Williams, A. F. Vogelmann and T. Hoshizaki. 1986. Remote detection of forest damage. Bioscience 36: 439-445. [ Links ]
Rosenqvist, A., A. Milne,A. Lucas, M. Imhoff and C. Dobson. 2003. A review of remote sensing technologies in support of the Kyoto Protocol.Environmental Science and Policy 6: 441-455. [ Links ]
Rouse, J. W., R. H. Haas, J. A. Schell, D. W. Deerino and J. C. Harlan. 1974.Monitoring the vernal advancement of retrogradation of natural vegetation. NASA/OSFC. Type III. Final Report. Oreenbello, MD, USA. 371p. [ Links ]
Ruiz D. , C., G. Rodríguez O. y J. R. Enríquez del V. 2014. Metodologías para estimar biomasa y carbono en especies forestales de México. Naturaleza y Desarrollo 12(1): 28-45. [ Links ]
United States Geological Survey (USGS). 2013. Landsat 7 Enhanced Thematic Mapper (ETM) . http://glovis.usgs.gov/ (5 de junio de 2013). [ Links ]
Soria R., J. y R. Granados R. 2005. Relación entre los índices de vegetación obtenidos de los sensores AVHRR del satélite NOAA Y TM del Landsat. Ciencia Ergo Sum 12 (2): 167-174. [ Links ]
Thenkabail, P. S., E. A. Enclona, M. S. Ashton, C. Legg, and M. J. De Dieu. 2004. Hyperion, IKONOS, ALI and ETM+ sensors in the study of African rainforests. Remote Sensing of Environment 90: 23-43. [ Links ]
Tomppo, E., M. Nilsson, M. Rosengren, P. Aalto and P. Kennedy. 2002. Simultaneous use of Landsat-TM and IRS-1C WiFS data in estimating large area tree stem volume and aboveground biomass. Remote Sensing of Environment 82: 156-171. [ Links ]
Unidad de Conservación y Desarrollo Forestal 6 (UCODEFO 6). 1997. Memoria general de predios del programa de manejo forestal 1997-2007. El Salto, Dgo., México. 207p. [ Links ]
Zianis, D. and M. Mencuccini, 2004. On simplifying allometric analyses of forest biomass. Forest Ecology and Management 187: 31-332. [ Links ]
Received: December 15, 2015; Accepted: April 10, 2016
 Este es un artículo publicado en acceso abierto bajo una licencia Creative Commons
