


Services on Demand
Journal
Article
 text in
  English (pdf)
 Article in xml format
 Article references
 Send this article by e-mail
Indicators
-
 Cited by SciELO
 -
 Access statistics
Related links
-
 Similars in
SciELO
Similars in
SciELO
Share

 Permalink
Revista mexicana de ciencias agrícolas
Print version ISSN 2007-0934
Rev. Mex. Cienc. Agríc vol.9 n.4 Texcoco Mar./Jun. 2018
https://doi.org/10.29312/remexca.v9i4.1393
Articles
Insurance for small corn producers in the state of Puebla
1Doctoral Program in Agricultural Economics-Chapingo. Autonomous University. Highway México-Texcoco km 38.5, Chapingo, Texcoco, Mexico State, CP. 56227. Tel. 01(595) 1089621. (ceemes-abelpz@yahoo.com.mx; mportillo49@yahoo.com.mx).
For the small agricultural producer of the state of Puebla, with up to five hectares of surface area for production, the insurance systems offered by the private sector, or those of catastrophic insurance offered by the Government, are not within reach. Among the causes is the absence of a culture of risk management and the lack of approach to formal financial services. The present study exposes the proposal of a scheme of agricultural and personal insurance, under criteria of simplicity, offers the small farmer an affordable alternative, which bases its financial figures on the results of a linear regression calculated with data of the historical yields of the region, for a technically viable period, able to show the trend and future projection in tons per hectare. The cost of the insurance premium is obtained by applying the price of the product in question to the average of the variations with respect to its trend line, and the insured amount is obtained by valued at the same price, the estimated yield of the immediate subsequent cycle. This model ensures that in the medium term the producer receives every two years an amount equivalent to half of what he pays for insurance or an accumulated fund available for pension or compensation in stages of unemployment.
Keywords: insurance; linear regression; premium; risks
Para el pequeño productor agrícola del estado de Puebla, con hasta cinco hectáreas de superficie para la producción, no están a su alcance los sistemas de aseguramiento ofrecidos por el sector privado, ni los de seguros catastróficos ofrecidos por el gobierno. Entre las causas resalta la ausencia de una cultura de administración del riesgo y la falta de acercamiento a los servicios financieros formales. El presente estudio expone la propuesta de un esquema de aseguramiento agrícola y personal, bajo criterios de sencillez, ofrece al pequeño agricultor una alternativa asequible, que basa sus cifras financieras en los resultados de una regresión lineal calculada con datos de los rendimientos históricos de la región, por un periodo técnicamente viable, capaz de mostrar la tendencia y proyección a futuro en toneladas por hectárea. El costo de la prima de aseguramiento se obtiene aplicando el precio del producto en cuestión al promedio de las variaciones con respecto a su línea de tendencia, y el monto asegurado se obtiene valuando al mismo precio, el rendimiento estimado del ciclo inmediato posterior. Con este modelo se asegura que en el mediano plazo el productor reciba cada dos años un monto equivalente a la mitad de lo que paga por el seguro o bien, un fondo acumulado a su alcance para pensión o indemnización en etapas de desocupación.
Palabras clave: prima; regresión lineal; riesgos; seguro
Introduction
There are numerous risks to which agricultural producers in Mexico are exposed, the nature of the agricultural activity carried out by the different sectors of producers implies risks derived from climate change, biological processes and market variations, which impact the production and yield of crops, as well as investment and income, in this regard it is indicated that 78.2% of the losses for small producers are due to natural causes, among which the climatic eventualities stand out. AGROASEMEX (2015). Together with these, they are also exposed to physical and social personal risks that temporarily or permanently truncate their capacity or productive possibility, to situate the problem, 40.5% of the rural population is 60 years of age or older (ENA, 2014).
Small producers that own up to five hectares of agricultural land in Mexico, generate 39% of national agricultural production, produce 40% of the food of the country UNAM (2015), represent 67% of farmers in the field, are responsible for 56.8% of the agricultural employment, all this made 16.9% of the arable land whose greater proportion is worked under the modality of temporary (Administracion, 2016).
Mexico is one of the developing countries that has advanced agricultural insurance schemes by indexes subsidized by the government, or under the management of insurance funds and although it tries to prioritize the most vulnerable sector, the external evaluations that have been applied to the programs of Government for insurance, realize that the sector of small producers continues to be outside the scope of these benefits in addition to social security because they only apply in formal work relationship schemes.
Experience in underdeveloped countries has shown that only insurance systems that are highly subsidized by the state subsist, which rather represent a charge to public spending that is not capitalized on the increase of agricultural assets, on the contrary, it encourages intentional exposure from the producer to the risk to be compensated.
The risk management must be scrupulously studied and estimated avoiding, for the benefit of the small producer, the complexity of the calculations and actuarial standards that have contributed to the high costs of these financial services and therefore the apathy of the farmer. For this it is necessary to identify in the nature of the risk, the type of convenient insurance that offers institutional and financial certainty. An insurance classification made by the Japan International Cooperation Agency groups the most representative in three sectors: crop insurance, income insurance and index insurance. The first requires the determination of the specific risks per agricultural unit, which represents high administrative costs, the second, although it guarantees the perception of income, is inherent in the variation of prices of agricultural products and the supervision of the decrease in harvests, index insurance is convenient in this case because it uses values obtained from the measurement of events related to the harvest that may derive from climatic quantification or yield per area, the latter regularly subsidized by governments.
Hardacker (2015) classified agricultural risks in human risks, risks of exploitation assets, production risks, market risks, institutional risks, commercial risks and financial risks, for which the scheme proposed here conceptualizes the climatic and biological risks that they diminish the production and the risks of the peasant in his person that prevent him to carry out the work, like agricultural risks that can be combined in a single fund for his indemnification.
The moral hazard and the risk of adverse selection can occur when establishing insurance schemes given the economic incentive it represents for individuals to be insured at average rates, when they are exposed to a probability of loss greater than the average of the population, in this case, there is an effect known as “moral hazard” where there is a certain indifference to the loss as a consequence of the existence of insurance Arias (2006); however, it is intended that they will not impact on this proposal.
The amount that the buyer of an insurance is willing to pay based on the expected income, to reduce the uncertainty and have an income in case of loss, a value finite to the infinite growing trend of paying more for an expected value increasing , discovering that what you are looking for is a utility and that this is not a line parallel to the wealth you can count on, but that it increases to decreasing values, supporting affirmation: “the utility resulting from any small increase in wealth it will be inversely proportional to the amount of assets previously owned” with which it makes clear that a certain and determined gain is more significant for a poor person than for a rich person. Therefore, the expected value is given by:
And the expected utility is given by:
And to go towards a diminishing marginal utility of income, he proposed a Neperian logarithmic utility of the quantity of money, which is concave (Miller, 1984):
This raises the concern of how much is willing to pay to mitigate the effects of the disaster, where the theory of Markowitz (1959) is useful that is associated with the probability distribution of returns, in this, the quantification to measure the total risk of an investment is the variance or standard deviation of its yields, where on the one hand it is through the expected returns determined by the sum of the products of the different yields by their probabilities:
Where: rᵢ denotes the yield of i of the probability distribution and pᵢ the probability that the yield i occurs and, there are n possible rates of return or by means of the variance (or standard deviation) of the yields, being the first, with the aforementioned notations equal to (Markowitz, 2006):
The study Guitton (1954) in his book oscillation and growth, shows how the high variation of the data with respect to its average in a long cycle, takes a decreasing or negative trend, while a lower variation shows a tendency of growth to appreciate in an extended period, whose cyclical succession of data does not have perfect autonomy, which is useful for the stability expectations of small producer income, based on the coverage offered by an insurance system for times of negative returns, he considers the lapses according to the object of study and exemplifies with lapses of ten years. Combined the viability of the lapse from the business perspective as noted by Schumpeter (1935), who defined as a medium cycle a lapse of five to ten years (Sotelo, 2003).
Hypothetically, it is considered that an agricultural insurance scheme for small producers, which is made from a regression on regional historical yields, will make the determination of the cost of the premium and the insurable amount, a simple mechanism that can do without the costs for moral risk and risk of adverse selection, thus decreasing its administrative costs. The simplicity of the model and its requirement only of the calculation of the variations on the central tendency, and the estimation of the subsequent performance of the production cycle in question, emits the cost of the premium and the amount to be insured by applying the current price. in the local market, the product to be insured, whose accumulation of funds in insurance or banking institutions, will allow its availability to reimburse the low loss rate, unemployment or retirement pension in old age.
This insurance scheme will transfer the risk to the specialized sector, while using a simple and low-cost mechanism to make it accessible to the producer and attractive to the commercial insurer, with the expectation that its adoption will be in the interest of the sector. small farmers to contribute to the stability of their income, and is the precedent of an approach to self-management of risk and the approach to the use of modern financial services.
With regard to the objectives, the corn yields of the different Rural Development Districts (DDR) of the state of Puebla for a period of 12 years are analyzed, obtaining the linear regressions and the projections for the determination of the cost of the premium and the insured amount, in order to identify its reasonableness, likewise the financial formulas of annuities are applied to the costs of the premiums to determine the quantification of the funds that are foreseen available for the compensations, thus making sure of the simplicity of the scheme of determination of agricultural insurance for the small producer.
Materials and methods
The design of an insurance scheme for the small farmer, includes in its structure two aspects, the calculation of the premium and insurance coverage and the investment that in the form of savings facilitates the producer the availability of accumulated funds for compensation, both planes based on academic principles.
The main instrument used to calculate the cost of the premium and the determination of the agricultural coverage is the statistical regression technique applied to production data and yields of the basic crop (for this case, white corn), calculated in the Statistical Analysis System (SAS) program that provides the estimation equation.
Under the principle of the theory of economic cycles as the basis of the instruments used, a period of fourteen years (2000-2013) of yields of the reference crop will be taken for each DDR published by the Agricultural and Livestock Information System (SIAP) of the Ministry of Agriculture, Livestock, Rural Development, Fisheries and Food (SAGARPA).
The variables for the regression are time and yield per hectare, of which the resulting dispersion graph and the resulting central trend line show the variations in yields, of which their average will be the basis for the cost of the premium and the future estimate 2014 and 2015 will be the basis for the insurable amount.
To economise the extension of the present article, the application of two DDR is presented that denote different results explained from the heterogeneity of height, humidity, type of soil, temperature, technology and irrigation infrastructure, this sectorization is subdivided in turn by productive cycle and water regime.
The sequence of instructions to enter the SAS program is as follows:
First instruction: data corn (indicating the name of the data set).
Second instruction: Input T R (indicate the entry of the two variables: time and yields) third instruction: T2=T*T; T3= T2*T, (instructs that the variables can be integrated into a quadratic function if the trend is tied to the curve of a concavity or a possible cubic function if the trend curve is shown in two concavities).
Fourth instruction: Cards (indicates the entry of the data of the variables).
The years to be estimated are included by placing only one point in the performance variable and the list of values is closed with a semicolon as a sign that the list of values has ended.
Fifth instruction: Proc Plot; Plot R*T, (indicating that the graph of the distribution of the annual yields in the Cartesian plane is processed and that it considers the variables R and T on the Y axis and on the X axis, respectively.
Sixth instruction: Proc Glm; Model r= t t2 t3/predicted (instructing the execution of a regression with the variables R and T and with T2 and T3, which give concavity (s) to the trend line if this is indicated by the behavior of the returns in the analyzed period The plotting of a quadratic or cubic curve of estimated values between the two variables such that the variation of the dispersion values, are above that curve (positive) and below (negative) according to their location, but that ensure equivalent variation each instruction is closed with the sign (point and coma) to indicate that the instruction in question ends there and that it must continue with the next one.
Once the aforementioned instructions have been concluded, the program “runs” by activating the “run” icon or its equivalent window with what it processes and displays the results.
The savings scheme linked to the payment of the insurance premium is calculated by means of the financial formula for annuities, in the expectation that the payment of the premiums will be analogous to the savings system, where the investment is accumulated in a fund operated similarly to savings systems for retirement and allow their availability to compensate for zero returns, periods of unemployment or pension.
The estimation of the accumulation of funds is obtained through (Weston, 2012):
Where: i= interest rate for the period; r= number of periods; m= amount of investments.
Results and discussion
The load and run of data in SAS of the variables time in years, and yields in tons of corn per hectare in the DDR of Teziutlan and Zacatlan of the state of Puebla, by the spring and winter production cycles in the irrigation water regimes and of temporary, they issued the results in Table 1.
Table 1 Teziutlan Puebla spring-summer cycle “temporary” water regime.
| Procedimiento GML | ||||||||
|---|---|---|---|---|---|---|---|---|
| Variable dependiente: R | ||||||||
| Fuente | DF | Suma de cuadros | Cuadrado de la media | F-Valor | Pr > F | |||
| Modelo | 1 | 3.01501582 | 3.01501582 | 19.32 | 0.0009 | |||
| Error | 12 | 1.87258418 | 1.15604868 | |||||
| Total correcto | 13 | 4.88760000 | ||||||
| R-cuadrado | Coef Var | Raiz MSE | R media | |||||
| 0.616870 | 25.00190 | 0.395030 | 1.580000 | |||||
| Cuadrado de | ||||||||
| Fuente | DF | Tipo I SS | la media | F Valor | Pr > F | |||
| T | 1 | 3.01501582 | 3.01501582 | 19.32 | 0.0009 | |||
| T2 | 0 | 0.00000000 | . | . | . | |||
| T3 | 0 | 0.00000000 | . | . | . | |||
| Fuente | DF | Tipo III SS | Cuadro de la media | F Valor | Pr > F | |||
| T | 0 | 0 | . | . | . | |||
| T2 | 0 | 0 | . | . | . | |||
| T3 | 0 | 0 | . | . | . | |||
| Parámetro | Estimación |
Error Estándar |
Valor t | Pr>|t| | ||||
| Termino in | 232.5700440 B | 52.55080722 | 4.43 | 0.0008 | ||||
| T | -0.1151209 B | 0.02619023 | -4.40 | 0.0009 | ||||
| T2 | 0.0000000 B | . | . | . | ||||
| T3 | 0.0000000 B | . | . | . | ||||
It shows R² as an indicator of how far away the observed data is from those estimated by the trend line; when it is high (value close to 1) it indicates that the variation of data with respect to the trend line is low and when it is low (value close to 0) it indicates that the observed data is far from the trend line. The coefficient of variation, T² and T3 is 0 indicating that it would not apply a quadratic function or a cubic function. The mean of the squares for the value of the starting point is 3.01501582 and the proof of F is lower for what is significant; however, for the linear function it offers the estimate of the intercept and the value of the variable T to integrate the dependent variable R with a standard error of 0.02619023, for the intercept 232.570044 and of -0.1151209 for the estimate of T, which are accepted since they meet the test parameter of t. Hence, the function is:
R = 232.5700440 - 0.1151209T
In the output also displays the values of the observed data and the estimates showing the variations as residuals, established in three columns whose rows correspond to the arithmetic operation of each of the observed values with respect to their estimates.
Check that the sum of the residuals effectively add up to zero confirming that the estimated trend is just neutral between the dispersion of values above the trend line that are positive and those dispersed below the line whose values are negative, for consequently also indicates that the sum of the squares of the residuals add up to zero; however, the sum of the squares of the residuals converted to positive given their squared elevation is 1.87258418 reiterating that the observed values are somewhat distant from the estimated trend line.
It also indicates which level of correlation the variables have among each other, a fact that is useful to rule out any dependency on values and ensures what happens in the different periods that is not a function of the periods that precede or proceed (Table 2).
Table 2 GLM procedure, in the SAS system.
| Sistema SAS | ||||||||
|---|---|---|---|---|---|---|---|---|
| Procedimiento GLM | ||||||||
| Observación | Observado | Predichos | Residual | |||||
| 1 | 1.96000000 | 2.32828571 | -0.36828571 | |||||
| 2 | 2.17000000 | 2.21484216 | -0.04316484 | |||||
| 3 | 2.30000000 | 2.09804396 | 0.20195604 | |||||
| 4 | 2.00000000 | 1.98292308 | 0.01707692 | |||||
| 5 | 2.00000000 | 1.86780220 | 0.13219780 | |||||
| 6 | 2.50000000 | 1.75268132 | 0.74731868 | |||||
| 7 | 1.72000000 | 1.63756044 | 0.08243956 | |||||
| 8 | 0.75000000 | 1.52243956 | -0.77243956 | |||||
| 9 | 1.18000000 | 1.40731868 | -0.22731868 | |||||
| 10 | 1.60000000 | 1.29219780 | 0.30780220 | |||||
| 11 | 1.31000000 | 1.17707696 | 0.13292308 | |||||
| 12 | 0.56000000 | 1.06195604 | -0.50195604 | |||||
| 13 | 1.26000000 | 0.94683516 | 0.31316484 | |||||
| 14 | 0.81000000 | 0.83171429 | -0.02171429 | |||||
| 15* | . | 0.71659341 | . | |||||
| 16* | . | 0.60147253 | . | |||||
| *Estimados automáticamente por el programa | ||||||||
| Suma de residuales | -0.00000000 | |||||||
| Suma de residuales cuadrados | 1.87258418 | |||||||
| Suma de residuales cuadrados - Error SS | 0.00000000 | |||||||
| Autocorrelación del primer orden | 0.01357853 | |||||||
| Durbin - Watson D | ||||||||
Converting the numerical results in Figure 1 would be expressed as follows.
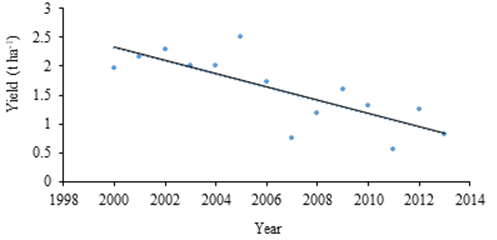
Figure 1 Tendency of yields in white corn cultivation in Teziutlan, Puebla. Spring-Summer cycle, irrigation.
It can be seen that the regression line shows a slight downward trend as indicated by the negative coefficient of the variable (T) and that this trend is consistent with a median variation of the yields in the analyzed period, so that the premium insurance will be of medium magnitude while the instability of the yields is not moderated.
The average of the deviations of the yields with respect to the trend line in this case is 0.2764113 tons or 276.64 kg that valued at a hypothetical price of 3 pesos per kg as the price at the moment of paying the insurance premium for 2015, this would amount to $829.23 pesos per hectare. The sum insured for this case is the quotient that results from multiplying the expected return for 2015 by 0.6015 t ha-1, by the hypothetical price of $3 000.00 per ton resulting in $1 804.50 (Table 3 and Figure 2).
Table 3 Zacatlan Puebla Spring-Summer cycle irrigation water regime.
| Sistema SAS | ||||||||||
|---|---|---|---|---|---|---|---|---|---|---|
| Procedimiento GLM | ||||||||||
| Variable dependiente: R | ||||||||||
| Fuente | DF | Suma de cuadrados | Cuadrado de la media | F-Valor | Pr > F | |||||
| Modelo | 1 | 0.06800119 | 0.06800119 | 0.20 | 0.6662 | |||||
| Error | 12 | 4.17279881 | 0.34773323 | |||||||
| Total correcto | 13 | 4.24080000 | ||||||||
| R-cuadrado | Coef Var | Raiz MSE | R media | |||||||
| 0.016035 | 22.42164 | 0.589689 | 2.630000 | |||||||
| Fuente | DF | Tipo I SS | Cuadrado de la media | F-Valor | Pr > F | |||||
| T | 1 | 0.06800119 | 0.06800119 | 0.20 | 0.6662 | |||||
| T2 | 0 | 0.00000000 | . | . | ||||||
| T3 | 0 | 0.00000000 | . | . | ||||||
| Fuente | DF | Tipo III SS | Cuadrado de la media | F-Valor | Pr > F | |||||
| T | 0 | 0 | . | . | . | |||||
| T2 | 0 | 0 | . | . | . | |||||
| T3 | 0 | 0 | . | . | ||||||
| Parámetro | Estimación | Error estándar | Valor t | Pr > |t| | ||||||
| Término in | 34.15150259 B | 71.28084035 | 0.48 | 0.6405 | ||||||
| T | -0.01570466 B | 0.03551350 | -0.44 | 0.6662 | ||||||
| T2 | 0.00000000 B | . | . | . | ||||||
| T3 | 0.00000000 | . | . | . | ||||||
| Observación | Observado | Predichos | Residual | |||||||
| 1 | 2.90000000 | 2.74217617 | 0.15782383 | |||||||
| 2 | 3.00000000 | 2.72647150 | 0.27352850 | |||||||
| 3 | 2.80000000 | 2.71076684 | 0.08923316 | |||||||
| 4 | 2.70000000 | 2.69506218 | 0.00493782 | |||||||
| 5 | 2.50000000 | 2.67935751 | -0.17935751 | |||||||
| 6 | 2.86000000 | 2.64794819 | 0.21205181 | |||||||
| 7 | 1.00000000 | 2.63224352 | -1.63224352 | |||||||
| 8 | 3.0000000 | 2.61653886 | 0.38346114 | |||||||
| 9 | 3.0000000 | 2.60083420 | 0.39916580 | |||||||
| 10 | 3.21000000 | 2.58512953 | 0.62487047 | |||||||
| 11 | 2.00000000 | 2.56942487 | -0.56942487 | |||||||
| 12 | 2.20000000 | 2.55372021 | -0.35372021 | |||||||
| 13 | 2.79000000 | 2.53801554 | 0.25198446 | |||||||
| 14 | 2.86000000 | 2.52231088 | 0.33768912 | |||||||
| 15* | . | 2.50660622 | . | |||||||
| * La observación no se ha usado en este análisis | ||||||||||
| Datos de 2000 ╦ 2013, El 2015 no cuenta como dato. | ||||||||||
| Suma de residuales | 0.00000000 | |||||||||
| Suma de residuales cuadrados | 4.17279881 | |||||||||
| Suma de residuales cuadrados - Error SS | -0.00000000 | |||||||||
| Autocorrelación de primer orden | -0.16748254 | |||||||||
| Durbin-Watson D | 2.30166792 | |||||||||
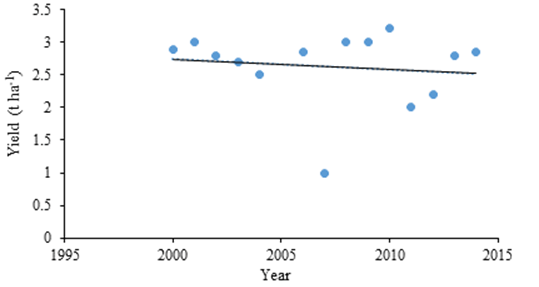
Figure 2 Lineal regression and tendency of yields in Zacatlán, Puebla. Spring-Summer cycle, irrigation.
The results for the independent variable T show the application of the linear function given the quadratic function exclusion and the cubic function since the estimated value for T² and T3 is 0.
The mean of the squares for the value of the broken point is 0.06800119 and that the test of F is inferior for what is significant; however, for the linear function it offers the estimate of the intercept and the value of the variable T to integrate the dependent variable R with a standard error of 0.0355135, for the intercept 34.15150259 and of -0.01570466 for the estimate of T itself, they are accepted that meet the test parameter of t. Hence, the function is:
R = 34.15150259 - 0.01570466 T.
The trend is consistent with a high variation in yields in the period analyzed, so that the insurance premium will be of a high magnitude until yield instability moderates.
The average of the deviations of the yields with respect to the trend line in this case is 0.39067802 tons or 390.68 kg, which valued at a hypothetical price of 3 pesos per kg as the price at the time of paying the insurance premium for 2015, this would amount to $1 172.03 pesos per hectare.
The sum of the expected return for 2015 for 2.50660622 t ha-1, for the hypothetical price of $3 000.00 per t resulting in $7 519.82, this being the amount of the sum insured.
A financial calculation under the principle of annuities to accumulate the payment of premiums as an individual savings fund for a period of five years and a conservative rate of 5.31% per annum (rate applied by the CETES on the savings system simulator for the withdrawal of the CONDUSEF), the following is for a producer who ensures 5 ha of maize sowing in Teziutlan:
Insurance premium: $829.23 * 5 ha= $4 146.00 annual savings
Likewise, the biannual reimbursement figure of 50% of the premiums paid is: = $4 146.00.
In the case of the small producer who ensures 5 ha of corn planting in Zacatlan:
Insurance premium: $1 172.00 * 5 ha= $5 860.00 annual savings.
Or, the biannual reimbursement figure of 50% of the premiums paid is: = $5 860.00
The particularities of the proposed agricultural and social insurance scheme that distinguish it from the traditional insurance scheme are that the variables on which the cost of the premium and the projection of the sum insured are determined, come from the variations of the yields and their tendency for which they do not require checks of the investment of the sowing or that an adjuster of faith of the damage to the production, situation that in addition to shielding the authenticity of the information, does not incur costs of moral risk and adverse selection, the focus is to maintain the stability of the producer's income by inhibiting the intention of any act that vitiates its potential productive capacity.
The types of agricultural risks that can be faced by the producer are already implicit in the model when considering their probability in the historical performance of the yields and, as far as the validity of the rates is concerned, this enjoys implicit maintenance of the update since the calculations are in products in kind and at the moment of carrying out the financial operations, the current regional price is met.
On the other hand, the Law of the Mexican Institute of Social Security (IMSS) states in Article 154 that Unemployment in advanced age is when the insured is deprived of paid work as of the age of 60, when in the agricultural field, 40.50%, of people are in that age and more. Circumstances that increasingly merit thinking about the financial sustainability of this sector, in addition to a gradual autonomy of the subsidy that although there is between 50 and 70% of the premium in most underdeveloped countries, is notoriously decreasing as can be observed in the budget allocation for 2011 amounted to 19 165.3 million pesos, 2.63 times above the programmable spending allocated to the Chamber of Deputies (DOF and PEF (2011) while for 2016 the allocation decreased by 91 percent to reach 1 668.9 million pesos, which represents only 22% of the programmable spending allocated to the Chamber of Deputies (PEF, 2016).
Conclusions
The proposed security scheme for small corn farmers in the state of Puebla uses a simple and practical methodology that offers an alternative to transfer their risk to the specialized sector, in addition to generating individual savings funds that are available to cover contingencies, involuntary temporary unemployment and even pension in advanced stages of his life.
Also, the security scheme allows to eradicate complex or onerous procedures, resulting in more benefits than traditional insurance. It also opens up the possibility of the growing adoption of this strategy in favor of risk reduction, income stability and the approach to financial services.
Finally, it is a first in the perspective of a gradual independence of the government subsidies, which is publicly known as its decreasing tendency.
Literatura citada
Valor al CampesinoAdministración. 2016. Valor al campesino, vida, nutrición y riqueza para México. Valor al campesino: http://valoralcampesino.org/2016/09/29/iniciativa-valor-al-campesino-exige-mayor-atencion. [ Links ]
AGROASEMEX. 2015. Boletines informativos. Reducción de primas de aseguramiento agrícola. http://www.agroasemex.gob.mx/comunicados/boletines. [ Links ]
Arias, R. S. 2006. El seguro agrario como instrumento para la gestión del riesgo de riesgos. Madrid. Ponencia en el Palacio Municipal de Congresos. [ Links ]
BANXICO. 2016. Banco de México. Sistema financiero mexicano. http://www.banxico.org.mx/divulgacion/sistema-financiero.html#seguros. [ Links ]
Burgaz, F. J. 2004. Gestión del riesgo agropecuario en América Latina y el Caribe. Madrid. Entidad Estatal de Seguros Agrarios. [ Links ]
Bruce I. J; Kenneth N. Levy, CFA. and Harry M. M.2006 Trimability and fast optimization of long- short portfolios. Financial Analysts Journal. 62(2):36-38. doi:https://doi.org/10.2469/ faj.v62.n2.4082. [ Links ]
Chile, S. D. 2016. Superintendencia de valores y seguros. http://www.svs.cl/portal/principal/605/w3-channel.html. [ Links ]
CONDUSEF. 2013. Evaluación 2013, servicios de aseguradoras. México. CONDUSEF. [ Links ]
CONEVAL. 2014. Encuesta a hogares rurales. México. CONEVAL. [ Links ]
DOF y PEF. 2011. Presupuesto de egresos de la federación para el ejercicio fiscal 2011. Diario Oficial de la Federación. 72-77 pp. [ Links ]
David, C. and Hatch, M. N. 2012. Un instrumento para la gestión del riesgo. Costa Rica. Instituto Interamericano de Cooperación para la Agricultura (IICA). [ Links ]
ENA. 2014. Encuesta Nacional Agropecuaria 2014. México. INEGI. [ Links ]
ENOE. 2016. Encuesta Nacional de Ocupación y Empleo. Aguascalientes. INEGI. [ Links ]
Guitton, H. 1958. Fluctuations Economiques (primera edición, Vol. I). A. Universidad de Buenos Aires, Ed., & D. García Daireaux, Trad. París, Francia: Dalloz. Coping with risk in agriculture. CABI International. USA. [ Links ]
INEGI. 2014. Encuesta Nacional Agropecuaria 2014. Instituto Nacional de Estadística y Geografía, Acceso a la Información. México: INEGI. http://internet.contenidos.inegi.org.mx/contenidos/productos//prod-serv/contenidos/espanol/bvinegi/productos/nueva-estruc/promo/ena2014-pres.pdf. [ Links ]
Drakeford, J. y Benfield, A. 2013. Agricultural Insurance: a growing class of business globally. USD forum: http://purl.umn.edu/146639. [ Links ]
Fred, J. W, Eugene F. B. 2012. Fundamentos de Administración Financiera (novena ed., Vol. I). (J. G. Mont, Trad.) México, México: Mc Graw Hill. [ Links ]
Hardacker, J.; Brian, L. G.; Anderson, J. R.; Hulrne, R. B. 2015. Coping with Risk in Agriculture (Tercera ed., Vol. I). (C. E. Parfitt, Ed.) Boston, USA: CABI International. [ Links ]
Ledesma, M. A. 2007. Agronegocios. México: El Ateneo. [ Links ]
Markowitz, J. B. 2006. Trimability and fast optimizations of long-short portafolios. Financial Analysis. 45-51 pp. [ Links ]
Molinero, J. M. 1984. La contribución de Daniel Bernoulli y Gabriel Crame. Cuadernos de Ciencias Económicas y Empresariales. 13:9-27 pp. https://dialnet.unirioja.es/ servlet/articulo?codigo=2290140. [ Links ]
Monterrey, I. T. 2016. Evaluación de diseño programa de aseguramiento agropecuario. México: MOCYR. [ Links ]
Morales, G. M. 1995. Métodos estadísticos para actuarios. Madrid, España: Complutense. [ Links ]
PEF. 2016. Presupuesto de egresos de la federación para el ejercicio 2016. Diario Oficial de la Federación. 38-44 pp. [ Links ]
Pozo, M. E. 2004. Evaluación del programa de subsidio al seguro agropecuario 2003. Querétaro: ITESM. [ Links ]
Serra A. R. 2006. El seguro agrario como instrumento para la gestión de riesgos. En CD Europea (Ed.). Conferencia internacional sobre seguros agrarios, una herramienta imprescindible para los agricultores y ganaderos. Madrid, Phytoma. 185:3-8. http://www.mapama.gob.es/es/enesa/publicaciones/08-ricardo-serra-17-nov-tcm30-130509.pdf. [ Links ]
Sharpe, W. 2006. Investors and markets: portafolio choices, assets prices and investment advice. Financial Analysis Journal. 60-65 pp. [ Links ]
Sotelo, N. M. 2003. Teorías y modelos macroeconómicos. Madrid: ESIC. [ Links ]
Thérese, S. J. 2014. Desarrollo y surgimiento de los microseguros agrícolas. Luxemburgo: Microsinsurance Network. [ Links ]
UNAM. 2015. La Jornada. Subsidios al campo para proponer un esquema de aseguramiento que le sea útil y asequible: http://www.unam.lajornada.mx. [ Links ]
Received: April 2018; Accepted: June 2018
 Este es un artículo publicado en acceso abierto bajo una licencia Creative Commons
