


 text new page (beta)
 English (pdf)
 Article in xml format
 Article references
 Send this article by e-mail
 Cited by SciELO
  Similars in
SciELO
Similars in
SciELO 
 Permalink
1 Introduction
Phthalic anhydride derivatives have been applied in the chemical industry as plasticizers and heat resistant polymers such as polyesters, polyimides, and poly(ether imide)s [1]. One of its derivatives is the 3-hydroxyphthalic anhydride (3-HPA), which exhibits a hydroxyl group substituent in position 3, Fig. 1.

In recent publications it has been shown that 3-HPA can serve as a raw material to obtain drugs with potential applications, such as, anticancer [2,3], antimicrobial and in the treatment of diabetes [4,5], herpes [6-8], HIV [9,10]. For the design and production of new drugs, it is necessary to have exact and precise values of various properties of the compounds involved in the manufacturing processes [11]. Among these, the thermochemical properties, have an important role. For example, the knowledge of the standard molar enthalpies of formation of all reactants, it allows the determination of reaction heat. The standard molar enthalpy of formation in the solid and gas phase, allows the calculation of enthalpic increments related to the contribution of functional groups concerning a base chemical structure. Therefore, it was decided to determine the main thermochemical properties of 3-HPA, whose results are reported in the present work. The temperature and enthalpy of fusion and molar heat capacity in solid phase, were obtained by differential scanning calorimetry (DSC). The molar enthalpy of sublimation at T = 298.15 K was determined by Knudsen effusion method and by thermogravimetric analysis (TGA). In this last method, as 3-HPA, sublimates and vaporizes, it was possible to obtain the molar enthalpy of sublimation and vaporization at 298.15 K, using data of process of sublimation (from 400.15 K to 470.15 K) and using data of process of vaporization (from 476.15 K to 486.15 K). The values of molar enthalpy of sublimation at 298.15 K calculated by different ways, were compared. The standard molar enthalpy of formation in the solid phase was determined from standard molar enthalpy of combustion obtained by combustion calorimetry. The standard molar enthalpy of formation in gas phase at 298.15 K, Δf H m(g), obtained from the standard molar enthalpy of sublimation and formation in the solid phase at 298.15 K was compared to the theoretical enthalpy of formation in gas phase determined from Gaussian methods at the G3 and G4 levels. Finally, Δf H m(g), standard molar enthalpy of formation in gas phase of 3-HPA was estimated from the contribution of the OH functional group related to phthalic anhydride (base chemical structure). Similar works have been done in other research [11-13], allowing their use in the prediction of data for related structures.
2 Experimental
2.1 Materials and purity control
Compound 3-HPA was acquired from Sigma-Aldrich, the purity of the indicated molar fraction was > 0.98, so it was recrystallized with ethyl acetate. Once recrystallized and purified, fusion temperature and enthalpy of fusion were determined by DSC in a Perkin Elmer DSC7 device at a heating rate of 1.0 Kmin-1 and a nitrogen flow of 30.0 cm3min-1. The DSC device was calibrated for both temperature and heat flow using an Indium sample with enthalpy of 28.6 Jg-1 and temperature of 429.75 K [14]. The 3-HPA purity was calculated using the fractional fusion technique, methodology described in other works [15,16]. High purity nitrogen (x = 0.99997) was supplied by Infra Co. The heat capacity was obtained at a heating rate of 10.0 K min-1 and nitrogen flow of 30.0 cm3min-1 in a temperature range from 293.15 to 412.15 K. The calibration was performed with aluminum oxide as a reference, using the two steps method [17]. The device shown a Cp for the aluminum oxide of 78.58 Jmol-1K-1 at 300 K, 88.71 Jmol-1K-1 at 350 K, and 95.54 Jmol-1K-1 at 400 K, these values were as reported in the literature (79.43 Jmol-1K-1 at 300 K, 88.87 Jmol-1K-1 at 350 K and 96.10 Jmol-1K-1 at 400 K) [14]. Table I shows the commercial sources, initial and final purities of compounds used in this work.
Table I Supplier, initial and final purities of the samples used m this work
| Chemical name | CAS number | Source | Initial mole- fraction purity |
Purification method |
Final mole- fraction purity |
|---|---|---|---|---|---|
| 3-HP A | 37418-88-5 | Sigma- Aldrich |
>0.98 | Recrystallization | 0.9972± 0.0012 |
| Indium | 7440-74-6 | NIST | 0.999999 | ||
| Aluminium oxide | 1344-28-1 | NIST | 0.9995 | ||
| Pyrene | 129-00-0 | J.T. Baker |
>0.99 | Sublimation | 0.9996± 0.0003 |
| Phenanthrene | 85-01-8 | J.T. Baker |
> 0.99 | Sublimation | 0.9997± 0.0001 |
| Ferrocene | 102-54-5 | Sigma- Aldnch |
>0.99 | Sublimation | 0.9997± 0.0003 |
| Anthracene | 120-12-7 | Sigma- Aldrich |
>0.98 | Sublimation | 0.9998± 0.0003 |
2.2 Combustion calorimetry
The combustion energy was determined by combustion calorimetry, in an isoperibolic calorimeter equipped with a semi-micro combustion bomb. This technique has been described elsewhere [18]. The calorimeter device was calibrated with benzoic acid as calorimetric standard (NIST Standard Material Reference 39j), its certified massic energy of combustion of Δc u = —(26434.0 ± 3.0) Jg-1 (where the uncertainty is the standard deviation of the mean) was corrected using the equation provided by Coops [19]. The energy equivalent was obtained from its complete oxidation, ϵ(calor) = (1281.2 ± 0.8) JK-1, the uncertainty is twice to the standard deviation of the mean of six calibration runs, data of calibration experiments was shown in previous work [20]. The combustion of 3-HPA was carried out under the same experimental conditions as those mentioned above for the calibration procedure, with a sample weight of 40 mg and a high purity oxygen inlet pressure of 3.04 MPa (x = 0.99999, supplied by Airgas Co). The combustion chamber was purged with oxygen for five minutes to ensure an oxidizing atmosphere; no nitric acid corrections were made. In each experiment 0.1 mL of water was added to the bomb, whose volume is 0.022 L. Cotton thread fuse was used, with a composition C1.000H1.742O0.921 and a combustion energy of Δc u = —(146945.2 ± 4.2) Jg-1 (the uncertainty is the same as standard deviation of the mean) [21]. In each experiment an ignition unit (Parr 2901) was used with an energy of 4.184 J.
The temperature measurement was carried out using a thermistor (5610 Hard Scientific), the resistance was registered with a digital multimeter HP 34420 A. Table II shows the physical properties of the materials used in the combustion experiment for this work.
Table II Physical properties at p° = 0.1 MPa
| Compound |
|
|
|
|
|---|---|---|---|---|
| 3-HPA | 164.116 | 1.624±0.060 b | 0.200 c | 1.136 ±0.025 d |
| Benzoic acid | 122.123 | 1.320 c | 0.115 c | 1.209 c |
| Cotton | 28.502 | 1.500 c | 0.289 c | 1.674 c |
a Based on the 2013 IUPAC recommendation [22].
b Calculated using Advanced Chemistry Development (ACD/Labs) Software VI 1.02.
c Estimated value in reference at T=298.15 K [23].
d Experimental average value from two experiments using DSC device. Its uncertainty corresponds to expanded uncertainty with a level of confidence of approximately 95%. Include the contributions from the calibration and u(T)=0.l K. The experiments were realized under average atmospheric pressure (78.8 kPa), u(p) = 1 kPa.
The standard mass energy of combustion of 3-HPA was determined by (1):
where ΔUIBP is the energy of the isothermal bomb process, included the ignition energy ΔUign, ΔUcorr is the correction to standard state (at p = 0.1 MPa of the pure species), mΔc u(cotton) is the combustion energy of the fuse and m(3 — HPA) is the compound’ mass.
2.3 Thermogravimetry using the Langmuir method
The enthalpy of sublimation was determined from Langmuir equation, according to the procedure described by Price [24]:
where (dm/dt)(1/A) is the rate of mass loss per area of vaporization A, p is the vapor pressure at absolute temperature T, M is the molar mass, R is the gas constant, and α is the vaporization coefficient (assumed to be 1 under vacuum conditions or macromolecules). To simplify the equation, it can be expressed as:
where
where C groups the involved constants and
2.4 Knudsen effusion method
According to the Knudsen effusion equation it is possible to evaluate the vapor pressure from rate of mass loss:
where Δm/Δt is the rate of mass loss at temperature T in the aluminum cell, w0 is the Clausing probability factor, A0 is the effusion area, R is the ideal gas constant, T is the temperature at which the loss of mass takes place and M is the molar mass. Using the above equation and the Clausius-Clapeyron equation it is possible to evaluate the enthalpy of sublimation:
where v is (Δm/Δt)T1/2, ln B includes the integration constant and the
2.5 Computational details
The Gaussian —3 and —4 theories were occupied to determine the energies at 0 K and the enthalpies at 298.15 K of the compounds studied from ab initio molecular orbital calculations and from Gaussian 09 [45-48]. In turn, the enthalpies of formation in gas phase at 298.15 K were calculated from these energies using the G3 and G4 methods and applying the considerations made by Nicolaides [49]. The methodology has already been used and validated by our research group [11].
3 Results and discussion
The molar fraction after purification of 3-HPA by recrystallization increased to a value greater than 0.99 in DSC. Hermetic aluminum cells were utilized for the enthalpy and melting temperature due to the loss of mass at lower temperatures of melting temperature. It is worth nothing that only the melting temperature of 3-HPA is reported in the literature, but not the other thermochemical properties. Table III resumes the melting temperatures, ranging around 471.15 K, the data reported in this work agrees with the values reported by other authors.
Table III. Melting temperature of 3-HPA from literature and this work
| Purity | Tfus (K) |
|
|
Method | Reference |
|---|---|---|---|---|---|
| NA | 471.15-472.15 | NA | NA | NA | 50 |
| NA | 472.15-473.15 | NA | NA | NA | 51 |
| NA | 472.15-474.15 | NA | NA | NA | 52 |
| NA | 471.15-473.15 | NA | NA | NA | 53 |
| 0.9972±0.0012 | 474.16±0.45 | 36.40±0.21 | 186.4±4.2 | DSC | Tins work |
The uncertainties correspond to the expanded uncertainty with a level of confidence of approximately 95%, including uncertainty of calibration and u(T) = 0.1 K. The experiments were made under average atmospheric pressure (78.8 kPa). u(P) = 1 kPa.
The heat capacity as a function of the temperature was determined in the range from 293.15 K to 412.15 K from DSC data. The numerical coefficients of (7) were obtained from a polynomial regression applied to a set of Cp,m(cr, Jmol-1K-1) vs T(K) data. The experiments were carried out in duplicate. Table IV shows three of six values of specific energies of combustion at 298.15 K, experimentally obtained.
Table IV Combustion experiments for 3-HPA: at 298.15 K and p° = 0.1 MPa
| Exp. 1 | Exp. 2 | Exp. 3 | |
|---|---|---|---|
| m (3-HPA)/g | 0.0390125 | 0.0382843 | 0.0387241 |
| m (cotton)/g | 0.0005212 | 0.0006911 | 0.0006135 |
| m (platinum)/g | 0.2317748 | 0.2314025 | 0.2310838 |
| Ti/K | 298.1549 | 298.156 | 298.154 |
| Tf/K | 298.7846 | 298.781 | 298.7789 |
| ΔTcorr/K | 0.053441 | 0.058209 | 0.054869 |
| ΔTc/K | 0.576259 | 0.566791 | 0.570031 |
| ε(calor)(-ΔTc)/kJ | -0.73830 | -0.72617 | -0.73032 |
| ε(cont)(-ΔTc)/kJ | -0.00067 | -0.00066 | -0.00066 |
| ΔUign/kJ | 0.00418 | 0.00418 | 0.00418 |
| ΔUIBP/kJ | -0.73479 | -0.72265 | -0.7268 |
| (-ΔUcorr)/kJ | 0.00081 | 0.00080 | 0.00080 |
| (-mΔcuo)(cotton)/kJ | 0.00883 | 0.01171 | 0.0104 |
| (-mΔcuo)(3-HPA)/kJ | 0.72515 | 0.71014 | 0.7156 |
| Δcuo(3-HPA)/kJ g-1 | -18.5876 | -18.5491 | -18.4794 |
| Average value<-18.5270±0.0160> | |||
m is the mass corrected for buoyancy using densities listed in Table 2 : ΔTc is the corrected temperature rise calculated by ΔTc=Tf-Ti- ΔTcorr, ε(cont) is energy equivalent of the contents of the bomb calculated by ε(cont) (-ΔTc)= εi(cont)(Ti-298.15K)+ εf(cont)(298.15K-Tf+ ΔTcorr), ΔUign is the ignition energy, ΔUIBP the energy of the isothermal bomb process, which was calculated by ΔUIBP=[ε(calor)(-ΔTc)+εi(cont)-(Ti-298.15 K)+εf(cont) (298.15 K - Tf+ΔTcorr)+ΔUign], εi(cont) and εf(cont) the energy equivalents of the bomb contents m the initial and final states., respectively. ΔUcorr is the correction to standard state and Δcuo (3-HPA) is the 3-Hydroxyphthalic anhydride mass energy of combustion. Its uncertainty corresponds to expanded uncertainty with a confidence level 95 % approximately.
Table V resumes the energy and enthalpy of combustion and the enthalpy of formation in solid phase of 3-HPA. The enthalpy of combustion Δc Hm at T = 298.15 K was calculated from the energy of combustion Δc Um at the same conditions. The enthalpy of formation in solid phase of 3-HPA, Δf Hm(cr), was determined from Δc Hm at T = 298.15 K and from enthalpies of formation of the products of the idealized reaction, Eq. (8). The utilized values of the enthalpies of formation in standard state at T = 298.15 K were —(285.83 ± 0.04) kJmol-1 for H2O (l) and —(939.51 ± 0.13) kJmol-1 for CO2 (g) [54].
Table V Standard molar energy and enthalpy of combustion and standard molar enthalpy of formation in solid phase at 298.15 K
a The uncertainties correspond to the expanded uncertainty with confidence level of 95% approximately, they include the calibration contributions from benzoic acid and energy of combustion of cotton thread.
b The uncertainty corresponds to the expanded uncertainty with confidence level of 95 % approximately, it includes the uncertainties of standard enthalpy of formation of H2O (l) and CO2 (g).
The rate of mass loss as a function of temperature (dm/dt) was determined by using TGA. Two thermal processes, from 400.15 K to 470.15 K and from 476.15 K to 486.15 K, corresponding to the sublimation and vaporization processes, were observed. In the first temperature range (sublimation process), the enthalpy of sublimation was calculated at average temperature of Tm = 435.15 K, Table VI. This latter value was corrected to 298.15 K according to (9).
Table VI Sublimation and vaporization enthalpies for 3-HPA
|
|
Interval of T/K |
Tm/K |
|
Method |
|---|---|---|---|---|
| 102.9±0.4 a c | 400.15-470.15 | 425.15 | 16.8±0.4 a d | TGA, sublimation process |
| 103.0±1.8 a c | 332.60-342.28 | 336.42 | 104.1±3.6 a d | Knudsen efussion |
| 62.8±1.3 b c | 476.15-486.15 | 481.15 | 75.2 ±2.6 b d | TGA, vaporization process |
a Sublimation enthalpy.
b Vaporization enthalpy.
c The weighted average value (μ) and its standard deviation (σ) were calculated as μ = Σ(xi/σi2)/Σ(1/σi2) and σ2 = N[1/Σ(1/σi2] respectively, where xi is each one of the N enthalpies of sublimation and vaporization data, and σi is its respective standard deviation. The experiments of sublimation and vaporization were realized under average atmospheric pressure (78.8 kPa), u(P) = 1 kPa.
d The uncertainties presented corresponds to twice the combined standard.
where
In turn, this sublimation enthalpy was compared with that obtained via Knudsen effusion, where solid-gas equilibrium can be guaranteed. The effusion process was performed in a range temperature from 332.60 K to 342.28 K, Table VI. The enthalpy of sublimation at Tm = 336.42 K was corrected to 298.15 K through the Eq. (9). The values of the sublimation enthalpies calculated by using both methods, are shown in Tables VI and VII. On the other hand, the enthalpy of vaporization at average temperature of 481.15 K,
where
Table VII Comparison of enthalpies of sublimation
|
|
TGA |
Knudsen efussion |
TGA |
|
|---|---|---|---|---|
| 29.5±0.5 | 75.2±2.6 | 104.1±3.6 | 106.8±0.8 | 104.7±2.6 |
a Value calculated by equation:
All the uncertainties correspond to twice the combined standard.
The heat capacity for gas phase at Jmol-1 K-1 was evaluated taking into the vibrational frequencies determined from B3LYP /6-311G++** theory level, Eq. (11).
From Table VIII, comparing the enthalpy of sublimation at 298.15 K obtained by Knudsen effusion and thermogravimetric data, at lower temperatures of the melting temperature, it can be observed that there is a difference between both of 2.7 kJmol-1. Likewise, it is observed that by adding the vaporization enthalpy with the fusion enthalpy at 298.15 K, the estimated value of the sublimation enthalpy presents a difference of 0.6 relative to the value obtained by Knudsen effusion technique. This procedure was validated with pyrene (with a difference of 0.3 kJmol-1) and phenanthrene (with a difference of 0.7 kJmol-1).
Table VIII Standard molar enthalpies of formation and sublimation of 3-HPA at 298.15 K
|
|
|
|
|---|---|---|
| -681.6±5.7 | 104.1±3.6 | -577.5±6.7 |
The uncertainty corresponds to the expanded uncertainty with a level of confidence of approximately 95%.
The enthalpy of formation in gas phase was determined from Eq. (12) and was summarized in Table VIII.
The theoretical enthalpy of formation in gas phase of 3-HPA at 298.15 K was determined using the energies obtained by G3 and G4 methods [47,55-57]. These energies were applied in atomization and isodesmic reactions and are shown in Tables IX and X.
Table IX Energies calculated at 0 K from G3 and G4 method for reference compounds used in this work a
| Compound | G3 | G4 | ||
|---|---|---|---|---|
| E0 | H298 | E0 | H298 | |
| C | -37.827717 | -37.825356 | -37.834168 | -37.831808 |
| H | -0.501003 | -0.498642 | -0.501420 | -0.499060 |
| 0 | -75.030991 | -75.02863 | -75.045501 | -75.043141 |
| 3-HPA | -607.835396 | -607.825585 | -607.943830 | -607.934210 |
| Benzene | -232.052179 | -232.04673 | -232.093978 | -232.088577 |
| Methane | -40.457626 | -40.453810 | -40.465299 | 40.461483 |
| Ethane | -79.723397 | -79.718911 | -79.738111 | -79.733661 |
| Ethene | -78.507414 | -78.503411 | -78.521873 | -78.517874 |
| Maleic anhydride | -379.086863 | -379.080673 | -379.155839 | -379.149685 |
| Methanol | -115.629212 | -115.624922 | -115.651768 | -115.64749 |
| Phthalic anhydride | -532.63707 | -532.628329 | -532.732303 | -532.723658 |
| Succinic anhydride | -380.298147 | -380.291243 | -380.367586 | -380.360719 |
a hartrees (Eh). 1 Eh,=2625.46 kJ mol-1
Table X Theoretical enthalpy of formation in gas phase for 3-HPA and reference compounds at 298.15 K a b
| Compound | G3 | G4 | Exp. c |
|---|---|---|---|
|
|
|
|
|
| 3-HPA | -577.50 (0.00) | -570.43 (-7.07) | -577.50 d |
| Benzene | 85.33 (-2.91) | 84.74 (-2.32) | 82.42 |
| Methane | -75.93 (1.04) | -74.68 (-0.21)) | -74.89 |
| Ethane | -85.26(1.41) | -83.16 (-0.69) | -83.85 |
| Ethene | 51.67 (0.80) | 52.20 (0.27) | 52.47 |
| Maleic anhydride | -406.10 (5.69) | -402.09(1.68) | -400.41 |
| Methanol | -201.35 (-0.32) | -200.95 (-0.72) | -201.67 |
| Phthalic anhydride | 384.70(13.01) | -379.29 (7.60) | -371.69 |
| Succinic anhydride | -531.24 (3.34) | -526.18 (-1.72) | -527.90 |
a Values in kJ moL-1. b The values in parentheses are the differences between the experimental value and the calculated. c Values obtained from [58]. d Value determined in this work.
The atomization reaction (i) and the isodesmic reactions (from ii to v) for 3-HPA (C8H4O4) occupied in the present research are expressed below:
(i) C8H4O4= 8C(g)+4H(g)+4O(g)
(ii) 3-HPA + ethene + methane = benzene + maleic anhydride + methanol
(iii) 3-HPA + methane = methanol + phthalic anhydride
(iv) 3-HPA + ethane + methane = benzene + succinic anhydride + methanol
(v) 3-HPA + 8 methane = ethene + ethanol + dimethyl ether + acetone
Table XI shows theoretical enthalpies of formation in gas phase of 3-HPA at 298.15 K, evaluated from both atomization reaction and isodesmic reactions [57], more approximate to the experimental value determined at the G3 level, the values in parentheses are the differences between experimental and theoretical results, all values are in kJmol-1.
Table XI Comparison between experimental and calculated enthalpy of formation in gas phase at 298.15 K for the 3-HPA
| G3 | G4 | G3 | G4 | ||
|---|---|---|---|---|---|
| Atomization reaction | Isodesmic reaction | Exp. | |||
| -577.50 (0.00) | -570.43 (-7.07) | i | -576.88 (-0.62) | -571.85 (-5.65) | -577.50 |
| ii | -565.85 (-11.65) | -563.34 (-15.16) | |||
| iii | -579.84 (2.34) | -574.29 (-3.21) | |||
| iv | -577.59 (0.09) | -567.76 (-9.74) | |||
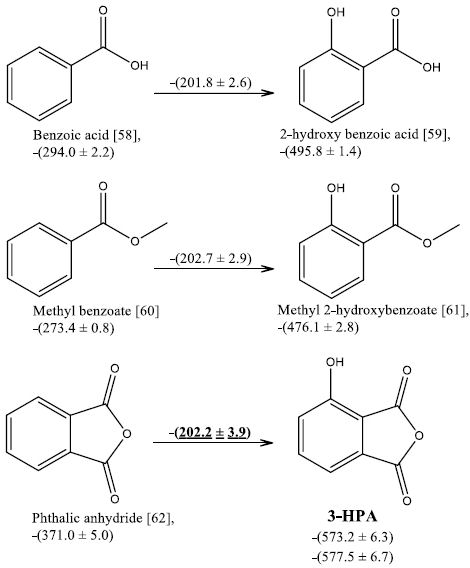
Finally, another option to estimate the molar enthalpy of formation in gas phase of 3-HPA was from the replacement of a proton with an OH group relative to phthalic anhydride. To this end it was necessary to calculate the contribution of this group taking into the enthalpic change from benzoic acid [58] to 2-hydroxy benzoic acid [59] and from methyl benzoate [60] to methyl 2-hydroxybenzoate [61], Figure 2. As can be seen, the average value of the contribution of the OH group of these two routes was —(202.2 ± 3.9) kJmol-1. Taking this value and the enthalpy of formation in gas phase at 298.15 K of phthalic anhydride [62], the estimate enthalpy of formation in gas phase at 298.15 K of 3-HPA was calculated, giving a value of
4 Conclusions
To conclude, thermochemical properties of 3-hydroxyphthalic anhydride, were obtained from differential scanning calorimetry, thermogravimetric analysis, and Knudsen effusion. The melting temperature was within the range reported by other authors. The enthalpy of sublimation determined by thermogravimetric data and Knudsen effusion were compared, getting a difference of 2.7 kJmol-1 and 0.6 kJmol-1, in sublimation and vaporization process. The theorical and estimate standard molar enthalpy of formation in gas phase of the 3-HPA showed excellent concordance regarding to the experimental value.

