


 text new page (beta)
 English (pdf)
 Article in xml format
 Article references
 Send this article by e-mail
 Cited by SciELO
  Similars in
SciELO
Similars in
SciELO 
 Permalink
PACS: 52.20.Fs; 52.25.Os
1. Introduction
Plasma is a partially ionized gas, where the electron temperature in the system has values lower than 10 eV with a density of ionized particles in the order of 109 particles/cm3. The species produced in the plasma can interact with each other, producing several species highly reactive in the plasma, with many technological applications 1, such as in semiconductor materials and materials technology (for example, thin film deposition and etching), new light sources, solar cells, water pollution, medical applications, and advanced chemical processes 2,3,4,5. Carbon dioxide (CO2) is the largest contributor to the greenhouse effect; small variations in the concentration of this gas in the atmosphere can cause adverse effects on the environment and the ecosystem. Therefore, researchers continue to try solving the problems that are caused due to the change in the concentration of CO2.
In literature, there are several types of studies that show different ways of plasma production to dissociate the molecule of CO2, which include dielectric barrier discharges, glow discharges, corona discharges, microwave discharges, RF discharges, and the use of mixtures with noble gases such as He and Ar 6. These noble gases are known to reduce the breakdown voltage in plasmas without changing their properties. For example, in Ar-CO2 plasma, the presence of Ar helps to sustain the Ar-CO2 discharge by providing electrons 7, and the energy changes by favoring vibrational processes in the CO2 molecule before the ionization and then the noble gas can be ionized. Because the Ar ionization potential is much lighter than that of CO2, the energy loss in the interaction process is reduced; thus, the impinging energy of the electrons increases.
CO2 is a major source of the greenhouse effect, and no systematic studies on the effect of the He and Ar addition on the CO2 conversion, including detailed attempts to explain the behavior based on the underlying mechanism, have been reported yet. In the present work, we investigate the effect of He and Ar addition on the CO2 conversion in a glow discharge over a broad concentration range of He and Ar in the mixture plasma. The decomposition products of CO2 were analyzed by OES and detailed electrical characterization of the plasma.
2. Experimental Setup
The system that is represented in Fig. 1, described in a previous work 8, comprises two circular electrodes of copper with diameters of 2.5 cm, in a vacuum chamber with a spacing of 20 mm between both electrodes. To evacuate background gases, the chamber (with a volume of 1.16 × 104cm3) was pumped down to a base pressure of 10-6 Torr (turbo-molecular pump Alcatel ATP80 and mechanical pump Varian DS302). Subsequently, the chamber was filled with a continuous dynamic flow of CO2, He, or Ar (ultra-pure gases, Infra 99.99%) through needle valves at the desired pressures. First, the CO2 gas was introduced in the chamber at a partial pressure, and then, the He (or Ar) gas was introduced in the system. The mixture was varied by changing the partial pressure of He (or Ar) and maintaining a total pressure of 1.5 Torr. Once the plasma was generated, the discharge current values were kept constant at 10 mA, independent of the mixture. The voltage (DC power supply Spellman SA4) was 300 V for 100 % of He, 500 V for 100 % of CO2 and 270 V for 100% of Ar.

The optical emission spectrum was measured using an Ocean Optics HR4000CG-UV-NIR spectrometer in the range of 200-1100 nm with a resolution of 0.75 nm FWHM. The signal was corrected by considering the spectral sensitivity of the spectrometer. The wavelength accuracy of the spectrometer was calibrated using an Ar source (Ocean Optics Inc.). Spectra data were obtained with a 10 s integration time. Spectral response of the CCD spectrometer was measured using a reference light source (deuterium lamp for UV, and Ocean Optics LS-1-CAL for visible and IR).
With the use of a double Langmuir probe, the electron temperature and ion density were determined. The voltage applied to the probe was provided by a programmable direct current power supply (GW INSTEK, PST-3202), with 1 volt steps, from -30 V to +30 V. The current generated from the collection of charges inside the plasma was measured by a Fluke multimeter. The current-voltage (I-V) curves were the result of an average of 15 data scans.
3. Results
3.1. Optical emission spectroscopy (OES)
3.1.1. CO2
The presence of the First Negative System (B2Σ-
X2Σ) for CO+, the Chamberlains
Airglow System (C3Δu -
a1 Δg) for
O2, the Swan System
(A3Πg -
X3Πu) for
C2, the Triplet Bands (d3Δ -
a3Π) for CO, and the FDB System
(A2Πu -
X2Πg) for
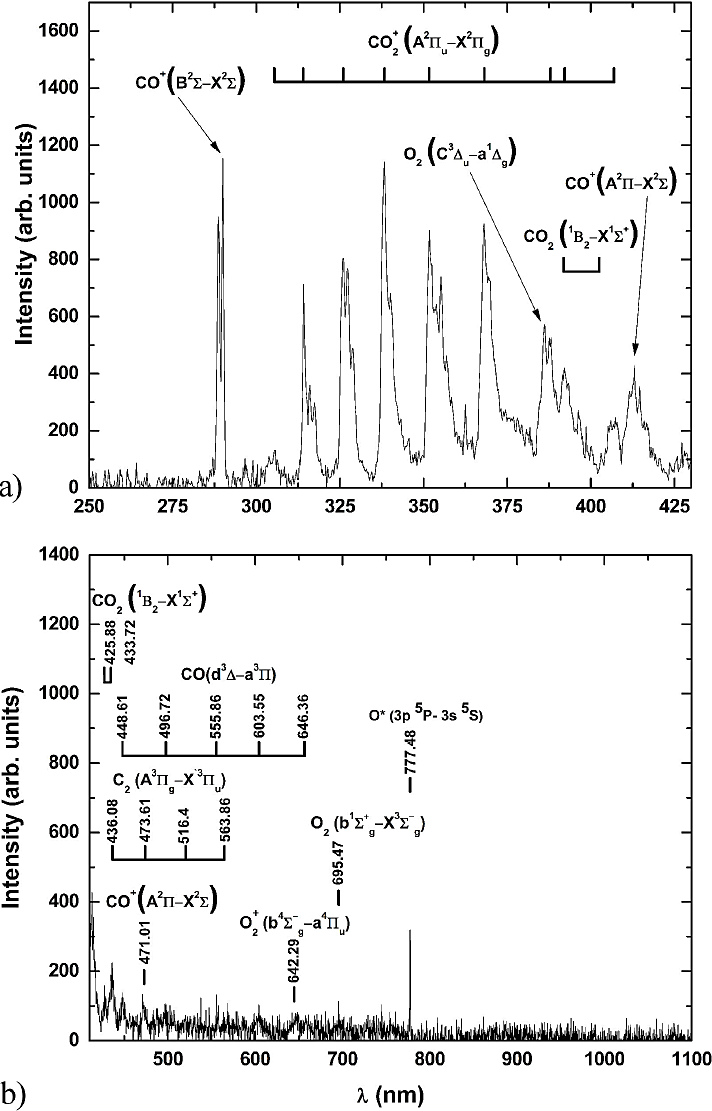
Figure 2 a) Optical emission spectrum of CO2 in the range of 250 to 425 nm. b) Optical emission spectrum of CO2 in the range of 425 to 1100 nm.
Table I Species present in the OES of CO2.
| Species | λ(nm) | Upper configuration | Lower configuration | υ' - υ" |
| CO+ | 289.98 | X2Σ | B2Σ | 6,10 |
|
|
305.66 | X2Πg | А2Пu | 6,2 |
|
|
314.16 | X2Πg | А2Пи | 3,0 |
|
|
326.09 | X2Πg | А2Пи | 3, 1a |
|
|
338.27 | X 2Πg | А 2П и | 2,0 |
|
|
351.75 | X2Πg | А2Пи | 1,1a |
|
|
368.11 | X2Πg | А2Пи | 1,2 |
| CO2 | 386.27 | a1 Δg | C3Δu | 5,3 |
|
|
387.53 | X2Πg | А2Пи | 2,4 |
| CO2 | 391.53 | 1B2 | X1 Σ+ | - |
|
|
392.05 | X 2Πg | А2Пи | 1,1 |
| CO2 | 403.08 | 1B2 | X1Σ+ | - |
|
|
407.28 | X2Πg | А2Пи | 1,4 |
| CO+ | 413.05 | X2Σ | А2П | 1,7 |
| CO2 | 425.88 | 1B2 | X1Σ+ | - |
| CO2 | 433.72 | 1B2 | X1 Σ+ | - |
| C2 | 436.08 | X3Пu | А2Пg | 4,2 |
| CO | 448.61 | а3П | d3Δ | 10,2 |
| CO+ | 471.01 | X2Σ | А2П | 2,1 |
| C2 | 473.61 | X3Пu | А3Пg | 1,0 |
| CO | 496.72 | а3П | d3Δ | 6,1 |
| C2 | 516.40 | X3Пu | А3Пg | 0,0 |
| CO | 555.86 | а3П | d3Δ | 4,1 |
| C2 | 563.86 | X3Пu | А3Пg | 0,1 |
| CO | 603.55 | а3П | d3Δ | 1,0 |
| 02+ | 642.29 | X4Пu |
|
0,1 |
| CO | 646.36 | а3П | d3Δ | 0,0 |
| CO2 | 695.47 |
|
|
2,1 |
| O* | 777.48 | 2s22p3(4S0)3p | 2s22p3(4S0)3s | - |
From the identified elements, it can be deduced that the main electronic processes in the plasma of CO2 are excitation (1) and ionization (2).
The dissociation processes in the molecule of CO2 generally follows two paths by electron impact 11.
Whether the pathway follows (3) or (4) depends on the vibrational excited state of CO2. It is also possible to observe the presence of the recombination process like carbon (5) and oxygen (6) molecules.
Once formed,
3.1.2. He
Figure 3 shows the spectrum observed in a He glow discharge. The main electronic process identified is He excitation, which is principally due to electron impact process (Eq. 10).
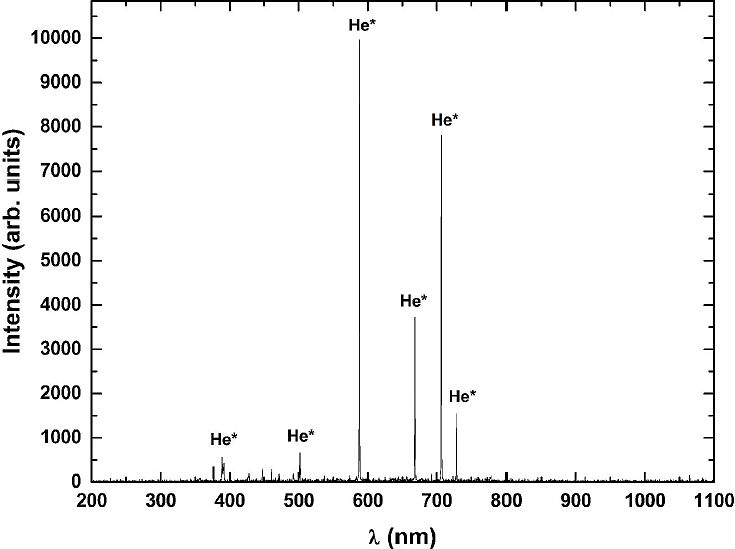
The energy required to remove the first electron of the He atom is 24.6 eV. The energy for ionization of the He atom is very large; therefore, it is easier to obtain excited levels 3s, 3p, 3d, and 4d because these processes involve less energy consumption.
The most intense emission lines of He are listed in Table II.
3.1.3. Mixture of CO2 - He
Figure 4 displays the optical emission spectrum of the CO2 -He [33.3% and 66.6%] mixture in two different ranges of wavelengths, from 200 to 500 nm (Fig. 4a) and from 500 to 1100 nm (Fig. 4b), to observe in detail the transition present in the spectra. It is possible to observe small widenings of molecular bands due to vibrational structures. However, when He is added to the CO2 gas, the effects diminish due to the presence of the following processes
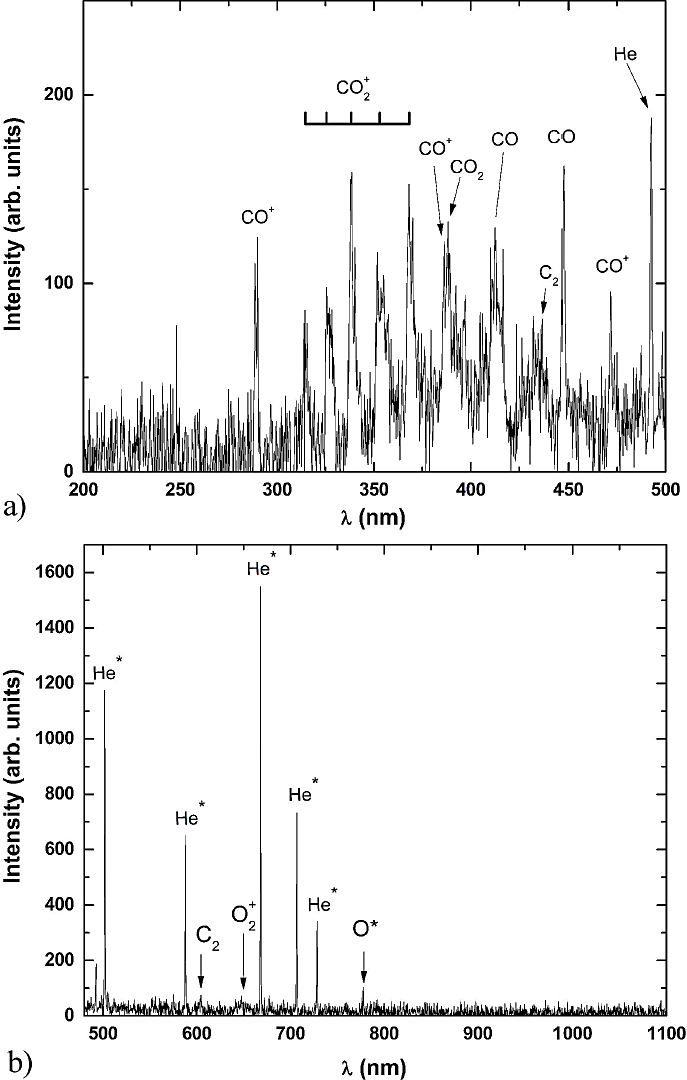
Figure 4 4a) in the range of 200 to 500 nm. 4b): in the range of 500 to 1100 nm. Optical emission spectrum of the mixture CO2- He [33.3% and 66.6%].
Figure 5(a) displays the OES of the CO2-He mixture plasma, as a function of He concentrations. It can be observed the presence of CO+,

3.1.4. Ar
The Ar emission lines are shown in Fig. 6, which shows that the principal process in the discharge is the atomic excitation by electron impact.

The process of excitation of Ar is described in (13), in which the electron that comes mainly from the plasma interacts with the Ar atom giving sufficient energy to increase its electron levels to 4s and 4p, which are identified with more intensity in OES (Table III).
Table III Species present in the OES of Ar.
| Species | À(nm) | Upper configuration | Lower configuration |
| Ar+ | 283.00 | 3s23p4(1D)4p | 3s23p4(3P)4s |
| Ar+ | 309.00 | 3s23p4(3P)4d | 3s23p4(3P)4p |
| Ar+ | 336.50 | 3s23p4(3P)4d | 3s23p4(3P)4p |
| Ar+ | 357.00 | 3s23p4(3P)4d | 3s23p4(3P)4p |
| Ar+ | 380.00 | 3s23p4(1D)4d | 3s23p4(3P)4p |
| Ar+ | 405.00 | 3s23p4(1S)4p | 3s23p4(1S)4s |
| Ar* | 416.00 | 3s23p5(2P3/2)5p | 3s23p5(2P3/2)4s |
| Ar* | 420.00 | 3s23p5(2P3/2)5p | 3s23p5(2P3/2)4s |
| Ar* | 427.00 | 3s23p5(2P3/2)5p | 3s23p5(2P3/2)4s |
| Ar+ | 434.50 | 3s23p4(3P)4p | 3s23p4(3P)4s |
| Ar+ | 443.50 | 3s23p4(3P)3d | 3s23p4(3P) |
| Ar+ | 461.00 | 3s23p4(1D)4p | 3s23p4(1D)4s |
| Ar+ | 476.50 | 3s23p4(3P)4p | 3s23p4(3P)4s |
| Ar+ | 488.00 | 3s23p4(3P)4p | 3s23p4(3P)4s |
| Ar* | 560.50 | 3s23p5(2P3/2)5d | 3s23p5(2P3/2)4p |
| Ar* | 603.50 | 3s23p5(2P3/2)5d | 33s23p5(2P3/2)4p |
| Ar+ | 656.50 | 3s23p4(3P2)4f | 3s23p4(1S)3d |
| Ar* | 675.50 | 3s23p5(2P3/2)4d | 3s23p5(2P3/2)4p |
| Ar* | 696.50 | 3s23p5(2P1/2)4p | 3s23p5(2P3/2)4s |
| Ar* | 706.50 | 3s23p5(2P1/2)4p | 3s23p5(2P3/2)4s |
| Ar* | 727.50 | 3s23p5(2P1/2)4p | 3s23p5(2P3/2)4s |
| Ar* | 738.00 | 3s23p5(2P1/2)4p | 3s23p5(2P3/2)4s |
| Ar* | 750.50 | 3s23p5(2P1/2)4p | 3s 23p5(2P1/2)4s |
| Ar* | 763.50 | 3s23p5(2P3/2)4p | 3s23p5(2P3/2)4s |
| Ar* | 772.00 | 3s23p5(2P3/2)4p | 3s23p5(2P3/2)4s |
| Ar* | 794.50 | 3s23p5(2P1/2)4p | 3s23p5(2P1/2)4s |
| Ar* | 801.00 | 3s23p5(2P3/2)4p | 3s23p5(2P3/2)4s |
| Ar* | 811.50 | 3s23p5(2P3/2)4p | 3s23p5(2P3/2)4s |
| Ar* | 826.00 | 3s23p5(2P1/2)4p | 3s23p5(2P3/2)4s |
| Ar* | 842.00 | 3s23p5(2P3/2)4p | 3s23p5(2P3/2)4s |
| Ar* | 852.00 | 3s23p5(2P1/2)4p | 3s23p5(2P1/2)4s |
| Ar* | 912.00 | 3s23p5(2P3/2)4p | 3s 23p5(2P3/2)4s |
| Ar* | 922.00 | 3s23p5(2P3/2)4p | 3s23p5(2P1/2)4s |
| Ar* | 965.50 | 3s23p5(2P3/2)4p | 3s23p5(2P3/2)4s |
3.1.5. Mixture CO2/Ar
For Ar, lines of Ar* are observed in the range of 700-850 nm, Fig. 7, as shown in Fig. 7b). By comparing the optical emission spectrum of CO2 with the spectra of the CO2-Ar mixtures, a marked decrease is observed in the intensity of the emission bands and
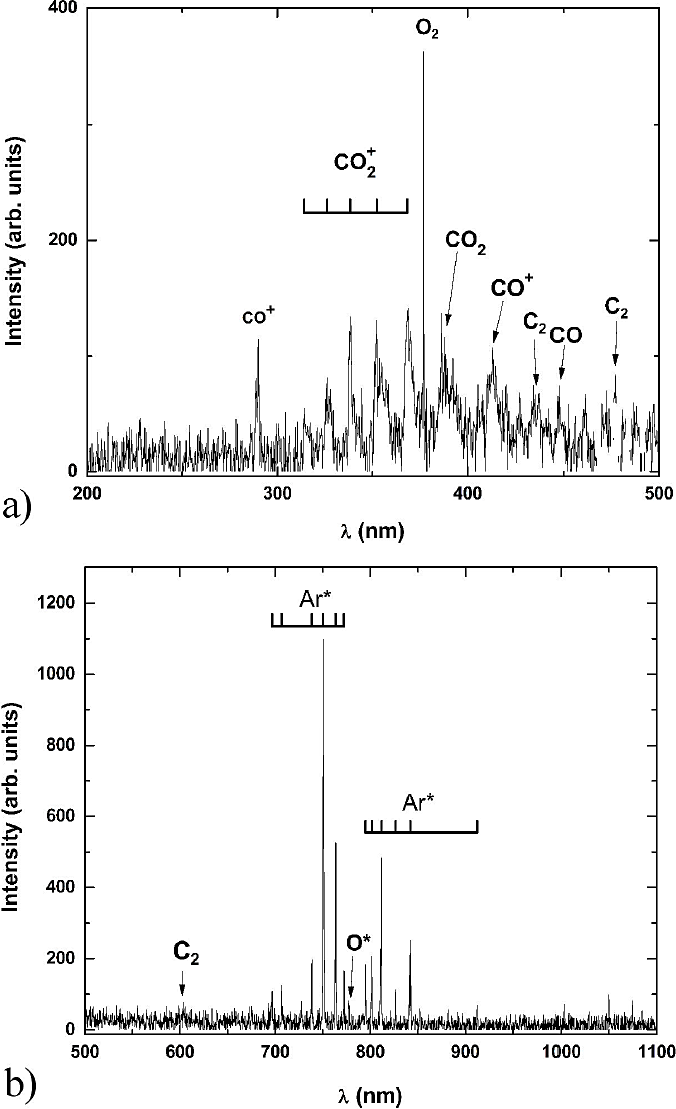
Figure 7 a). Optical emission spectrum of the mixture CO2/Ar [33.3%/66.6%] in the range of 200 to 500 nm; b). in the range of 500 to 1100 nm.
The presence of CO2 affects the system configuration, causing changes in the values of electron temperature and the density of ionized particles. When, the molecular gas is introduced into the system, the energy changes, thus favoring the vibrational processes and facilitating the process of Ar ionization 12.
As the CO2 concentration increases its percentage in the gas mixture, the intensity of the Ar emission lines in the spectra changes, suggesting that the amount of particles of excited Ar also changes. The identified lines for Ar* in the mixture were 696.50, 706.50, 727.50 738.00, 750.50, 763.50, 772.00, 794.50, 801.00, 811.50, 826.00, 842.00 and 912.00 nm. The identification of excited Ar lines is consistent with the amount of energy in the system because it is cold plasma, having at most the interaction process described in Eqs. 14 and 15.
Figure 8a) shows the OES of
CO2-Ar mixture plasma, as a function of the Ar percentage.
Figure 8(a) shows the presence of
C+,
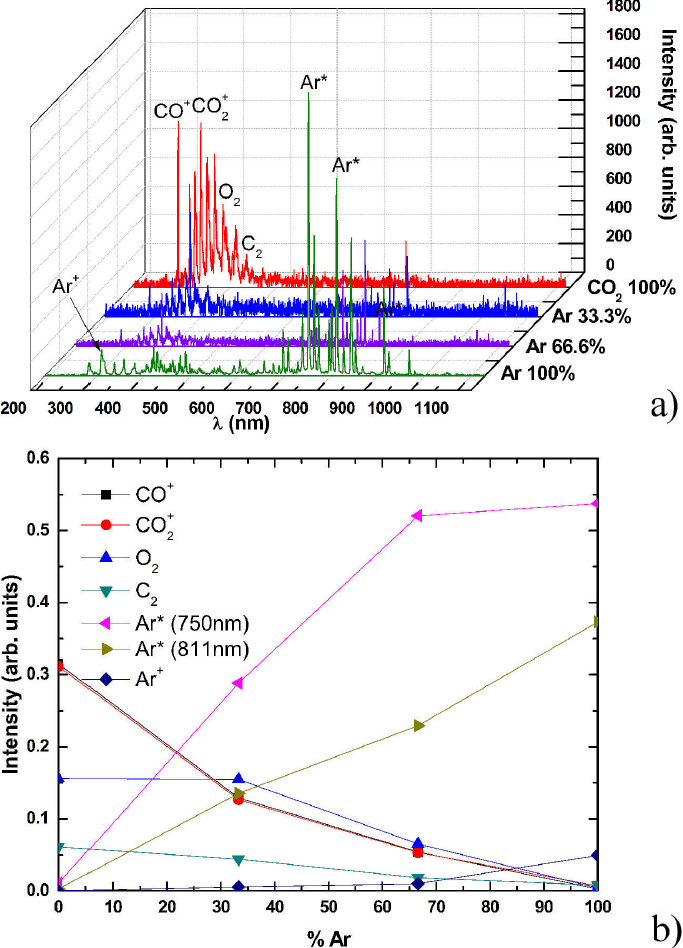
Figure 8 a): OES of CO2-Ar at different concentrations; b): Normalized intensity as a function of Ar concentration.
The energy in the system is favorable to have the presence of the process of dissociation of the molecule of CO2, mainly due to electronic processes through electron impact. The intensity ratio of CO-CO2 mixtures plasma (Fig. 9) shows that the dissociative effect for electron impact increases with the presence of some noble gases being more efficient for He in this work, however the ratios between the intensities belonging to the molecular O2 and CO2, Fig. 10, remain close, which means that the O2 production rate are constant, independently of the noble gas used in the mixture plasma. Secondly, due to values ratios for O2 being greater than O2 compared with those of CO2, it is evident that the O2 production is more efficient for both gas, i.e. Ar and He. Thus the path dissociation established in the Eq. 4 is favored in both cases, the dissociation process is more important than the excitation.


3.2. Electrical characterization
3.2.1. Double Langmuir probe, electron temperature, and ion density
Figure 11 shows the I-V characteristic curve of the 33.3% CO2-66.6% He mixture plasma, obtained by the double Langmuir probe, along with the corresponding theoretical curve (solid curve). The evaluation of electron temperature (Te) and ion density (ni) runs in the following way; first, the probe characteristic curve is differentiated two times. The electron temperature is calculated through the position of the extrema of the characteristic curve’s second derivative 13. Then a theoretical curve is fitted to the entire measured experimental I-V characteristic curve by adjusting only the ion density. This evaluation procedure gave an electron temperature of Te and an ion density of ni, at each mixture plasma used in this work.

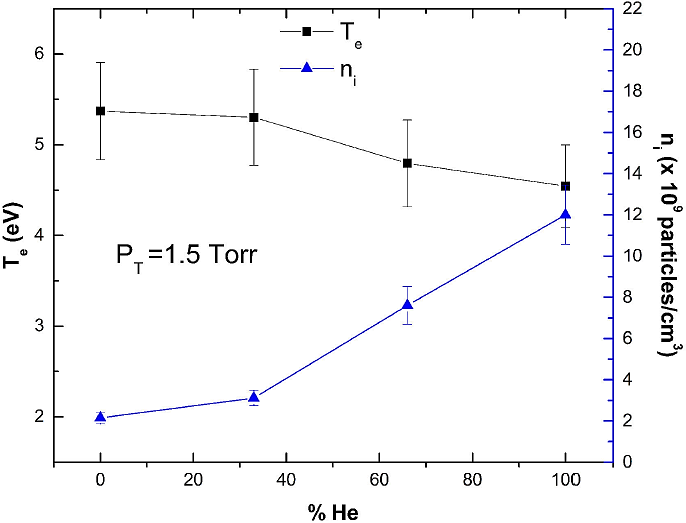
The electronic temperature (Te) of the mixture is in the range of 4.54 to 5.37 eV, and the ion density (ni) has values between 2.15 × 10⁹ and 12.00 × 10⁹ particles/cm3. The behavior of the aforementioned values is shown in Fig. 12, for different He concentrations. In this work, from ten measurements, the overall variation in the electron temperature and the ion density were found to be 10%.
Performing a similar procedure to obtain the electrical characterization make for before Ar and CO2-Ar plasmas. In Fig. 13 characteristic (I-V) double Langmuir curve is shows. The electron temperature (Te) values are in the range of 2.07 to 5.37 eV, and the ion density (Te) values are between 1.87 × 10¹⁰ and 2.15 × 10⁹ particles/cm3 (Fig. 14). With the addition of Ar gas in the plasma, there is an increase in electron density, which leads to a high electron-electron collision frequency and always tends to deplete electrons. Thus, a decrease in the electronic temperature is caused.
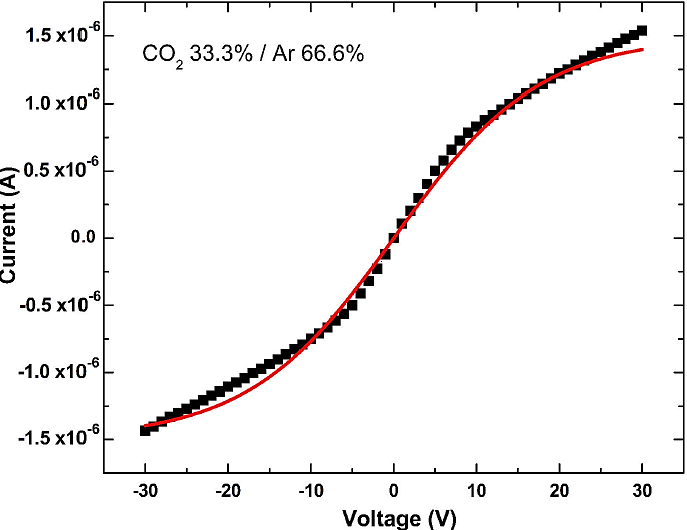
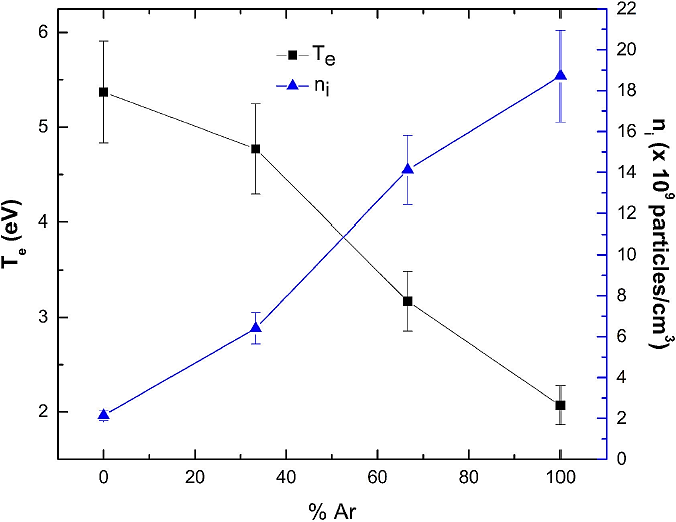
Figure 15 shows the observed behavior of the variables obtained by the electric Langmuir probe, electron temperature, and ion density, as a function of the percentage of molecular gas CO2 present in the mixture.

Figure 15 also shows the behavior of the electron temperature and ion density as a function of the percentage of CO2 in the mixture for both Ar-CO2 and He-CO2 mixtures plasma. Both behaviors are similar, the electron temperature decreases, while the ion density increases as the concentration of the noble gas increases. Besides, we can observe that with the addition of Ar, the ion density and electron temperature increased more as compared to when He was added.
The values of Te and ni in the mixture are present in Table IV.
4. Conclusions
A detailed OES and electrical characterization of glow discharges operating in CO2, and CO2-He and CO2-Ar mixtures to investigate the CO2 decomposition were performed. When, CO2 gas is mixed with a noble gas (Ar or He), the average kinetic energy of electrons decreases, while the amount of ionized particles increases. This effect can be explained by the fact that the concentration of a noble gas in the mixture increases, as the electron collisional frequency decreases, causing the electrons to be in the presence of an electric field longer, which accelerates them.
According to the analysis of the normalization intensities and, CO-CO2 and O2-CO2 ratios obtained by an OES, the intensity of the decomposition products of CO2 in the mixture of CO2-He is greater than CO2-Ar mixture at the same concentrations. This is consistent with the studies of these mixtures conducted with different experimental techniques to produce the plasma. CO2 could be efficiently decomposed by glow discharge of CO2-He and CO2-Ar mixtures. He gas was found to be more effective for the preferential decomposition of CO2 of CO + O at a 33% Ar/66% CO2 mixture.
The electron temperature was found to be in the range of 2.07 to 5.37 eV, and the ion density was between 2.15 × 10⁹ and 18.70 × 10⁹ particles/cm3. The species identified were

