


 nueva página del texto (beta)
 Inglés (pdf)
 Artículo en XML
 Referencias del artículo
 Enviar artículo por email
 Citado por SciELO
  Similares en
SciELO
Similares en
SciELO 
 Permalink
The technique (VaR) is a statistical measure of the risk. It is associated with financial risks related to the high volatility in prices, interest rates, or exchange rates. It is used massively by entities because of the necessity to measure risk in constantly traded portfolios.
The (VaR) is based on the principles of Portfolio Theory. With this, the risk resulting from the market position is managed and valued. This theory supports that a portfolio is efficient when it maximizes its return for a certain level of risk or minimizes its risk for a certain level of return. The (VaR) measures the relationship between profitability and risk to obtain an efficient portfolio. It takes up the concepts introduced by Markowitz ( 1959 ) and Sharpe ( 1964 ) and applies them in a standardized and statistically normalized context, with constantly updated databases.
Probability. The (VaR) of a portfolio is defined as the amount of money lost that does not exceed if the current portfolio is held for a certain period (market days instead of calendar days) with a specified probability. The level of significance or uncertainty in the benefits caused by changes in market conditions depends on the risk aversion of the investor, the more aversion, the lower the level of significance chosen.
Horizon. The risk horizon is the period over which the potential loss is measured. Depending on the liquidity, the different risks are valued over different periods, the more liquidity, the shorter the time over which the (VaR) is valued. In essence, the (VaR) of a portfolio is the minimum expected loss for a certain time horizon and confidence level, measured in a specific reference currency ( Blanco & Garman, 1998) .
For a single or simple position, risk is determined by position size and price volatility.
RISK = POSITION SIZE X VOLATILITY X PRICE
The (VaR) is calculated for a single financial product or all financial products in the portfolio. For example, if we have two highly correlated financial products (if one rises, the other tends to rise as well), the joint risk of the two securities may be greater than the sum of the individual risks. Lower correlations between financial products (the normal case) make the (VaR) of a portfolio less than the sum of the VaRs of the individual positions, this as an effect of diversification.
Methods for calculating the VAR. It is important to note that the (VaR) is valid under normal market conditions. If the market is in crisis, then the expected loss of a financial asset is calculated through other methods. Some of these alternative methods is the stress test or extreme values.
Financial losses are the result of statistics and the models and parameters used for their calculation, therefore, there are several ways to calculate (VaR), highlighting three of them:
a) Monte Carlo Simulation Method. Estimate the (VaR) by generating thousands of possible outcomes based on the initial data entered.
b) Historical Simulation Method. Calculate the (VaR) through the historical price data of each financial asset.
c) Analytical / Parametric Method. Delta - Gamma. Estimate the (VaR) using estimated profitability data.
In all cases, it is necessary to estimate the profitability distribution of a portfolio in two components:
Estimating the joint probability distribution for various risk factors affecting a portfolio. These factors can include many interest rates, share prices, or exchange rates, assuming the risk factors have had distributed as a normal one, with volatilities and correlations based on recent market behavior.
Determining a probability distribution for portfolio return based on the previously constructed joint distribution and the portfolio's sensitivity to each risk factor. The sensitivity will depend on its current composition, and thus the estimated (VaR) reflects the portfolio's current exposure to risk. The (VaR) analysis can be systematized, although it is necessary to have a database of volatilities and estimated correlations for all risk factors that may affect the portfolio.
Condition for the selection of the Value at Risk method. The method assumes a normal distribution for the price of all financial products. Use the modified duration to relate the change in price to the movement of interest rates. It establishes a confidence interval given the maximum variations in the price of a portfolio that it is willing to support. They must also consider the existing correlations between the elements of the portfolio. The method is valid to carry out measures and control risks under normal conditions of financial markets and is applicable to products traded in liquid and transparent markets. The methodology assumes parallel movements in the interest rate curve, not allowing to simulate other movements.
Methodology (VaR) weaknesses. One flaw is that it only measures future risk in one direction. This sense can be one of the following two:
a) Since the joint distribution of risk factors is based on the recent behavior of these factors in the market, the analysis does not consider sudden behaviors until they have taken place. For this reason, VaR analysis is replaced by other methods, such as Stress Testing.
b) Since the analysis is based on the current structure of the portfolio, it measures the future risk of the portfolio according to the current composition.
The Risk Metrics of J.P. Morgan. It approximates (VaR) based on volatility and correlation, which implies several historical prices, price volatilities, and correlative data for all types of transactions.
The RiskMetrics model emerged in 1989. The owner of J.P. Morgan, Dennis Weatherstone, asked for a report that would measure in detail the financial risk of his company. In 1992, after an exhaustive study, the company published the RiskMetrics methodology ( Padula & Bacchini, 2014 ).
Essentially, the method uses price/series fluctuations for all financial products. It includes, for example, exchange rates for two currencies, yield curves for Treasuries in USD, or equity prices depending on the most important indices.
A comprehensive risk management and control system encompasses risk measurement and includes the establishment of policies, procedures, guidelines, and controls. All financial entities must consider risk management in their organization charts and promote commitment to this process by senior management.
The (VaR) is a commonly accepted report as a measure of market risk, allowing the setting of limits and the establishment of comparisons between strategic business units, also, it favors the evaluation of the degree of execution of each branch of activity on an adjusted basis to risk, at the same time that it becomes a crucial measure for the determination of own capital requirements, providing a complete report on market risk, without becoming a comprehensive risk management and control system.
Currently, there is no optimal methodology for estimating (VaR). All have advantages and disadvantages. In practice, many entities use more than one model to measure financial risk. They are clear that all applied analytical approaches and processes provide a useful view of market risk.
Financial indicators are useful performance measures for charting long-term financial direction, proposing clear strategies, and taking appropriate actions.
Next, the evolution of some economic and financial indicators of the Mexican environment is described and provided to facilitate decision-making related to personal and company strategies in a comprehensive manner.
National Consumer Price Index (INPC, Spanish)
The Price and Quotation Index of the Mexican Stock Exchange (IPC, Spanish)
Exchange rate
Equilibrium interbank interest rate (TIIE, Spanish)
CETES rate of return
Investment units (UDIS, Spanish)
1. NATIONAL CONSUMER PRICE INDEX (INPC)
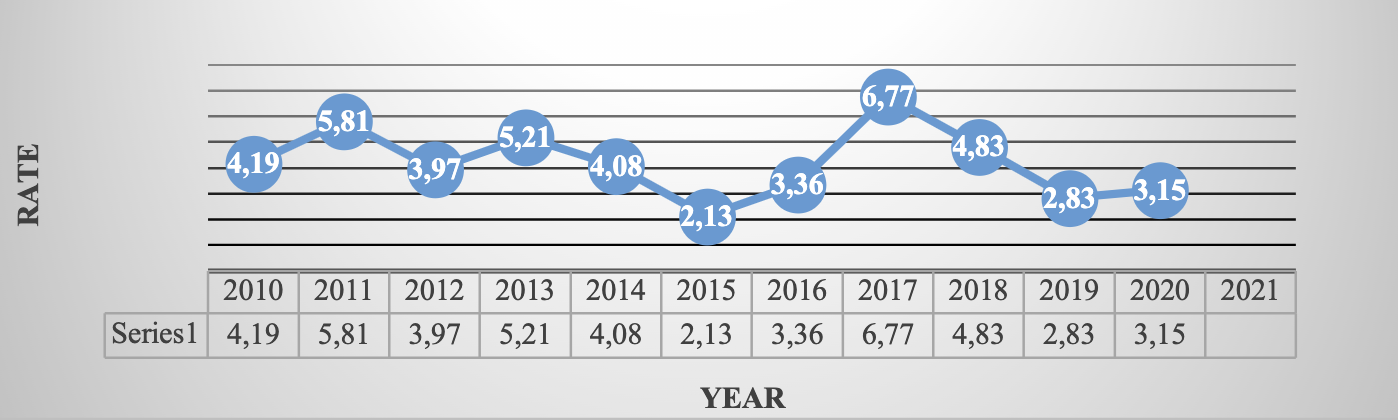
Born in 1995 and reflecting changes in consumer prices, measures the general increase in prices in the country. It is calculated fortnightly by the Bank of Mexico and INEGI (2021). INPC is published in the Official Gazette of the Federation on the 10th and 25th of each month. The reference period is the second half of December 2010.
Table 1 Accumulated inflation in the year Base 2nd Fortnight of December 2010 100 with data provided by Banco de México
| Period | 2010 | 2011 | 2012 | 2013 | 2014 | 2015 | 2016 | 2017 | 2018 | 2019 | 2020 | 2021 |
| January | 1.48 | 0.77 | 0.98 | 0.79 | 0.90 | -0.09 | 0.38 | 1.70 | 0.53 | 0.09 | 0.48 | 0.86 |
| February | 2.15 | 1.42 | 1.47 | 1.46 | 1.15 | 0.09 | 0.82 | 2.29 | 0.91 | 0.06 | 0.90 | 1.50 |
| March | 2.52 | 1.84 | 1.55 | 1.99 | 1.43 | 0.51 | 0.97 | 2.92 | 1.24 | 0.44 | 0.85 | 2.34 |
| April | 1.98 | 0.72 | 0.69 | 1.81 | 1.24 | 0.25 | 0.65 | 3.04 | 0.90 | 0.50 | -0.17 | 2.67 |
| May | 0.60 | -0.70 | -0.65 | 0.95 | 0.91 | -0.26 | 0.20 | 2.92 | 0.73 | 0.21 | 0.22 | 2.88 |
| June | 0.49 | -0.41 | -0.41 | 1.12 | 1.09 | -0.09 | 0.31 | 3.18 | 1.12 | 0.27 | 0.76 | 3.43 |
| July | 0.56 | -0.04 | 0.32 | 1.14 | 1.42 | 0.06 | 0.57 | 3.57 | 1.66 | 0.65 | 1.43 | 4.04 |
| August | 0.91 | 0.30 | 0.92 | 1.31 | 1.73 | 0.27 | 0.86 | 4.08 | 2.26 | 0.63 | 1.82 | 4-24 |
| September | 1.27 | 0.73 | 1.12 | 1.61 | 2.18 | 0.27 | 1.47 | 4.41 | 2.69 | 0.89 | 2.06 | 4.88 |
| October | 2.35 | 2.33 | 2.12 | 2.77 | 2.74 | 1.16 | 2.09 | 5.06 | 3.22 | 1.44 | 2.68 | 5.76 |
| November | 3.89 | 4.87 | 3.86 | 4.57 | 3.57 | 1.71 | 2.89 | 6.15 | 4.10 | 2.26 | 2.76 | 6.97 |
| December | 4.19 | 5.81 | 3.97 | 5.21 | 4.08 | 2.13 | 3.36 | 6.77 | 4.83 | 2.83 | 3.15 |
Route: Financiero y bursátil > Indicadores financieros y bursátiles > Índice de precios y cotizaciones de la Bolsa Mexicana de Valores > Último índice del mes
Source: Own elaboration ( INEGI, 2021 )
Source: Own elaboration ( INEGI, 2021 ). Route: Financiero y bursátil > Indicadores financieros y bursátiles > Rates de interés bancarias > Equilibrium interbank interest rate (TIIE)(TIIE) >A 28 días (al cierre del mes)
Graph 1. Inflation in Mexico (2010-2020 accumulated at the end of the year)
Source: Own elaboration ( INEGI, 2021) . Route: Precios e Inflation > National Consumer Price Index>Mensual > Índice > Índice general y por objeto del gasto > Índice general
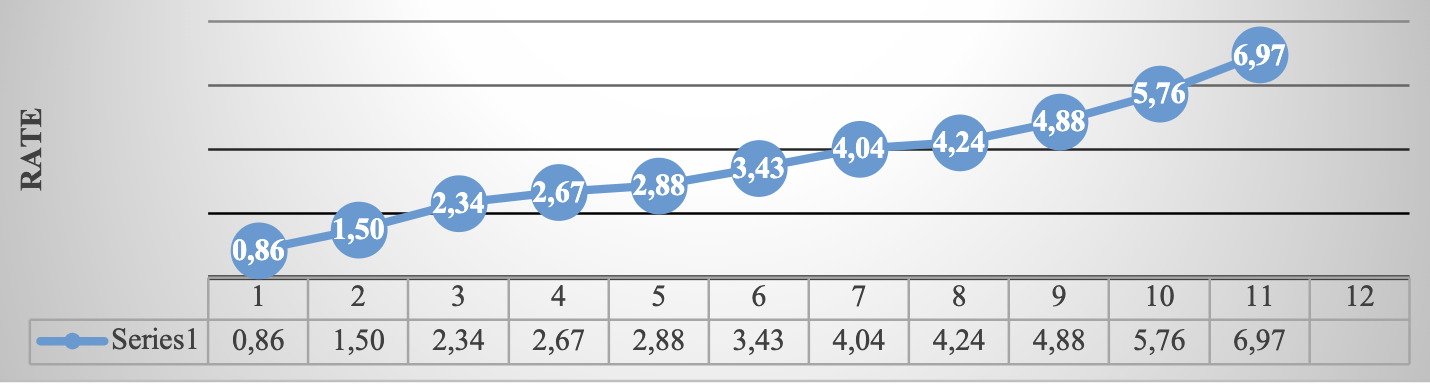
Graph 2 Inflation in Mexico (accumulated January-November 2021)
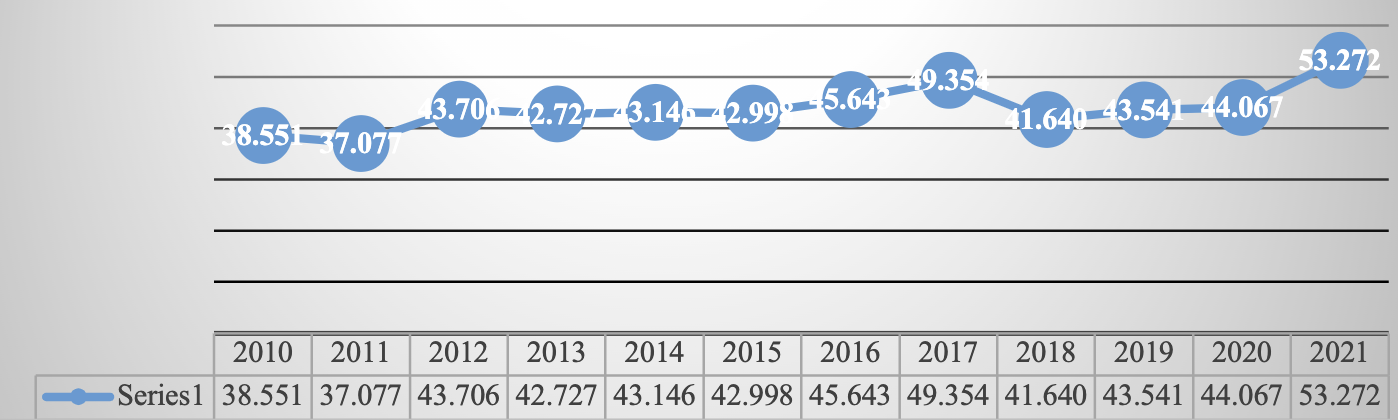
2. THE PRICE AND QUOTATION INDEX OF THE MEXICAN STOCK EXCHANGE (IPC)
Represents the change in the values traded on the Mexican Stock Exchange concerning the previous day to determine the percentage of rising or fall of the most representative shares of the companies listed therein.
Table 2 The Price and Quotation Index of the Mexican Stock Exchange Base October 1978 078100
| Period | 2010 | 2011 | 2012 | 2013 | 2014 | 2015 | 2016 | 2017 | 2018 | 2019 | 2020 | 2021 |
| January | 30,392 | 36,982 | 37,422 | 45,278 | 40,879 | 40,951 | 43,631 | 47,001 | 50,456 | 43,988 | 44,862 | 42,986 |
| February | 31,635 | 37,020 | 37,816 | 44,121 | 38,783 | 44,190 | 43,715 | 46,857 | 47,438 | 42,824 | 41,324 | 44,593 |
| March | 33,266 | 37,441 | 39,521 | 44,077 | 40,462 | 43,725 | 45,881 | 48,542 | 46,125 | 43,281 | 34,554 | 47,246 |
| April | 32,687 | 36,963 | 39,461 | 42,263 | 40,712 | 44,582 | 45,785 | 49,261 | 48,354 | 44,597 | 36,470 | 48,010 |
| May | 32,039 | 35,833 | 37,872 | 41,588 | 41,363 | 44,704 | 45,459 | 48,788 | 44,663 | 42,749 | 36,122 | 50,886 |
| June | 31,157 | 36,558 | 40,199 | 40,623 | 42,737 | 45,054 | 45,966 | 49,857 | 47,663 | 43,161 | 37,716 | 50,290 |
| July | 32,309 | 35,999 | 40,704 | 40,838 | 43,818 | 44,753 | 46,661 | 51,012 | 49,698 | 40,863 | 37,020 | 50,868 |
| August | 31,680 | 35,721 | 39,422 | 39,492 | 45,628 | 43,722 | 47,541 | 51,210 | 49,548 | 42,623 | 36,841 | 53,305 |
| Sep. | 33,330 | 33,503 | 40,867 | 40,185 | 44,986 | 42,633 | 47,246 | 50,346 | 49,504 | 43,011 | 37,459 | 51,386 |
| Oct. | 35,568 | 36,160 | 41,620 | 41,039 | 45,028 | 44,543 | 48,009 | 48,626 | 43,943 | 43,337 | 36,988 | 51,310 |
| Nov. | 36,817 | 36,829 | 41,834 | 42,499 | 44,190 | 43,419 | 45,286 | 47,092 | 41,733 | 42,820 | 41,779 | 49,699 |
| Dec. | 38,551 | 37,077 | 43,706 | 42,727 | 43,146 | 42,998 | 45,643 | 49,354 | 41,640 | 43,541 | 44,067 | 53,272 |
Route: Financiero y bursátil > Indicadores financieros y bursátiles > Índice de precios y cotizaciones de la Bolsa Mexicana de Valores > Último índice del mes
Source: Own elaboration ( INEGI, 2021)
Source: Own elaboration ( INEGI, 2021 ). Route: Financiero y bursátil > Indicadores financieros y bursátiles > Índice de precios y cotizaciones de la Bolsa Mexicana de Valores > Último índice del mes
Graph 3 The Price and Quotation Index of the Mexican Stock Exchange, 2010 - 2021 (Score at the end of each year)
Source: Own elaboration ( INEGI, 2021 ). Route: Financiero y bursátil > Indicadores financieros y bursátiles > Índice de precios y cotizaciones de la Bolsa Mexicana de Valores > Último índice del mes
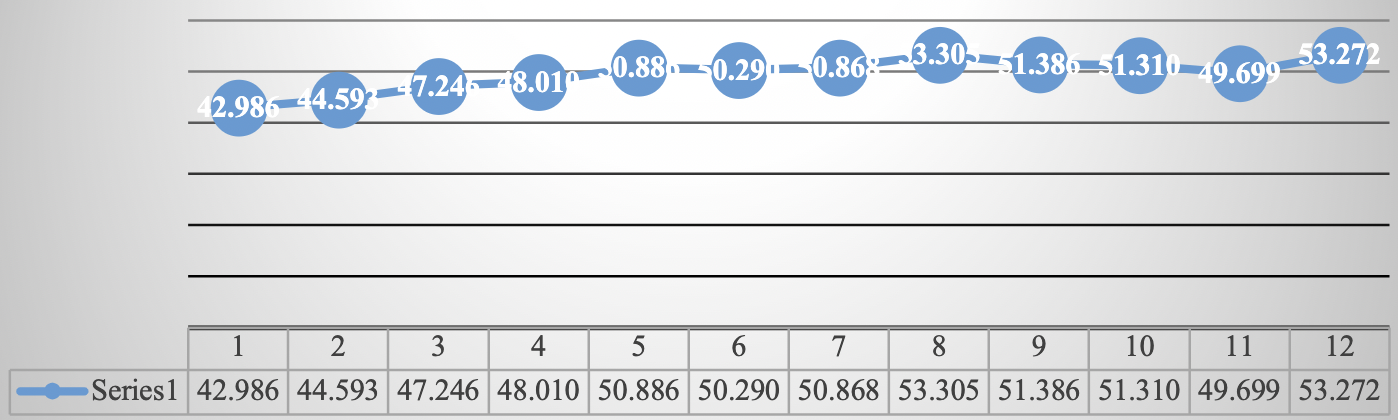
Graph 4 The Price and Quotation Index of the Mexican Stock Exchange, January-December 2021 (Score at the end of each month)
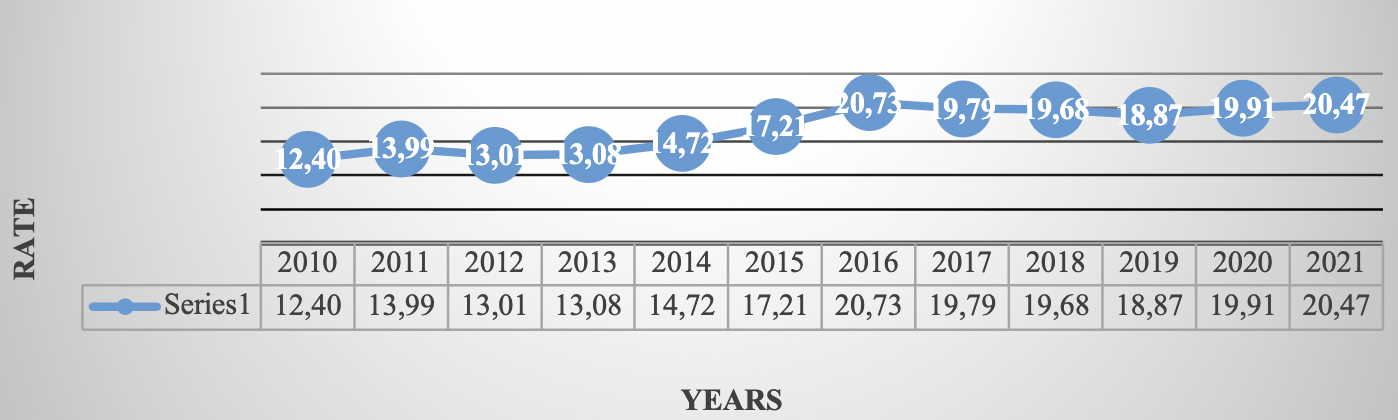
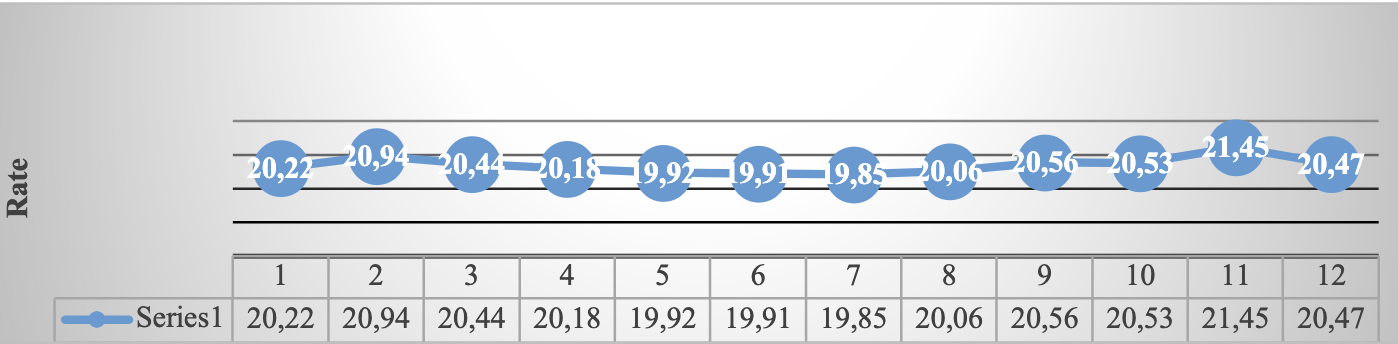
3. EXCHANGE RATE
Es el valor del peso mexicano con respecto al dólar calculado con el Promedio diario de los cinco bancos más importantes del país, que refleja el precio spot (de contado), negociado entre bancos. Está altamente relacionado con la Inflation, la rate de interés, y la Bolsa Mexicana de Valores.
Table 3 Exchange rate National currency per US dollar parity at the end of each period
| Period | 2010 | 2011 | 2012 | 2013 | 2014 | 2015 | 2016 | 2017 | 2018 | 2019 | 2020 | 2021 |
| January | 12.81 | 12.02 | 12.95 | 12.71 | 13.37 | 14.69 | 18.45 | 21.02 | 18.62 | 19.04 | 18.91 | 20.22 |
| February | 12.96 | 12.17 | 12.87 | 12.87 | 13.30 | 14.92 | 18.17 | 19.83 | 18.65 | 19.26 | 19.78 | 20.94 |
| March | 12.61 | 11.97 | 12.80 | 12.36 | 13.08 | 15.15 | 17.40 | 18.81 | 18.33 | 19.38 | 23.48 | 20.44 |
| April | 12.24 | 11.59 | 13.20 | 12.16 | 13.14 | 15.22 | 19.40 | 19.11 | 18.86 | 19.01 | 23.93 | 20.18 |
| May | 12.68 | 11.63 | 13.91 | 12.63 | 12.87 | 15.36 | 18.45 | 18.51 | 19.75 | 19.64 | 22.18 | 19.92 |
| June | 12.72 | 11.84 | 13.66 | 13.19 | 13.03 | 15.57 | 18.91 | 17.90 | 20.06 | 19.21 | 23.09 | 19.91 |
| July | 12.83 | 11.65 | 13.28 | 12.73 | 13.06 | 16.21 | 18.86 | 17.69 | 18.55 | 19.99 | 22.20 | 19.85 |
| August | 12.73 | 12.41 | 13.27 | 13.25 | 13.08 | 16.89 | 18.58 | 17.88 | 19.07 | 20.07 | 21.89 | 20.06 |
| September | 12.86 | 13.42 | 12.92 | 13.01 | 13.45 | 17.01 | 19.50 | 18.13 | 18.90 | 19.68 | 22.14 | 20.56 |
| October | 12.45 | 13.20 | 13.09 | 12.89 | 13.42 | 16.45 | 18.84 | 19.15 | 19.80 | 19.16 | 21.25 | 20.53 |
| November | 12.33 | 14.03 | 13.04 | 13.09 | 13.72 | 16.55 | 20.55 | 18.58 | 20.41 | 19.61 | 20.14 | 21.45 |
| December | 12.40 | 13.99 | 13.01 | 13.08 | 14.72 | 17.21 | 20.73 | 19.79 | 19.68 | 18.87 | 19.91 | 20.47 |
NOTE: Exchange rate FIX by The Banco de México, used for settle obligations denominated in foreign currency. Quote at the endRoute: Financiero y bursátil > Indicadores financieros y bursátiles > Cotización del dólar en el mercado cambiario nacional > Exchange rate para solventar obligaciones en moneda extranjera > Cotizaciones al cierre del mes. Venta
Source: Own elaboration ( INEGI, 2021) .
Source: Own elaboration ( INEGI, 2021 ). Route: Financiero y bursátil > Indicadores financieros y bursátiles > Cotización del dólar en el mercado cambiario nacional > Exchange rate para solventar obligaciones en moneda extranjera > Cotizaciones al cierre del mes. Venta
Graph 5 Exchange rate (National currency per US dollar, 2010-2021, FIX parity at the end of each year)
Source: Own elaboration ( INEGI, 2021) . Route: Financiero y bursátil > Indicadores financieros y bursátiles > Cotización del dólar en el mercado cambiario nacional > Exchange rate para solventar obligaciones en moneda extranjera > Cotizaciones al cierre del mes. Venta
Graph 6 Exchange rate (National currency per US dollar, January-December, FIX parity at the end of each month)
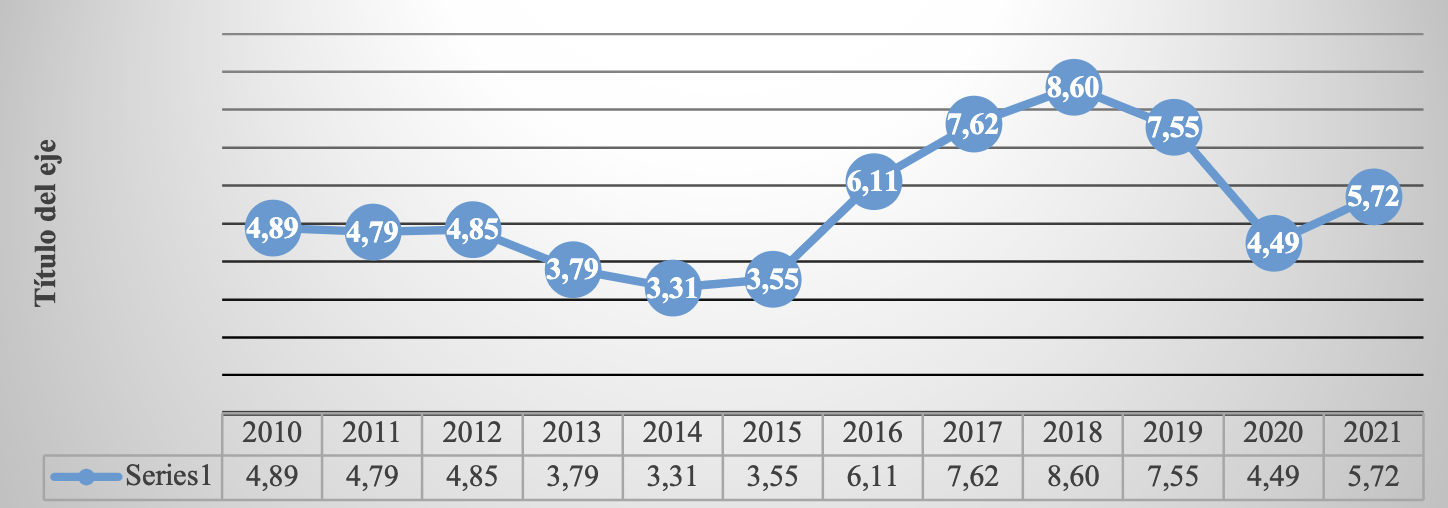
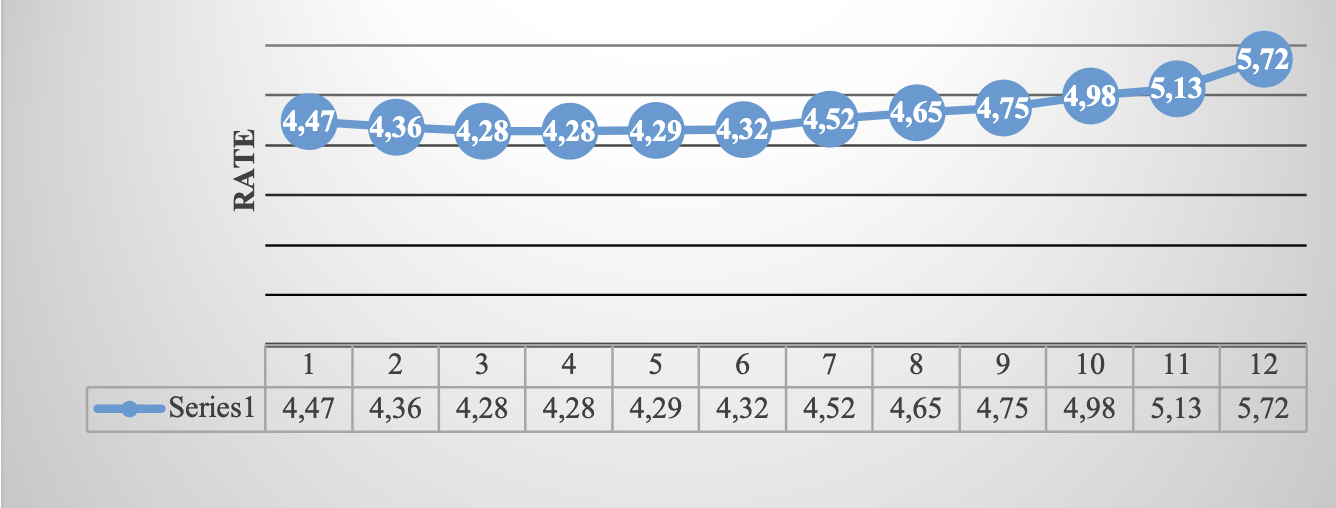
4. EQUILIBRIUM INTERBANK INTEREST RATE (TIIE).
On March 23, 1995, the Bank of Mexico, to establish an interbank interest rate that better reflects market conditions, released the Interbank Equilibrium Interest Rate through the Official Gazette of the Federation.
Table 4 Equilibrium interbank interest rate 28day quote
| Period | 2010 | 2011 | 2012 | 2013 | 2014 | 2015 | 2016 | 2017 | 2018 | 2019 | 2020 | 2021 |
| January | 4.91 | 4.86 | 4.79 | 4.84 | 3.78 | 3.29 | 3.56 | 6.15 | 7.66 | 8.59 | 7.50 | 4.47 |
| February | 4.92 | 4.84 | 4.78 | 4.80 | 3.79 | 3.29 | 4.05 | 6.61 | 7.83 | 8.54 | 7.29 | 4.36 |
| March | 4.92 | 4.84 | 4.77 | 4.35 | 3.81 | 3.30 | 4.07 | 6.68 | 7.85 | 8.51 | 6.74 | 4.28 |
| April | 4.94 | 4.85 | 4.75 | 4.33 | 3.80 | 3.30 | 4.07 | 6.89 | 7.85 | 8.50 | 6.25 | 4.28 |
| May | 4.94 | 4.85 | 4.76 | 4.30 | 3.79 | 3.30 | 4.10 | 7.15 | 7.86 | 8.51 | 5.74 | 4.29 |
| June | 4.94 | 4.85 | 4.77 | 4.31 | 3.31 | 3.30 | 4.11 | 7.36 | 8.10 | 8.49 | 5.28 | 4.32 |
| July | 4.92 | 4.82 | 4.78 | 4.32 | 3.31 | 3.31 | 4.59 | 7.38 | 8.11 | 8.47 | 5.19 | 4.52 |
| August | 4.90 | 4.81 | 4.79 | 4.30 | 3.30 | 3.33 | 4.60 | 7.38 | 8.10 | 8.26 | 4.76 | 4.65 |
| September | 4.90 | 4.78 | 4.81 | 4.03 | 3.29 | 3.33 | 4.67 | 7.38 | 8.12 | 8.04 | 4.55 | 4.75 |
| October | 4.87 | 4.79 | 4.83 | 3.78 | 3.28 | 3.30 | 5.11 | 7.38 | 8.15 | 7.97 | 4.51 | 4.98 |
| November | 4.87 | 4.80 | 4.85 | 3.80 | 3.31 | 3.32 | 5.57 | 7.39 | 8.34 | 7.78 | 4.48 | 5.13 |
| December | 4.89 | 4.79 | 4.85 | 3.79 | 3.31 | 3.55 | 6.11 | 7.62 | 8.60 | 7.55 | 4.49 | 5.72 |
Route: Financiero y bursátil > Indicadores financieros y bursátiles > Rates de interés bancarias > Equilibrium interbank interest rate (TIIE)(TIIE) >A 28 días (al cierre del mes)
Source: Own elaboration ( INEGI, 2021)
Source: Own elaboration ( INEGI, 2021 ). Route: Financiero y bursátil > Indicadores financieros y bursátiles > Rates de interés bancarias > Equilibrium interbank interest rate (TIIE)(TIIE) >A 28 días (al cierre del mes)
Graph 7 Equilibrium interbank interest rate, 2010- 2021 (at the end of each year)
Source: Own elaboration ( INEGI, 2021 ). Route: Financiero y bursátil > Indicadores financieros y bursátiles > Rates de interés bancarias > Equilibrium interbank interest rate (TIIE)(TIIE) >A 28 días (al cierre del mes)
Graph 8 Equilibrium interbank interest rate, January-December 2021 (28-day quote)
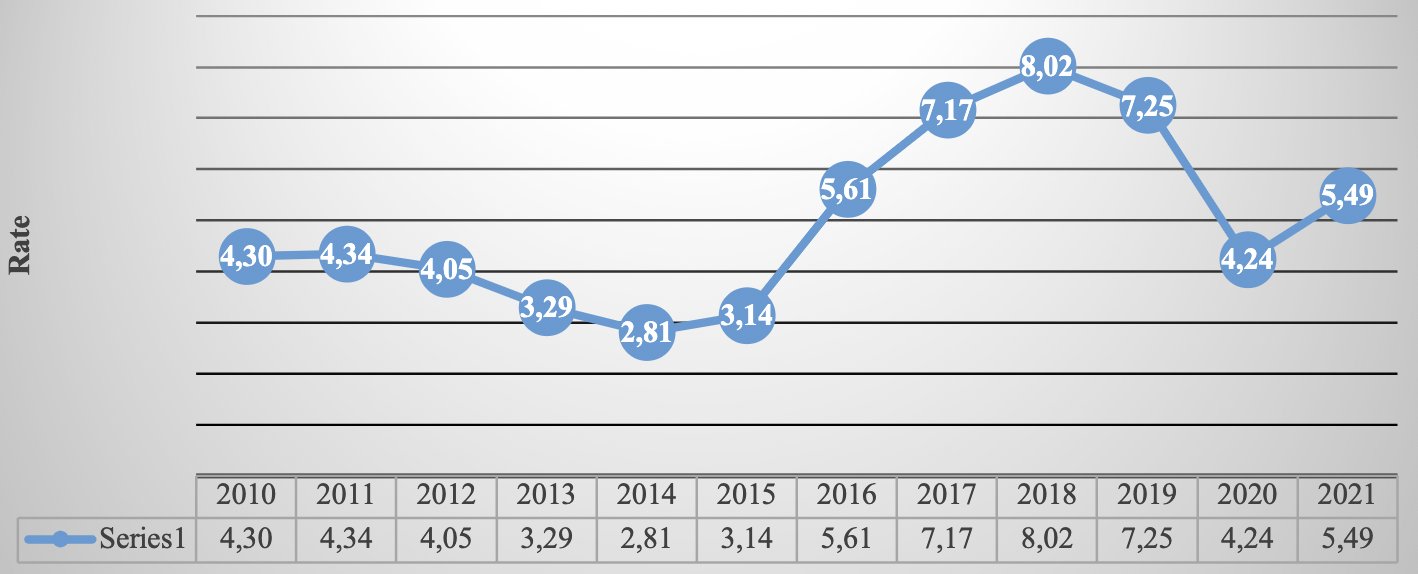
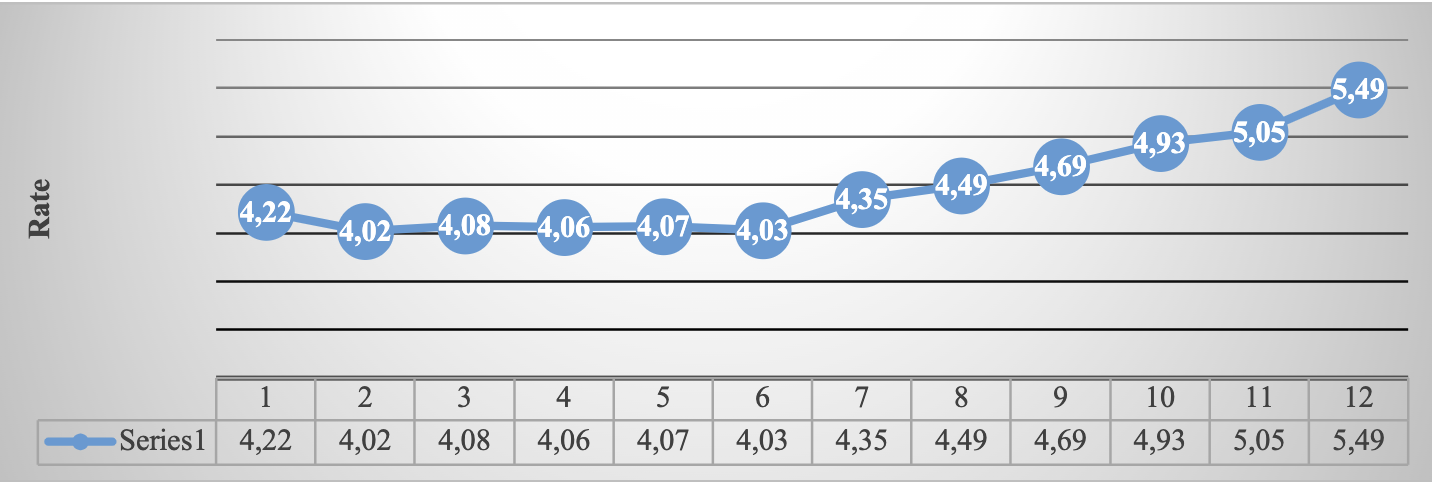
5. CETES RATE OF RETURN
Table 5 CETES rate of return 28day
| Period | 2010 | 2011 | 2012 | 2013 | 2014 | 2015 | 2016 | 2017 | 2018 | 2019 | 2020 | 2021 |
| January | 4.49 | 4.14 | 4.27 | 4.15 | 3.14 | 2.67 | 3.08 | 5.83 | 7.25 | 7.95 | 7.04 | 4.22 |
| February | 4.49 | 4.04 | 4.32 | 4.19 | 3.16 | 2.81 | 3.36 | 6.06 | 7.40 | 7.93 | 6.91 | 4.02 |
| March | 4.45 | 4.27 | 4.24 | 3.98 | 3.17 | 3.04 | 3.80 | 6.32 | 7.47 | 8.02 | 6.59 | 4.08 |
| April | 4.44 | 4.28 | 4.29 | 3.82 | 3.23 | 2.97 | 3.74 | 6.50 | 7.46 | 7.78 | 5.84 | 4.06 |
| May | 4.52 | 4.31 | 4.39 | 3.72 | 3.28 | 2.98 | 3.81 | 6.56 | 7.51 | 8.07 | 5.38 | 4.07 |
| June | 4.59 | 4.37 | 4.34 | 3.78 | 3.02 | 2.96 | 3.81 | 6.82 | 7.64 | 8.18 | 4.85 | 4.03 |
| July | 4.60 | 4.14 | 4.15 | 3.85 | 2.83 | 2.99 | 4.21 | 6.99 | 7.73 | 8.15 | 4.63 | 4.35 |
| August | 4.52 | 4.05 | 4.13 | 3.84 | 2.77 | 3.04 | 4.24 | 6.94 | 7.73 | 7.87 | 4.50 | 4.49 |
| September | 4.43 | 4.23 | 4.17 | 3.64 | 2.83 | 3.10 | 4.28 | 6.99 | 7.69 | 7.61 | 4.25 | 4.69 |
| October | 4.03 | 4.36 | 4.21 | 3.39 | 2.90 | 3.02 | 4.69 | 7.03 | 7.69 | 7.62 | 4.22 | 4.93 |
| November | 3.97 | 4.35 | 4.23 | 3.39 | 2.85 | 3.02 | 5.15 | 7.02 | 7.83 | 7.46 | 4.28 | 5.05 |
| December | 4.30 | 4.34 | 4.05 | 3.29 | 2.81 | 3.14 | 5.61 | 7.17 | 8.02 | 7.25 | 4.24 | 5.49 |
Route: Financiero y bursátil > Indicadores financieros y bursátiles > Rates de rendimiento en instrumentos del mercado primario > Certificados de la Tesorería de la Federación (CETES) > 28 días
Source: Own elaboration ( INEGI, 2021 )
Source: Own elaboration ( INEGI, 2021) . Route: Financiero y bursátil > Indicadores financieros y bursátiles > Rates de rendimiento en instrumentos del mercado primario > Certificados de la Tesorería de la Federación (CETES) > 28 días
Graph 9. CETES rate of return 2010- 2021 (at the end of each year)
Source: Own elaboration (I NEGI, 2021 ). Route: Financiero y bursátil > Indicadores financieros y bursátiles > Rates de rendimiento en instrumentos del mercado primario > Certificados de la Tesorería de la Federación (CETES) > 28 días
Graph 10. CETES rate of return, January-December del 2021 (at the end of each month)
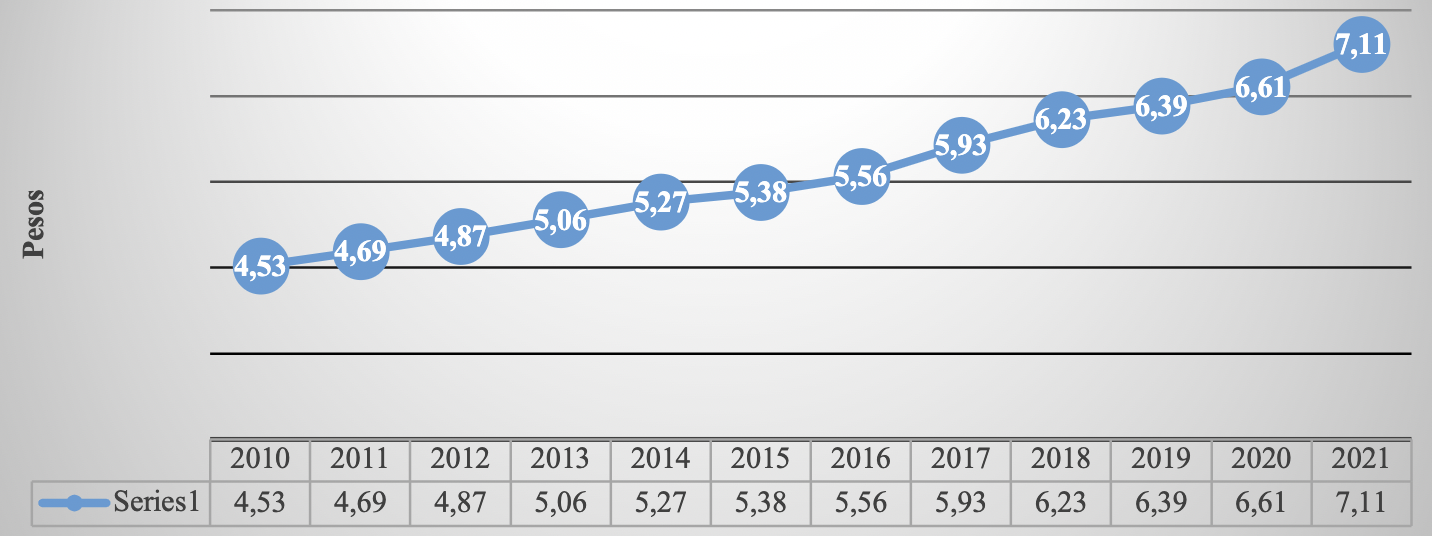
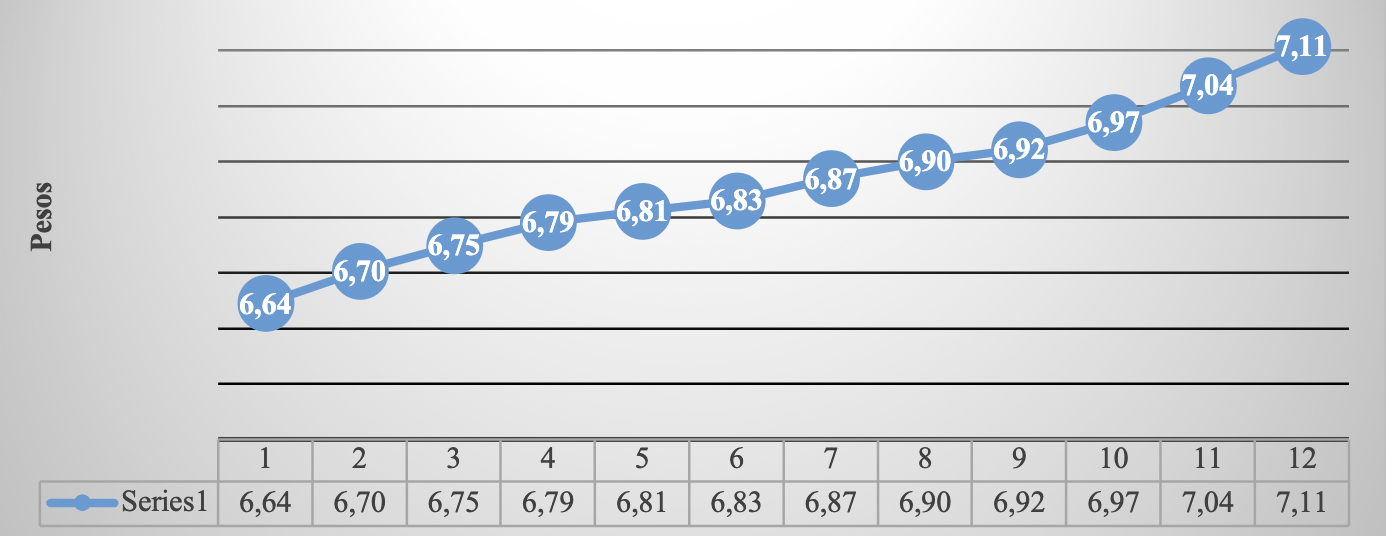
6. INVESTMENT UNITS (UDIS)
The UDI is a unit of account of constant real value to denominate credit titles. It does not apply to checks, commercial contracts, or other acts of commerce.
Table 6 Investment units value concerning pesos
| Period | 2010 | 2011 | 2012 | 2013 | 2014 | 2015 | 2016 | 2017 | 2018 | 2019 | 2020 | 2021 |
| January | 4.37 | 4.56 | 4.73 | 4.89 | 5.10 | 5.29 | 5.41 | 5.62 | 5.97 | 6.25 | 6.44 | 6.64 |
| February | 4.41 | 4.57 | 4.75 | 4.92 | 5.13 | 5.29 | 5.43 | 5.69 | 6.00 | 6.25 | 6.46 | 6.70 |
| March | 4.44 | 4.59 | 4.75 | 4.94 | 5.15 | 5.30 | 5.44 | 5.71 | 6.02 | 6.26 | 6.49 | 6.75 |
| April | 4.46 | 4.59 | 4.75 | 4.97 | 5.15 | 5.32 | 5.45 | 5.75 | 6.03 | 6.28 | 6.43 | 6.79 |
| May | 4.43 | 4.58 | 4.71 | 4.96 | 5.13 | 5.29 | 5.42 | 5.75 | 6.01 | 6.27 | 6.42 | 6.81 |
| June | 4.41 | 4.55 | 4.74 | 4.95 | 5.13 | 5.28 | 5.42 | 5.75 | 6.01 | 6.26 | 6.44 | 6.83 |
| July | 4.42 | 4.57 | 4.77 | 4.95 | 5.14 | 5.28 | 5.42 | 5.76 | 6.04 | 6.27 | 6.49 | 6.87 |
| August | 4.43 | 4.58 | 4.78 | 4.95 | 5.16 | 5.29 | 5.44 | 5.79 | 6.07 | 6.29 | 6.52 | 6.90 |
| September | 4.44 | 4.59 | 4.80 | 4.97 | 5.18 | 5.31 | 5.45 | 5.82 | 6.11 | 6.29 | 6.55 | 6.92 |
| October | 4.47 | 4.61 | 4.83 | 4.99 | 5.20 | 5.33 | 5.49 | 5.84 | 6.13 | 6.31 | 6.57 | 6.97 |
| November | 4.50 | 4.64 | 4.85 | 5.02 | 5.23 | 5.36 | 5.53 | 5.89 | 6.17 | 6.35 | 6.60 | 7.04 |
| December | 4.53 | 4.69 | 4.87 | 5.06 | 5.27 | 5.38 | 5.56 | 5.93 | 6.23 | 6.39 | 6.61 | 7.11 |
Route: Indicadores económicos de coyuntura > Indicadores financieros > Exchange rate del peso respecto al dólar y valor de las UDIS > Valor de las Investment units (UDIS)
Source: Own elaboration ( INEGI, 2021 ).
Source: Own elaboration ( INEGI, 2021 ). Route: Indicadores económicos de coyuntura > Indicadores financieros > Exchange rate del peso respecto al dólar y valor de las UDIS > Valor de las Investment units (UDIS)
Graph 11 Investment units 2010-2021 (At the end of the year)
Source: Own elaboration ( INEGI, 2021) . Route: Indicadores económicos de coyuntura > Indicadores financieros > Exchange rate del peso respecto al dólar y valor de las UDIS > Valor de las Investment units (UDIS)
Graph 12 Investment units, January-December 2021
On April 1, 1995, the Decree establishing the obligations corresponding to the UDIS was published in the Official Gazette of the Federation. Since April 4, 1995, the Bank of Mexico publishes in the Official Gazette of the Federation the value in the national currency of the Investment Unit, for each day.

