


 nueva página del texto (beta)
 Inglés (pdf)
 Artículo en XML
 Referencias del artículo
 Enviar artículo por email
 Citado por SciELO
  Similares en
SciELO
Similares en
SciELO 
 Permalink
INTRODUCTION
The paper offers a conception of economic inequality and food poverty tacit in Amartya Kumar Sen’s capability theory. To distinguish the nature and causes of poverty and inequality requires in-depth analysis beyond income distribution, to build a strong society whose characteristics are empathy and freedom. Among the strategies to minimize this, it is also necessary to review social policies and impartially address the fundamental shortcomings of the population.
For more than 20 years, new proposals have emerged that explain that poverty should not only refer to income but the deprivation of basic capability. Thus, Sen’s theory addresses the issue based on the capability theory, where his proposals are about the importance of moving towards the juncture of concepts, metrics, and policies, with the understanding that government intervention will be more effective if it prioritizes being and doing, rather than having, and thus achieve a multidimensional approach. The objective of the research is to analyze food poverty and the effects in terms of vulnerability due to the Covid-19 pandemic in Mexico City from the capability approach, with a sustainable administration perspective.
Mexico is the most unequal country in Latin America, although not the poorest. In terms of sustainability (whose basic concerns are the minimization of poverty and the effects of climate change), therefore the management must put into action the principles of effectiveness, but with care in the social, environmental, and economic impacts. In such a context, sustainable administration must consider changes in such a way that the objectives of increasing the quality of life of the interested parties prevail, as well as preserving ecosystems without losing sight of the performance of the organizations. Manage resources in such a way that with ethics and transparency it is possible to minimize poverty, contribute to the objective of “zero hunger”, close gaps of inequality and opportunities.
This research presents the conceptual aspects of inequality and poverty, dimensions, and indicators, describing the work of Sen, the capability theory, and the influence it had on the conception of poverty from the multidimensional approach, specifically the case of Mexico City. By having a methodology with these characteristics, it can be conceived that the best practices in the field are recovered, thereby explaining food poverty and its relationship with economic inequality. The research analysis focused on four boroughs: Iztapalapa, Tláhuac, Iztacalco and Gustavo A. Madero. It ends with the presentation of the impact of the Covid-19 pandemic on poverty in general.
DEVELOPMENT
Atkinson ( 2019 ) presented several studies on measuring poverty around the world; his way of reviewing the methodologies for such a case enabled the observation that there are measurements on income, as is done in Latin American and Caribbean countries, or on consumption, as shown in countries in Africa. In general terms, poverty is measured in monetary terms, and the comparative points reviewed included the following: consumption vs income, people vs households, short vs long term. There were also questions, such as what dimensions or indicators were used? What is the sample size? Was everyone considered? What are the resemblances or similarities in the methodologies? In this sense, it is important to understand the nature and causes of poverty ( Lépore, 2007 ; Giménez and Adarme, 2016 )
INEQUALITY, POVERTY, AND OTHER RELEVANT TERMS
The International Glossary on Poverty and that of the National Council for the Evaluation of Social Development Policy (Spanish acronym CONEVAL) reflect an important work in compiling a series of definitions to enable an understanding of poverty, with emphasis on food poverty and inequality ( CONEVAL, 2014 , 2018 , 2019 , 2020a , 2020b , 2021a , 2021b, 2021c , 2021d ).
Poverty and inequality have been the main topics of different studies and forums around the world, in which goals have been set for their eradication, such as those described in the United Nations (UN) Sustainable Development Goals. Some of these definitions are presented below:
1. Economic distance . Involves the population that does not have control over resources and is significantly different from others in society. “There is an inevitable connection between poverty and inequality: some degree or dimension of inequality [...] will lead people to fall below the minimum acceptable levels in that society. This aspect of economic distance is what constitutes poverty” ( O’Higgins and Jenkins, 1990 ). The term was introduced in the Luxembourg Income Study to describe the situation of people whose income is below 50% of the median income ( Smeeding et al., 1990; Spicker and Álvarez, 2009, p102 ).
2. Impoverishment. In some cases, this results from the degradation of productive resources (land, pasture, or fisheries); falling prices for commodities (such as crops, livestock, fish, labor); lack of work; deprivation of livelihoods such as land and water; and weakening of social solidarity networks. Famine and mass impoverishment are also associated with reduced or absent entitlements ( Sen, 1981 ).
3. Equality . Generally used to demonstrate that quantitative information about social problems does not represent simple facts, but rather ways of organizing data that would otherwise be complex and unreliable. Indices. An index consists of a set of indicators that are combined to produce a composite measure ( Spicker and Álvarez, 2009, p155 ).
4. For the United Nations Development Programme (UNDP), poverty means “the denial of the most fundamental opportunities and choices for human development: to live a long, healthy and creative life and to enjoy a decent standard of living, freedom, dignity, self-respect, and respect for others”. In other words, “poverty represents the absence of certain basic capabilities” ( UNDP, 2011) .
5. Multidimensional poverty. A person is in a situation of multidimensional poverty when he/she is not guaranteed the exercise of at least one of his/her rights for social development, and his/her income is insufficient to acquire the goods and services required to satisfy his/her needs ( CONEVAL, 2018 ).
6. Poverty . A person is in a situation of poverty when he/she has at least one social deprivation (in the six indicators of lack of education, access to health services, access to social security, housing quality and spaces, basic housing services, and access to food) and his/her income is insufficient to acquire the goods and services required to satisfy his/her food and non-food needs ( CONEVAL, 2020b) .
7. Extreme poverty. People in such a situation have such low income that, even if they were to spend all of it on buying food, they would not be able to obtain the necessary nutrients to have a healthy life ( CONEVAL, 2020b ).
8. Vulnerability . This is defined by harm, not risk. ( Chambers, 1989, as cited in Spicker and Alvarez, 2009 ) He argues that, in general, policies aimed at alleviating poverty have not taken into consideration the vulnerability of the poor. Policies have focused on income or consumption levels, not on the factors that exacerbate poverty or expose individuals, households, and communities to the risk of impoverishment ( Spicker and Álvarez, 2009 ).
9. Vulnerable due to social deprivation. Non-poor population with one or more social deprivations but whose income is higher than the income poverty line ( CONEVAL, 2020b ).
10. Vulnerable due to income . Non-poor population with no social deprivations but whose income is lower than or equal to the income poverty line ( CONEVAL, 2020b ).
For this research, the above list implies specifying the differences between poverty, inequality, poverty, and food insecurity.
SEN AND THE CAPABILITY THEORY
In 1973, the Organization of Ibero-American States for Education, Science and Culture (Spanish acronym OEI) identified inequality as a significant variable in different parts of the income distribution, mentioning that no assessment of poverty is 100% relative, since absolute income effects in quantitative terms the population living in poverty in a particular society. Thus, the study of poverty cannot be seen only as a study of inequality ( Sen, 1997 ).
Since 1976, Sen has worked to integrate the two concerns: poverty and inequality, which have been extensively researched by several authors. As is well known, Sen also questioned this conception of analyzing “income poverty” because it was considered that it conceals some fundamental aspects of economic deprivation ( Sen, 1997 ).
According to Sen ( 2000 ), poverty is “capability deprivation, focusing on analysing the limitations of basic capabilities that people have to function, and not just as a low income”. The author pointed out that these capabilities are basic for the exercise of freedom, so this condition limits freedoms, causing in turn “premature mortality, a significant degree of malnutrition, a high level of illiteracy, among other deficiencies”. Sen’s capability theory, therefore, focuses on people, not on institutions, and its purpose is to provide more precise guidance to governments concerning the bases on which it is relevant to support the design of public policies aimed at effectively meeting the demands of equity and social justice, beyond the mere obsession with improving national economic production and income distribution.
Therefore, the lack of such freedoms represents an obstacle for an individual in society since he/she cannot obtain that which is of value to him/her; the lack of resources and income distance them from a sustainable life or free of deficiencies that are fundamental for his/her economic, social, and cultural development. The measurement of poverty based on capability is done with the Sen Poverty Index, which is an alternative to the incidence index and the poverty gap, which aims to consider the intensity of both poverty and inequality ( Spicker and Álvarez, 2009 ).
It is necessary to reflect that, when it comes to studying poverty, one necessarily resorts to counting the number of poor people. Sen’s proposal is aimed at evaluating it. Once the poor population of a community is identified, we proceed to characterize them and evaluate the level of poverty in that place, using variables such as income, which is just one of many factors that influence the real opportunities that people have. These opportunities are influenced by variations in individual circumstances, such as age, disability, exposure to disease, talents and skills, sex, maternity, and by environmental and social contexts such as epidemics, pollution, crime, local social insecurity.
In concrete terms and referring to Bracamontes and Camberos ( 2011 ), who analyzed the methods of poverty measurement, they described that Sen proposed a hybrid measurement by combining the overall poverty index (H) and poverty intensity (I), as follows: P = HI, where the values of H are represented by: 0 ≤ H ≤ 1.
Furthermore, about the principle of difference, Rawls ( 1971 as cited in Sen 1997 ) pointed out that priority should be given not necessarily to the less happy individual, but to the less privileged. This premise is based on the lower rate of value of primary goods. understood as those “general-purpose resources that help anyone to further their purposes and include rights, freedoms and opportunities, income and wealth, and the social foundations of self-respect”. He also explained that even though one person may have the same basket of primary goods as another (or even higher), one may be less happy than the other because of the use he/she makes of his/her income.
Sen’s position is that capabilities provide a more attractive benchmark for comparison, whereas others argue that the priority of welfare maximization, such as satisfaction, or resource maximization, which describes income and wealth, are inescapable for measuring equality. Each one defends their proposal to carry out such measurement and Sen has an interest in offering a notion of basic justice ( Table 1 ).
Table 1 From the principle of difference to satisfaction for justice
| Income and Wealth | Satisfaction | Basic Justice |
| Resource Maximisation | Welfare Maximisation | Health, education, political participation, non-discrimination, comparative use of capabilities |
Sen made a critique of John Rawls’ “Theory of primary goods”, as it states that primary goods are one more element of a highly complex general theory and consider that a country is better for its citizens the more resources it has if it divides them equally (or equally enough) among all its inhabitants ( Nussbaum, 2018 ).
Nussbaum ( 2018 ).
As a result of the analysis made by Sen, regarding poverty, he explained that income is only important to lead an adequate life” since it is also a lack of capability, such as the minimum capacities to avoid hunger, malnutrition, or weight loss ( Sen, 1981 ). For the same author, capabilities are substantial freedoms, a set of opportunities (usually interrelated) to choose and to act; in a person, these are the alternative combinations of functionings that are feasible to achieve. It does not consider only the abilities that lie inside a person but includes the freedoms or opportunities created by the combination between those personal faculties and the political as well as the social and economic environment ( Nussbaum, 2018 ).
The philosophical influence of the capability theory has an extensive list of thinkers, from the ideas of Aristotle and Socrates to Nobel Prize for Literature winner Rabindranath Tagore to Mahatma Gandhi. Another theory with its ancestry that considers Sen’s criteria is the thought of Marxism, in the same way, the conceptions of freedom and self-development were studied by Stuart Mill. Finally, in this synthesis of authors of economic science, literature, and politics we find Adam Smith and his writing on moral sentiments.
The impact of Sen’s proposals is understood, since according to Vergara ( 2016 ), Sen was accurate when from an ethical approach he pointed out that there is no justification for separating the study of economics from that of ethics and philosophy and that to this subject two fundamental issues arise for economics: ethics and social achievements.
According to Nussbaum ( 2018 ), when poverty is analyzed as a lack of capability, the focus is only on how well or badly each person is doing. In addition, such a study highlights the possible distributive inequalities within the family itself; in this sense, one of the points to highlight in this theory is the value of unpaid domestic work at the time of evaluating a disadvantaged situation. In the capability theory, the visibility of famine has put nations on alert not only because it highlights the scarcity of food, but also because it responds to the lack of opportunities for those who suffer from it to obtain what they need (due to lack of employment), i.e., it takes up the importance of poverty and food security. The following represents the interrelationship of capabilities ( Table 2 ).
Table 2 Interrelationship of capabilities
| Functioning | Capability | Agency |
| Freedom of the individual to live a lifestyle | Combinations of functionings (being and doing) a person can achieve | Freedom that the person has in doing or being the things that he/she values |
The distance between economics and ethical behavior weakens the scope of welfare. It is emphasized in this sense that the Pareto optimality criterion limits the valuation of social achievements.
Nussbaum ( 2018 ).
ECONOMIC INEQUALITY AND FOOD POVERTY IN MEXICO CITY
The classification between developed and undeveloped countries, between rich and poor, has been an element of study in different sciences such as economics. Some authors such as Gutiérrez and González ( 2010 ) justify the theories of economic development in the sense that they propose assumptions to study the conditions, causes and factors of economic inequality between those who have more and those who have less; these assumptions are focused on the person or groups, as well as on monetary terms, or capabilities or multifactor. Also, Castillo ( 2016 ) has argued that poverty, lack of capability, and non-equality are a form of violence and lack of human rights.
It should be noted that in most of the references considered in this paper, the words “poverty and inequality” are found together, but they are different meanings and Casas and Barichello ( 2015 ) made a distinction where they explained that the two terms are a measure of welfare, but for poverty this is absolute and the second is relative.
According to Núñez ( 2006) , the first studies on economic inequality are based on the proposals of analysis through Lorenz curves in 1905. The Organisation for Economic Co-operation and Development defines it as the difference in how assets, welfare, or income are distributed among the population, that is, it is the dispersion that exists in the distribution of income, consumption, or some other welfare indicator ( Litchfield 1999, as cited in Galindo and Ríos, 2015 ).
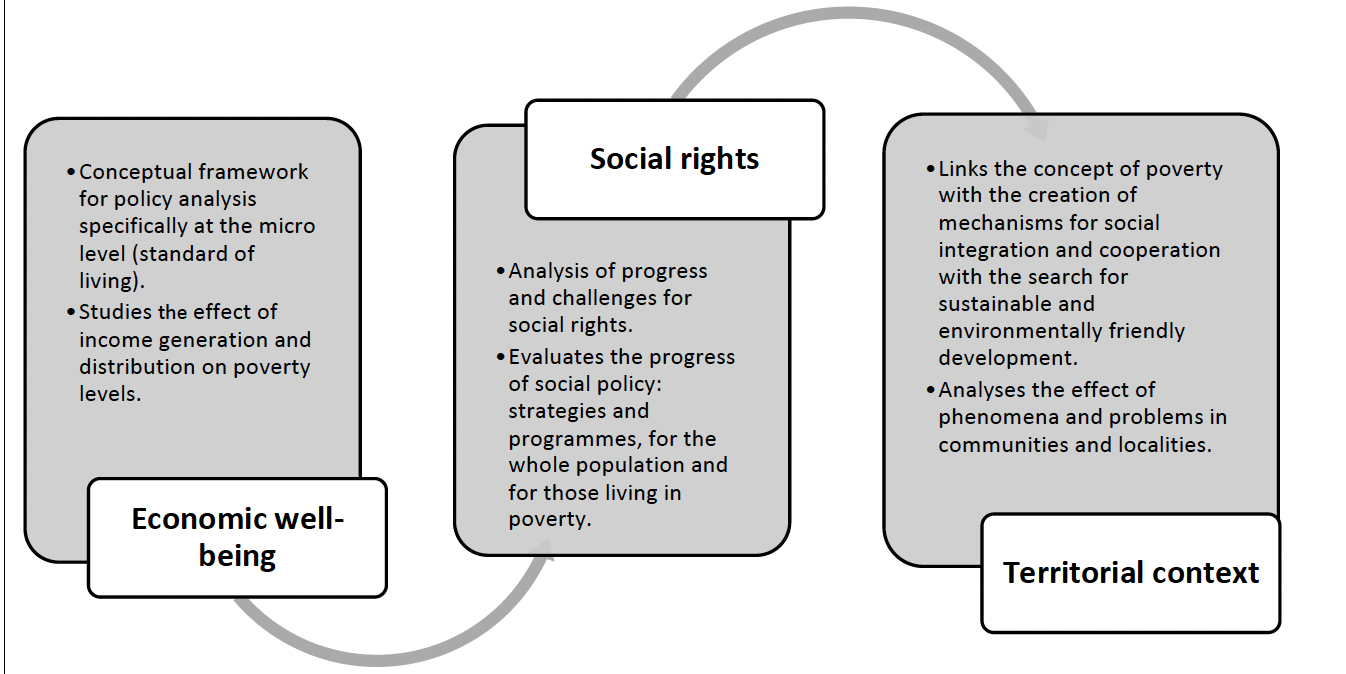
Note: The measurement of food poverty and economic inequality requires a criterion allowing the population to be classified into different groups concerning their poverty circumstances.
Source: Own elaboration ( CONEVAL, 2014 , 2018 , 2019 , 2020a , 2021a ).
Figure 1 Multidimensional elements of poverty according to CONEVAL
It is important to clarify that poverty should not be confused with inequality; the latter refers to the variation in living standards of the population, regardless of whether the population is in poverty ( McKay 2002, as cited in Galindo 2015 ).
In the case of Mexico, the National Council for the Evaluation of Social Development Policy (CONEVAL) is the official agency, whose objectives include measuring inequality, where the methodology it uses is based on income per household, also using the Gini coefficient (economic inequality is measured based on the income distribution of the population in each period). Monetary approaches also allow for subclassification into:
1. Food poverty
2. Capability poverty
3. Property poverty
The elements of the multidimensional methodology are shown below ( Figure 1 ), focusing on three main elements: economic welfare, social rights, and territorial context. With this, it can be said that it shares some parts of Sen’s theory. Also, to identify the different indices used to measure poverty and which of them consider the issue of economic inequality or food poverty, a comparative table of indices for measuring poverty was prepared ( Table 3 ).
Table 3 Different indices measuring poverty inequality and food security
| Index | Agency/Entity/Program | Components and/or elements and/or variables and/or categories |
| Laeken indicators For poverty and social inclusion | European Council National Action Plans for Social Inclusion (NAP/incl) | Primary and secondary indicators : rates of quantitative and qualitative information such as: - Income and income distribution (including Gini Coefficient) - Unemployment - Population - School dropout and health |
| Poverty Gap Index (PGI) Proportional poverty gap | -Poverty incidence and intensity | |
| Foster, Greer, and Thorbecke Poverty Index (FGT) Also known as Pa Indicator, it shows evidence of inequalities among the poor | Elements: - Population, number of poor, poverty line and income per capita | |
| Poverty Incidence Rate | W of individuals, households, or families that fall below the poverty line | |
| Human Poverty Index (HPI) | UNDP Human Development Report | Based on Sen’s proposal - Incidence and inequality gap |
| Sen Index (SI) Alternative Poverty Measure | Poverty intensity - Incidence rate - Poverty gap (intensity) - Gini Coefficient | |
| Human Development Index (HDI) Instrument combining people’s longevity, education, and income for a dignified life | UNDP Human Development Report | - Health index - Education index - Income index |
| Food Security Index (FSI) | United Nations System World Bank and UNDP International Fund for Agricultural Development (IFAD) Indices designed to measure rural poverty and deprivation | Combination of variables between food production and consumption |
| Integrated Poverty Index (IPI) | The index that combines the poverty incidence rate with income gap rates, income distribution below the per capita growth line | |
| Basic Needs Index (BNI) | Index composed of education and health | |
| Relative Wellness Index (RWI) | Median of FSI, IPI, BNI |
Source: Own elaboration ( Spicker and Álvarez, 2009 ).
As claimed by Spicker and Álvarez ( 2009 ), “poverty has no single meaning. It contains a series of meanings related through a series of similarities” (p.292). Considering this thought, the table above was made, where it is observed that only the International Fund for Agricultural Development (IFAD) has a specific metric to measure food security, and although the rest do not have this explicitly, it is likely that, when considering the income variable, they measure it. It is significant to note that one of the first techniques for measuring poverty was based on the food variable proposed by Watts in 1967.
Moreover, the Global Food Security Index (GFSI) was created in 2011 to provide information on the development of the Sustainable Development Goals (SDGs). Next, the world heat map ( Figure 2 ) is presented to represent the position of countries about food security, which has four dimensions: affordability, availability, quality and safety, and natural resources and resilience ( Economist Impact, 2021 ).
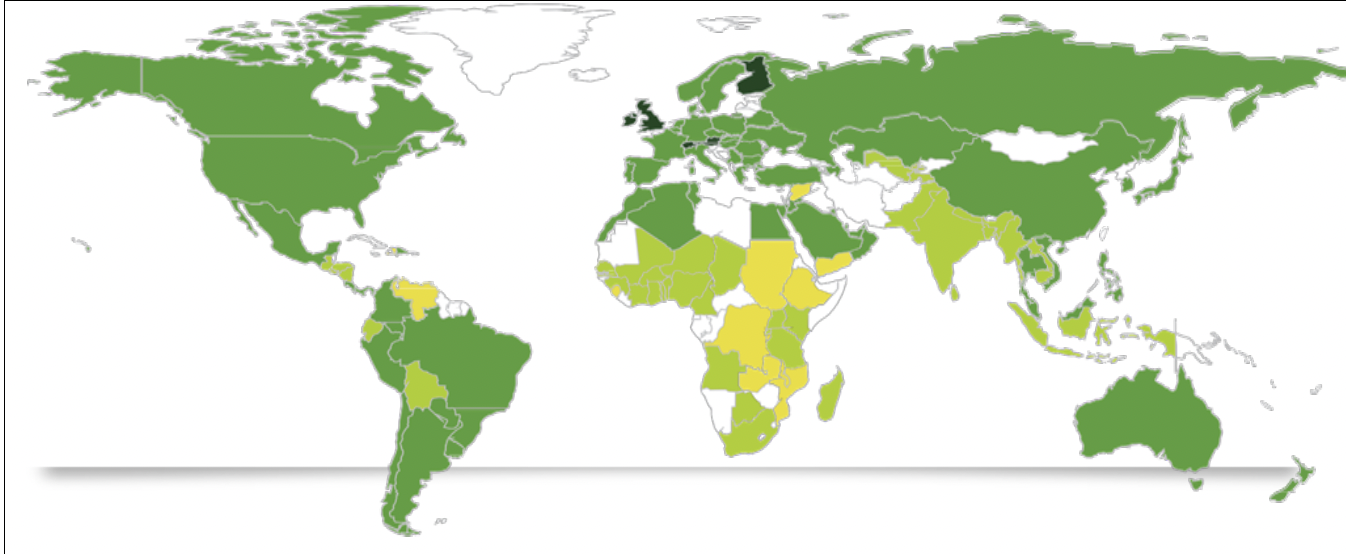
The darker the color, the better the performance, so according to the Corteva Agriscience methodology, Mexico is a country of good performance in 46th place out of 113 countries; Ireland is the top-ranking country, followed by Austria and the United Kingdom, respectively.
Source: Global Food Security Index (2021).
Figure 2 Representation of the Global Food Security Index
Describing food poverty implies addressing food insecurity, which, according to the World Food Summit ( FAO, 2011 ), exists when all people, always, have physical, social, and economic access to sufficient, safe, quality food that meets their requirements for a life of quality and health. Food insecurity is defined as little or no access to adequate nutritional food for human development.
Furthermore, ( CONEVAL, 2020a ; 2020b ) presents four dimensions of food security ( figure 3 ) and it establishes that for food security goals to be met they must be achieved simultaneously, when an individual, household, or population lacks any of them - even for a short period - then the individual, household or population will be in a state of food insecurity.
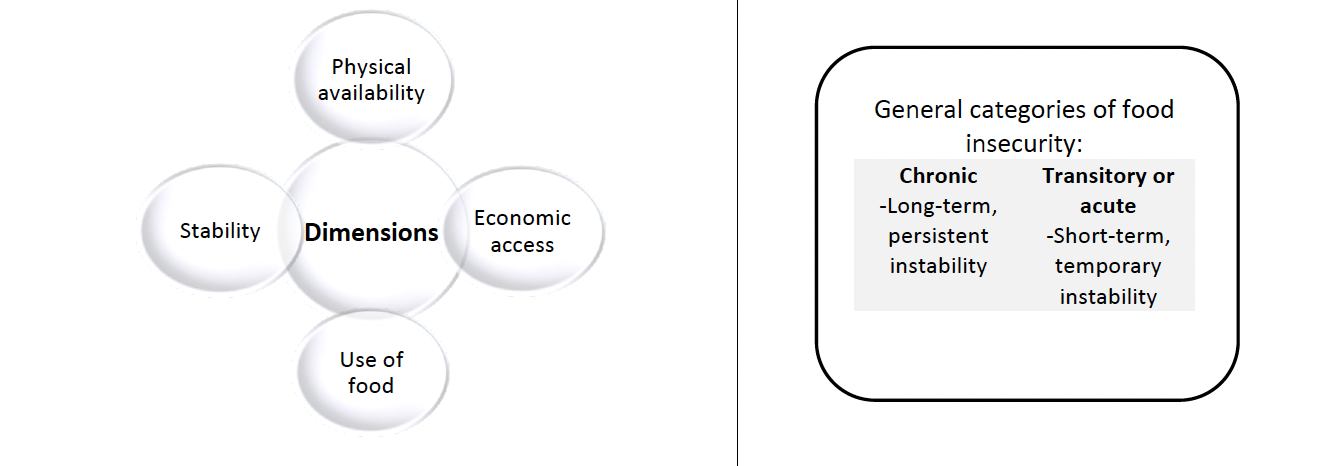
Note: Classification in terms of intensity of food insecurity was proposed in two categories: chronic and transitory, as shown in Figure 4.
Source: Own elaboration (Spicker and Álvarez, 2009 ; FAO, 2011 ).
Figure 3 Dimensions and categories of food security
When food security is not achieved, then the following types of insecurity arise 1. Moderate, 2. Acute, 3. Chronic and 4. Severe. The latter is when people are likely to have run out of food, go hungry and, in the most extreme case, go days without food, putting their health and well-being at serious risk ( FAO, IFAD, WHO, WFP and UNICEF, 2019 ).
Considering the above, it can be said that food poverty, being closely linked to food insecurity, has indicators that can help with the gradual assessment of food insecurity, such as the variables level of household income and level of poverty. It should be noted that CONEVAL considers the following elements to identify the population in conditions of vulnerability due to poverty ( Figure 4 ).
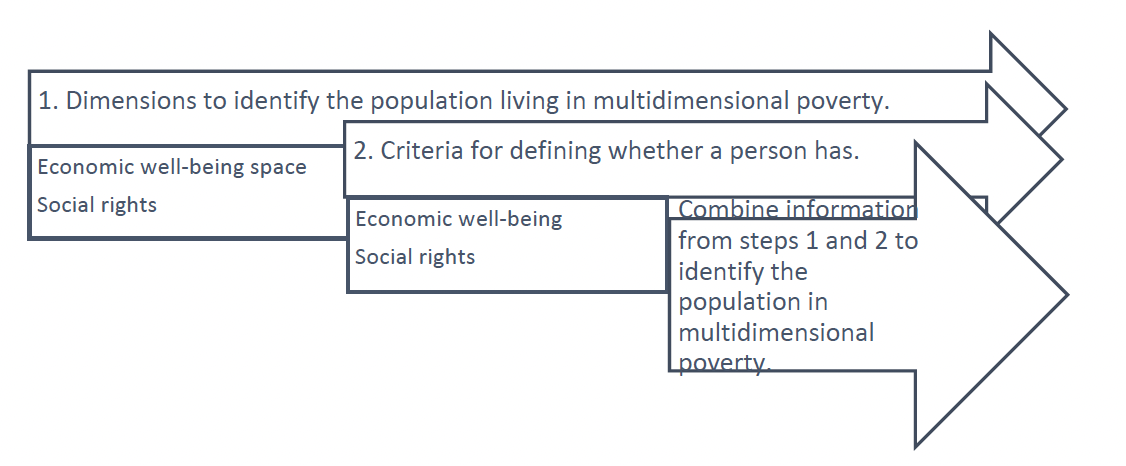
Source: Own elaboration.
Figure 4. Elements to identify the population in poverty, according to the CONEVAL
In the context of methodologies to measure poverty, Godinot ( 2021 ), of the Multidimensional Poverty Peer Network of the University of Oxford, has observed that there are five dimensions of poverty that are not studied. He has proposed a series of instruments to collect aspects of formal and legal work, physical security, social relations (connectivity), psychological well-being and happiness, and people’s empowerment, through questionnaires with a Likert Scale.
IMPACT OF THE COVID-19 PANDEMIC ON POVERTY
The World Bank ( 2021 ) predicts that global extreme poverty will increase not only because of the impact caused by the Covid-19 (coronavirus) pandemic but also by the forces of conflict and climate change. Many of the people who had barely escaped extreme poverty may fall back into it; it is estimated that because of the health crisis there will be more than 115 million people in extreme poverty.
The history taken up by the World Bank is from 2018, showing that, out of every five people below the international poverty line, four lived in rural areas. Children and women will be more vulnerable to a lack of skills and opportunities for a better quality of life.
Specifically, with economic information, more than 67% of the poor will live in poor countries affected by war and violence; those economies represent 10% of the world’s population. In addition, more than 120 million poor people live in areas at risk of flooding due to climate change. The figures are alarming: in addition to this, and due to changes in land use, poverty will increase in urban areas, and formal jobs will be insufficient.
The latest research suggests that there is little chance of meeting the Sustainable Development Goals, and some of them are set to regress. According to the BBC News editorial report ( May 2021 ), the projections made by the Economic Commission for Latin America and the Caribbean (ECLAC), in Latin America poverty reached its highest level in the last 12 years, affecting 33.7% of the population, that is, one in three Latin Americans is in hardship. Extreme poverty in Mexico soared from 10.6% to 18.3%.
In Latin America, the situation is serious, with poverty increasing from 20% to 26.1% in Honduras and from 7.6% to 12.8% in Ecuador. The only countries with low levels of poverty are Brazil and Panama. The closure of economic activities, the fall in employment, and the reduction of commercial and investment activities are only a reflection of inequality and poverty, which are not the result of the pandemic, but of previous crises: but financial, economic, real estate, and food crises.
METHOD AND RESULTS
To achieve the objective, an analysis is required of food poverty and the effects in terms of vulnerability in Mexico City from the capability approach. After the analysis of the poverty variable from the capability approach, the conceptual differences of inequality and poverty, the dimensions of the multidimensional metric, Mexico’s food poverty situation was approached from the primary sources yielded by the results of the latest studies carried out by CONEVAL.
CONEVAL’s methodology ( Coneval, 2019 ) considers two units of analysis: economic well-being (based on per capita income) and social rights (six variables according to Mexican Social legislation: education, health services, social security, housing quality, spaces, and services).
For this study, the analysis focused on three aspects that are considered focal to observe the phenomenon of poverty and food insecurity: vulnerability due to social deprivation, income, and scarcity due to access to food.
The research is limited to four boroughs in Mexico City, two of which are because they reflect a greater number of poor people, as well as the two boroughs that are adjacent to the one with the highest number of poor. According to the selected criteria, the boundaries are as follows: Iztapalapa, Tláhuac, Iztacalco, and Gustavo A. Madero.
In the first part and with the delimitation according to the 2010-2015 measurement made by CONEVAL, it is presented through graphs that show the frequency as to the number of people, as well as the frequency of poor people living in Mexico City by borough.
Figure 5 shows the total population per borough and the number of poor people per borough. Iztapalapa, Gustavo A. Madero, Álvaro Obregón and Tlalpan have the highest population and highest rate of poverty.
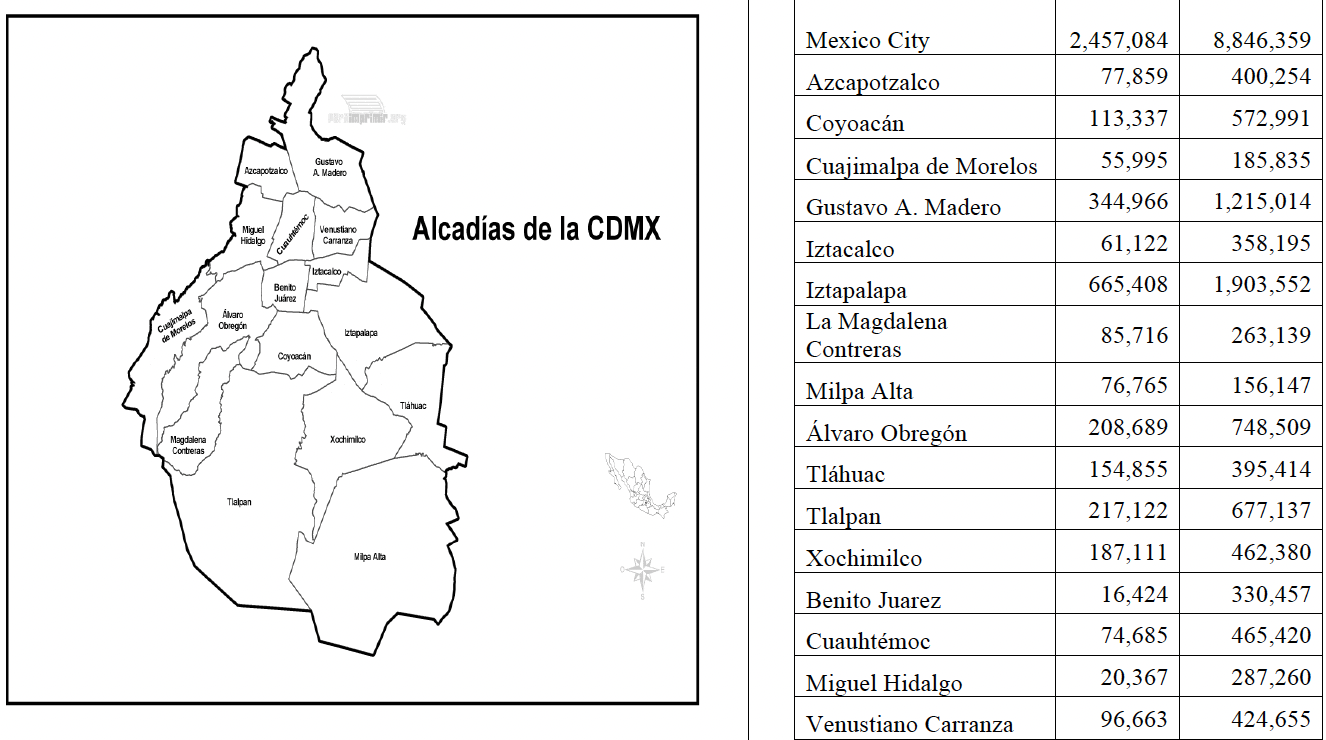
Source: Own elaboration ( CONEVAL, 2014 , 2018 , 2019 , 2020a , 2020b , 2021a , 2021b , 2021c , 2021d ).
Figure 5 Mexico City: 16 boroughs
The image of the political division of Mexico City was taken from Mapa-de-alcadías-de-la-cdmx-para-imprimir.gif (946×731) (paraimprimir.org)
After identifying the areas with the poorest people by political division, the information was stratified to represent the four selected boroughs by population and poverty ( Graph 1 ), and Graph 2 shows a comparison of the population in extreme poverty.
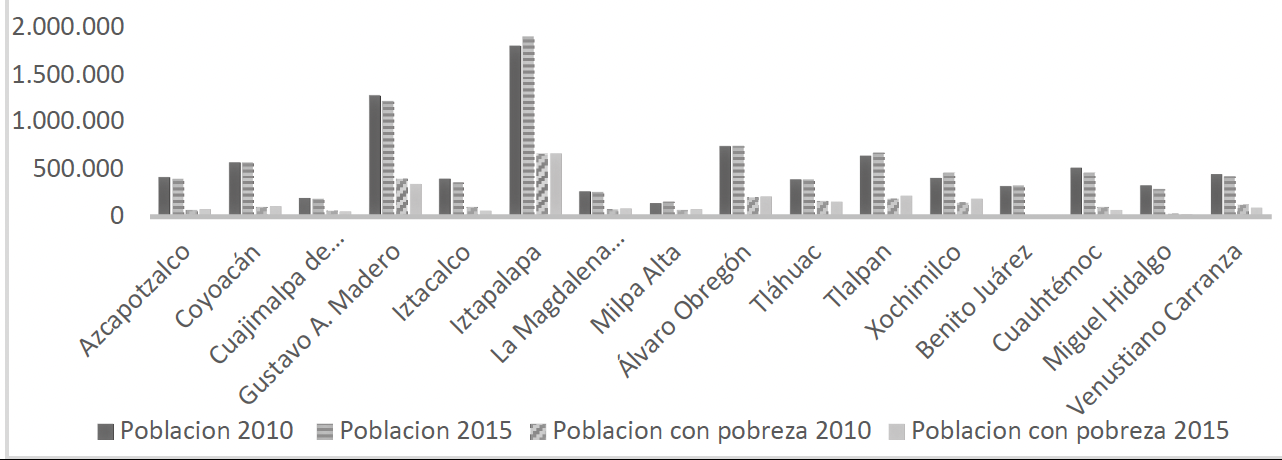
Source: Own elaboration ( CONEVAL, 2014 , 2018, 2019 , 2020a , 2020b , 2021a , 2021b , 2021c , 2021d ).
Graph 1 Population and poverty in Mexico City
Source: Own elaboration ( CONEVAL, 2014 , 2018 , 2019 , 2020a , 2020b , 2021a , 2021b, 2021c , 2021d ).
Graph 2 Population living in poverty and percentage with the total of Mexico City 2010-2015
According to the results of the measurement of extreme poverty in 2010, the borough with the highest poverty was Tláhuac with 4.1%, while Iztacalco had the lowest extreme poverty with 1.4%, but in 2015 Iztapalapa reached 1.7% of extreme poverty and Iztacalco experienced its lowest level with 0.4%. Meanwhile, in 2010 Gustavo A. Madero saw 1.6% of its population living in extreme poverty and had a 1.1% decrease of this in 2015 ( Graph 3 ).
Source: Own elaboration ( CONEVAL, 2014 , 2018 , 2019 , 2020a , 2020b , 2021a , 2021b , 2021c , 2021d ).
Graph 3 Population living in extreme poverty 2010-2015
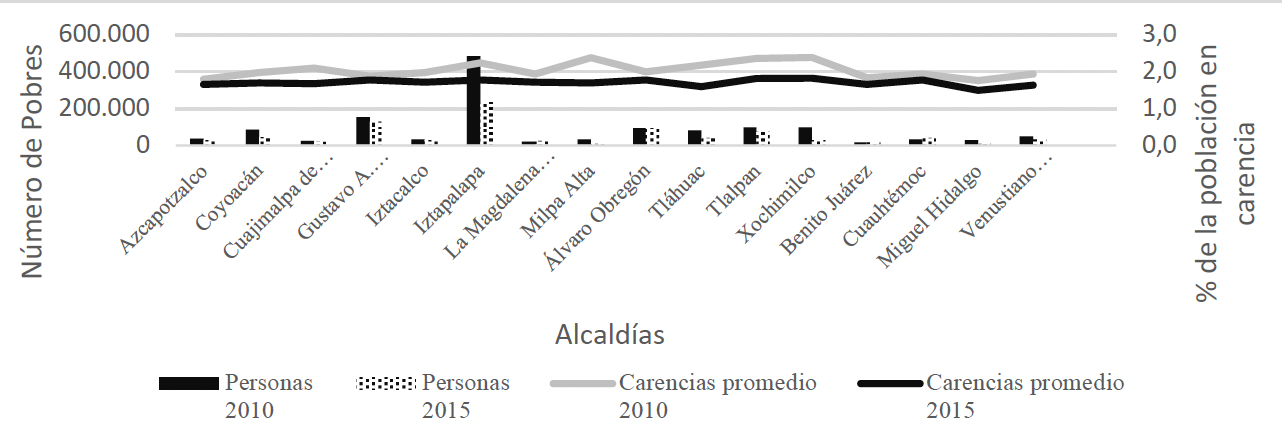
Graph 4 shows the number of people in fragile situations due to social deprivation for 2010 and 2015 for the four boroughs. Social deprivation in 2010 shows that Iztapalapa had 33.0%, followed by Iztacalco with 31.8%. The lowest level was obtained by Tláhuac with 28.7%, while Gustavo A. Madero reached 28.8%. For 2015 Iztacalco decreased its vulnerability by reaching 29.4% but was the highest of the year, and Tláhuac was once again the lowest with 23.1%. Iztapalapa fell to 27.5% and Gustavo A. Madero has 23.5% of its population affected by this deprivation.
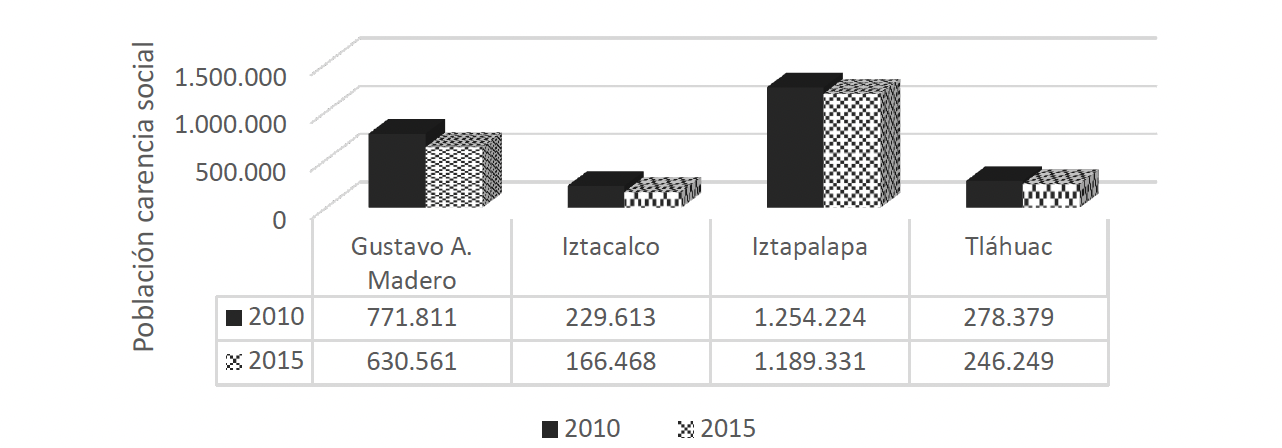
Note: Evolution of social deprivation in Gustavo A. Madero, Iztacalco, Iztapalapa and Tláhuac boroughs of Mexico City, 2010-2015.
Source: Own elaboration ( CONEVAL, 2014 , 2018 , 2019 , 2020a , 2020b , 2021a , 2021b , 2021c , 2021d ).
Graph 4 Number of people by lack of opportunities due to social deprivation 2010-2015
The variability in terms of the different vulnerabilities was obtained through K, variability index, where “n” is the number of populations:
Concerning variability by social deprivation, it was observed that Iztapalapa was the one that decreased vulnerability due to social deprivation the least, since it only decreased by 0.0573, followed by Tláhuac with 0.1154, Gustavo A. Madero with 0.1830, and Iztacalco with 0.2750.
Regarding the monetary value of a basic food basket per person per month and the extreme poverty line by income, formerly the minimum welfare line, it was obtained that for 2010 the percentage of the population with lower income in the four boroughs have the following behavior: Gustavo A. Madero has 8.2% of the vulnerable population by income, in second place is Tláhuac with 7.3%, followed by Iztacalco with 6.9% and lastly Iztapalapa with 5.3%. For 2015 this increased in three boroughs: in the first place, Tláhuac with 12.3%, followed by Gustavo A. Madero with 11.5%, and Iztapalapa with 8.7%. Iztacalco presents a decrease of 5.8%. These percentages shown are the population that does not reach the level of income to acquire the basic food basket ( Graph 5 ).
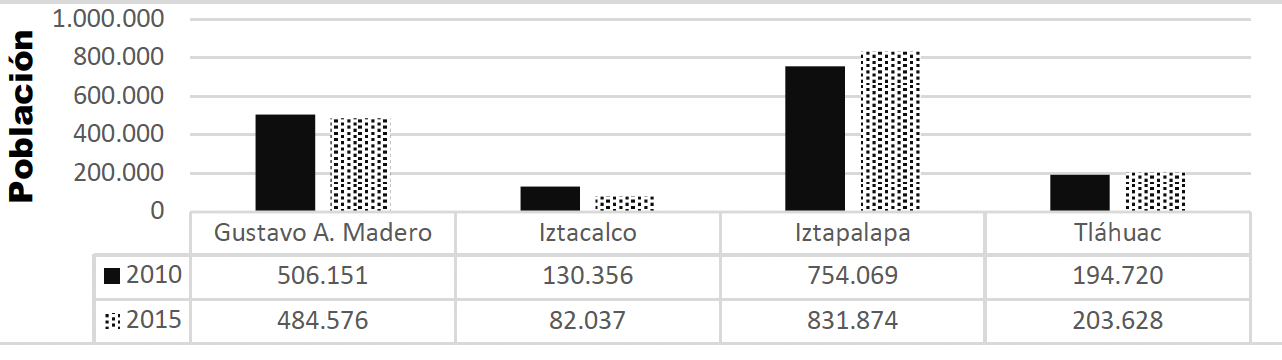
Source: Own elaboration ( CONEVAL, 2014 , 2018 , 2019 , 2020a , 2020b , 2021a , 2021b , 2021c , 2021d ).
Graph 5 Vulnerable by income - income below the welfare line - 2010-2015
It was observed that Iztapalapa increased the number of people when considering income on the welfare line in 2015, so the figure was 0.1031 more than in 2010, followed by Tláhuac with 0.0457. Iztacalco saw a decrease in the vulnerable population with 0.3706 and Gustavo A. Madero with 0.0426. The indicator on lack of access to food shows the population with moderate or severe limitations in always having access to sufficient food to lead a healthy and active life.
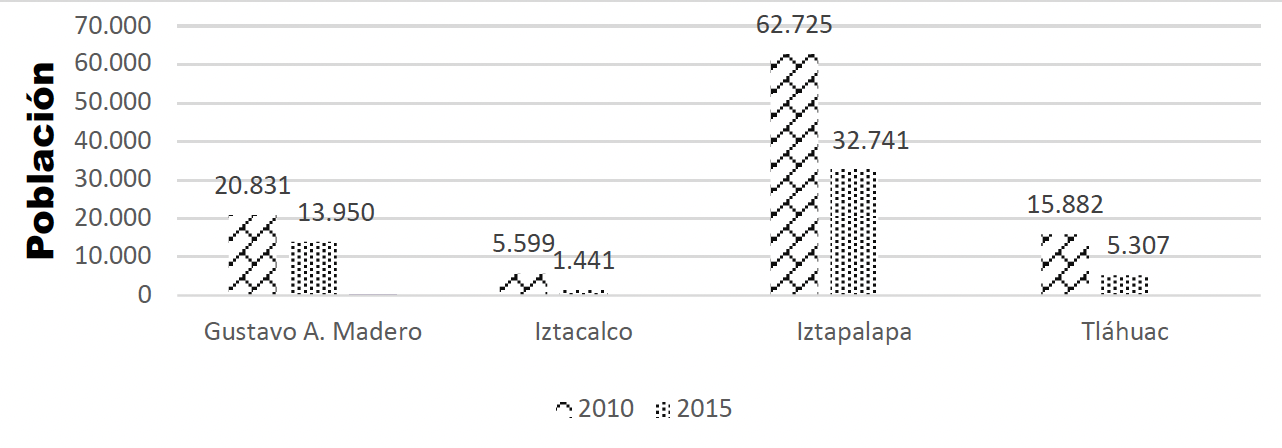
Graph 6 shows the indicator of food deprivation in the four boroughs of Mexico City. It is observed that the population of Iztapalapa has food deprivation of 26.8% in 2010, and by 2015 this had fallen drastically to 12.3%. Tláhuac’s food deprivation had fallen from 20.7% in 2010 to 10.4% in 2015, Gustavo A. Madero from 12.1% to 10.8%, and Iztacalco from 8.2% to 8.7%. In 2018, the percentage of the population with food deprivation in Mexico City was 6.5% lower than the national average. Mexico City ranked 29th among the 32 states in terms of deprivation levels.
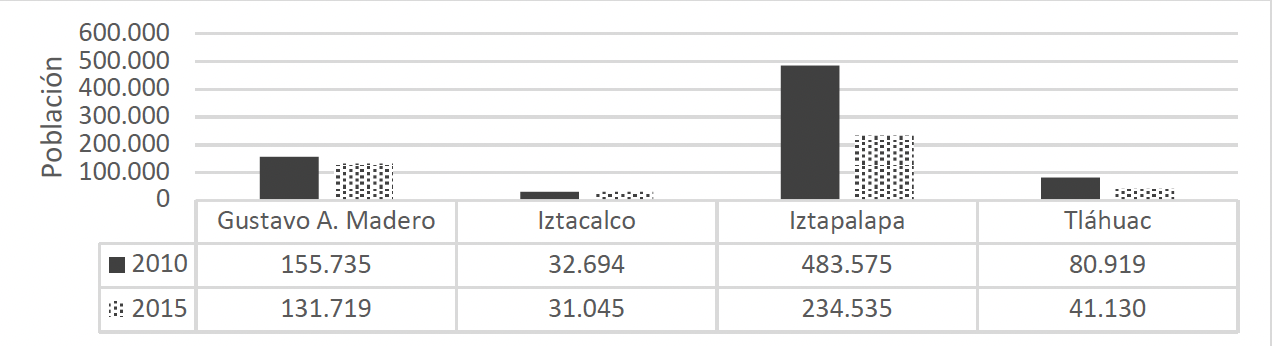
Source: Own elaboration ( CONEVAL, 2014 , 2018 , 2019 , 2020a , 2020b , 2021a , 2021b , 2021c , 2021d ). Note that in 2010 Iztapalapa has 3.1 times more people experiencing food deprivation than Gustavo A. Madero, suggestive of having income to pay for food; in 2015 the same borough has 1.78 times more.
Graph 6 Food deprivation 2010-2015
According to the information in Graph 4 , in the four boroughs, the number of people at risk of food deprivation decreased by 0.1542, 0.0504, 0.5159, and 0.4917 in Gustavo A. Madero, Iztacalco, Iztapalapa and Tláhuac, respectively, the latter two seeing significant decreases. It can be said that Iztacalco showed a greater decrease in poverty, with a difference of 8.8% between 2010 and 2015. On the other hand, Iztapalapa, and Tláhuac are the boroughs with the highest number of people in this condition. It is worth noting that, of these four boroughs in both 2010 and 2015, Iztapalapa is the one with the highest poverty index in the different indicators analyzed. The boroughs with the highest number of people lacking access to food in 2015 were Iztapalapa and Gustavo A. Madero. Graphs for housing variables are presented below ( Graph 7 ).
Source: Own elaboration ( CONEVAL, 2014 , 2018, 2019 , 2020a , 2020b , 2021a, 2021b , 2021c , 2021d ).
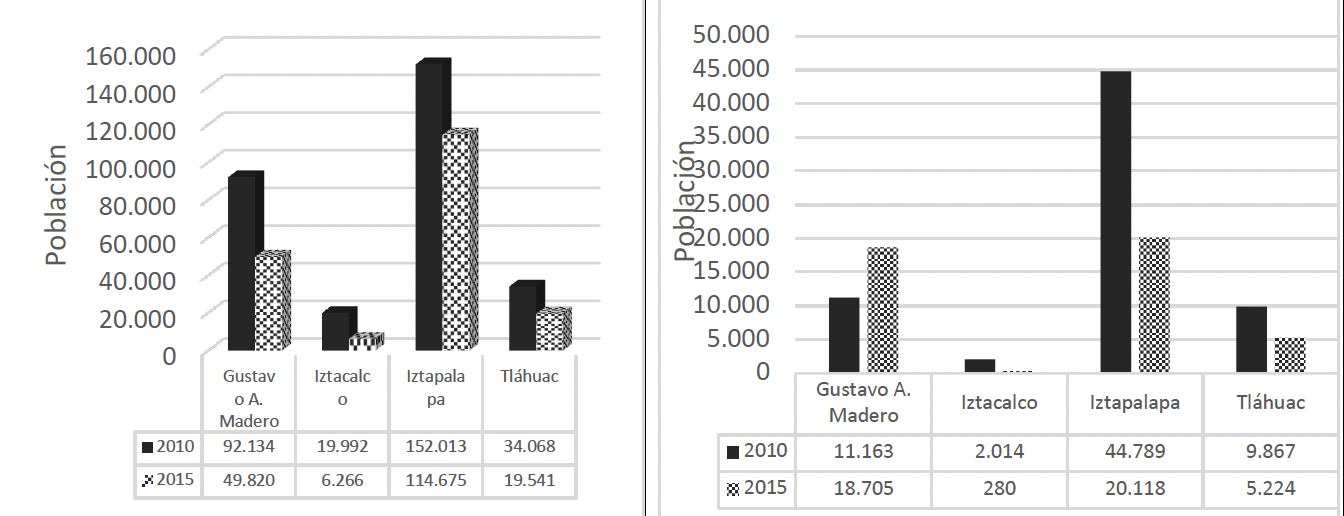
Graph 7 Deprivation due to housing quality and space and basic services 2010-2015
In synthesis and according to the demographic dimension of the year 2015 CONEVAL methodology results, Iztapalapa has 1.164 million inhabitants, of which 28.39% are poor; Iztacalco amounts to 390,340 inhabitants, of which 17.06% are poor; Iztapalapa now has 1.828 million inhabitants, of which 34.96% are poor; and Tláhuac has 361,590 inhabitants, of which 39.16% are poor.
Subsequently, data from the portal of the National Council of Science and Technology ( CONACYT, 2021 ) were used regarding general information of Covid-19 of Mexico City, specifically for the four boroughs ( Table 4 ).
Table 4 General information on Covid19 Mexico City CDMX
| Covid-19 cases | Percentage of total Covid-19 | Total population 2021 | Covid-19 incidence rate | |
| CDMX | 977,533 | |||
| Gustavo A. Madero | 110,776 | 11.33% | 1,176,967 | 9.41% |
| Iztacalco | 39,137 | 4.00% | 393,821 | 9.93% |
| Iztapalapa | 154,207 | 15.77% | 1,815,551 | 8.49% |
| Tláhuac | 50,886 | 5.20% | 366,586 | 13.88% |
Source: Own elaboration (Conacyt, 2021).
Note: The incidence rate was determined as follows: Number of cases / Total populationTo identify if the relationship between the variables of food deprivation and the number of Covid-19 cases, we proceeded to make the association of the variables between multidimensional poverty and Covid-19 cases.
Table 5. Association of variables: multidimensional poverty and Covid-19 cases
| Economic well-being | Food deprivation | Gap in education | Health access | Social security access | Housing quality and spaces | Access to basic housing services | Covid cases | |
|---|---|---|---|---|---|---|---|---|
| Economic well-being | 1.0000 | |||||||
| Food deprivation | 0.9489 | 1.0000 | ||||||
| Gap in education | 0.9490 | 0.9986 | 1.0000 | |||||
| Health access | 0.9235 | 0.9964 | 0.9922 | 1.0000 | ||||
| Social security access | 0.9185 | 0.9945 | 0.9963 | 0.9932 | 1.0000 | |||
| Housing quality and spaces | 0.9115 | 0.9899 | 0.9939 | 0.9870 | 0.9990 | 1.0000 | ||
| Access to basic housing services | 0.9943 | 0.9098 | 0.9108 | 0.8774 | 0.8722 | 0.8649 | 1.0000 | |
| Covid-19 cases | 0.9817 | 0.9916 | 0.9906 | 0.9792 | 0.9756 | 0.9698 | 0.9558 | 1.0000 |
Note: The significance of the relationship between food deprivation and vulnerability to the Covid-19 health crisis was performed using the F-test.
Source: Own elaboration ( CONEVAL, 2014 , 2018 , 2019 , 2020a , 2020b , 2021a , 2021b , 2021c , 2021d ).
Finally, the relationship is strong and positive so it can be said that the greater the food poverty, the greater the vulnerability to Covid-19 ( Tables 5 and 6 ).
Table 6. F-test for two-sample variances
| Food deprivation | Covid cases | |
|---|---|---|
| Median | 109607.25 | 88751.5 |
| Variance | 8985677700 | 2888298594 |
| F | 3.111062589 | |
| P(F<=f) (one-tailed) | 0.188087822 | |
| Critical value for F (one-tailed) | 9.276628153 |
Where: Hi = Food poverty led to increased vulnerability to the Covid-19 crisis.
Source: Own elaboration.
CONCLUSION
The impact of poverty on the economic, political, sociocultural, and environmental setting is multifaceted and multidimensional. When talking about human development, Sen did so base on a vision that focuses not only on the products or goods a person owns; he does not consider only the material, but the model of life people has, how long they live, the type of health they have, education, the human being’s ability to prefer what type of society they want to live in; all these aspects have more weight than income. In terms of the methodology used in Mexico by CONEVAL, these are multidimensions.
Indeed, the monetary factor does not cease to be relevant, as we see that the public policies of the Mexican State, despite the investments and design of social programs that it has implemented at different times, have not been able to reverse the population’s poverty figures, including food poverty. Mexico can produce food, but, among other circumstances, such as the distribution and waste of food for the population, this should be analyzed as there is food insecurity. However, it must be said that according to the global food security index it is ranked within the average. The fight against food insecurity represents a major challenge for the State, as it must design strategies with different stakeholders in society for social and economic recovery. In addition to the problems that the State may have, we must now add the effects of the pandemic that directly impacts the economic inequality among the population and the consequences of the planetary limits such as climate change, loss of biosphere, nitrogen, and phosphorus cycles, among others.
The work finds its main contribution in the identification of the direct and positive relationship that exists between the lack of food and people’s vulnerability to the health crisis; although it is a predictable relationship, the result is interesting since the characterization took place based on historical data from 2010 and 2015, which were related to accumulated information of numbers of Covid-19 cases to November 2021. It was also observed that the Iztapalapa borough, despite having a greater number of poor people and Covid-19 cases in absolute numbers, was not the most vulnerable, but Tláhuac, which had an incidence of 13.88% vs 8.49%., which can be explained by the fact that the correlation found between Covid-19 cases and access to housing services such as drinking water, drainage, electricity, among others, was 0.9556. It should be noted that Tláhuac is a borough located between urban and rural areas.
Inequalities in money, skills, information, access to opportunities and food reflect asymmetries at the local, regional, and global levels.
It should be noted that among the limitations of the study is the lack of up-to-date information from primary sources. This work also finds as a suggestion for analysis the implementation of observatories to measure poverty according to local realities to create strategies to ensure access to food that contributes to nutrition and quality of life of the local population in the first place.

