


 text new page (beta)
 English (pdf)
 Article in xml format
 Article references
 Send this article by e-mail
 Cited by SciELO
  Similars in
SciELO
Similars in
SciELO 
 Permalink
Introduction
Slightly or moderately elevated thyroid stimulating hormone (TSH) and triiodothyronine (T3) values, that is, above the normal range, have been described in patients with obesity. This elevation is currently considered more as a consequence rather than stemming from obesity itself1. In general, it is suggested that the increase in TSH is an adaptive mechanism in obese patients, a response of the hypothalamus-pituitary-thyroid axis to weight gain. Because, if increased TSH levels were the primary event, an increase in serum thyroid hormones would also be expected2.
Various studies have shown that TSH levels are slightly higher in the obese population than in the non-obese population and that weight reduction in this population causes normalization of thyroid hormone levels3,4; in other words, some studies show an effect on thyroid function conditioned by weight loss in obese patients5,6.
Internationally, high concentrations of TSH have been reported in 25% of obese subjects1. The main reported alterations in the thyroid profile of obese patients are increased TSH and T3, with a positive association between TSH levels and body mass index (BMI)7-9, and a negative association between BMI and serum tetraiodothyronine (T4)10.
In Mexico, a prevalence of primary hypothyroidism stands at 8%, subclinical hypothyroidism at 6%, and alterations in the thyroid profile secondary to obesity are estimated to occur in 23% of obese patients11.
TSH elevation in obese patients is mainly assigned to leptin, the adipose-derived hormone. A correlation between TSH and leptin levels has been demonstrated in obese subjects12, and leptin concentrations are higher in obese patients. A slow signaling pathway mediated by the JAK/STAT pathway is known to generate the expression of the thyrotropin-releasing hormone (TRH) gene in the hypothalamic paraventricular nucleus and thus the increased synthesis and secretion of TSH and thyroid hormones13. Circulating leptin levels are correlated with the degree of total adiposity14. In the case of obesity, increased leptin is considered evidence of "leptin resistance." This increase in TSH, and therefore in T3, could be interpreted as a defense mechanism of the body against weight gain. The high conversion rate reported from T4 to T3 in obese patients has also been interpreted as a defense mechanism, capable of counteracting the accumulation of fat due to increased energy expenditure15.
Some other neurotransmitters and hormones that influence weight, such as the Y-neuropeptide and the alpha-melanocyte-stimulating hormone, which are influenced by leptin, also regulate TSH production16. Leptin also affects thyroid deiodinase activity with activation of T4-to-T3 conversion, thus supporting the concept of an inverse relationship between T4 and leptin. An increase in total T3 or free T3 levels in obese patients has been reported as well as an association between progressive fat accumulation with increasing TSH and T3 levels. This finding suggests a high T4 to T3 conversion in patients with central obesity, due to increased deiodinase activity as a compensatory mechanism. Reverse T3 or 3.3',5'-triiodothyronine (T3r) is mainly a product of T4 degradation in peripheral tissues: Liver, kidney, and muscle T3r levels; it is a biologically inactive product of T4 degradation. It is also secreted by the thyroid gland, but under normal physiological conditions, the amounts are practically insignificant. The measurement of T3r concentration in serum reflects both tissue supply and T4 metabolism and identifies conditions that favor this particular T4 degradation pathway17.
Despite high plasma TSH levels, TSH receptors are expressed less in the adipocytes of obese individuals. This reduced expression of the TSH receptor may induce decreased action of thyroid hormone, further increasing plasma concentrations of TSH and T3, which are a condition of peripheral thyroid hormone resistance18.
Despite what has been reported in international literature, the behavior of thyroid hormone levels in obese patients in Mexico is unknown. There was a study carried out at the Mexican Institute of Social Security which comprised 52 morbidly obese patients, conducted at the Obesity Clinic, Department of Endocrinology, by Montoya-Morales et al.; however, no correlation was found between BMI and TSH levels in that study11.
The aim of this study is to determine whether there is an association between thyroid hormone levels and obesity grade, documenting the long-term experience of the Comprehensive Care Clinic for patients with diabetes and obesity.
Material and methods
A retrospective, analytical cross-sectional study was conducted. Medical records of patients referred to the Comprehensive Care Clinic for patients with Diabetes and Obesity at the General Hospital of Mexico "Dr. Eduardo Liceaga" were analyzed between February 2015 and February 2019. The inclusion criteria were patients with any obesity grade classified according to the WHO (Grade 1 being considered those patients with BMI of 30-34.9 kg/m2, Grade 2 with BMI of 35-39.9 kg/m2, and Grade 3 with BMI of ≥ 40 kg/m2). Patients between 18 and 65 years old were included, who initially had their serum thyroid hormone values measured on admission.
Patients diagnosed with type 2 diabetes mellitus, hypothyroidism, or any other thyroid disease and patients that had been prescribed any drug for altered thyroid function (lithium, amiodarone, iodide, carbamazepine, rifampicin, phenobarbital, and glucocorticoids) were excluded from the study.
Measurements of height, weight, BMI, TSH, free T3, total T3, free T4 and total T4, and T3/T4 ratio were obtained. The normal range of TSH was 0.38-4.0 mU/l, free T3 2.39-6.79 mU/l, total T3 0.87-1.78 mU/l, free T4 0.58-1.64 mU/l, and total T4 6.09-12.23 mU/l, taking TPO antibodies greater than 5 IU/ml as a positive cutoff value.
SPSS software version 22 for Windows was used for statistical analysis. Descriptive statistics (proportions, mean, and standard deviation) were used for the analysis of quantitative dependent variables, in this case: Age, weight, height, BMI, and thyroid hormone levels.
Inferential statistics (Spearman's rank correlation coefficient) were performed to establish if there was a correlation between obesity grade and serum TSH, free T3, total T3, free T4, and total T4 levels. Pearson's Chi-squared test was applied to analyze if there was a difference in the prevalence of alterations in the thyroid profile according to the obesity grade. All the hypothesis contrast tests with p < 0.05 were deemed statistically significant.
Results
In total, 186 records were analyzed of patients with a complete thyroid profile at the time of admission to the comprehensive care clinic for patients with diabetes and obesity.
Comparisons of population characteristics show that there is no difference by sex in terms of age, BMI, and thyroid hormone levels. Statistically significant differences in weight and height were found, with these values being higher in men than in women (Table 1). According to the WHO obesity grading, 28 patients (15.1%) were classified as obesity Grade 1 (BMI 30-34.9 kg/m2); 45 patients (24.2%) as obesity Grade 2 (BMI 35-39.9 kg/m2), and 113 patients (60.7%) as obesity Grade 3 (BMI ≥ 40 kg/m2).
Table 1 Population characteristics and serum thyroid hormone levels (mean and standard deviation) according to patient's gender
| Characteristics | Males (n = 41) 22% | Females (n = 145) 78% | Total (186) | p value |
|---|---|---|---|---|
| Patient age (years) | 41.65 ± 10.13 | 44.60 ± 13.28 | 43.95 ± 12.69 | 0.19 |
| Weight on admission to the clinic (kg) | 124.18 ± 30.39 | 105.20 ± 23.96 | 109.38 ± 26.62 | 0.000040 |
| Weight at 1 year's follow-up (kg) | 109.24 ± 29.03 | 96.25 ± 22.31 | 99.12 ± 24.47 | 0.002 |
| Height (m) | 1.66 ± 0.75 | 1.56 ± 0.76 | 1.58 ± 0.08 | < 0.0001 |
| Body mass index on admission to the clinic (BMI) | 44.42 ± 8.68 | 42.94 ± 8.61 | 43.27 ± 8.62 | 0.336 |
| Body mass index (BMI) at 1 year's follow-up | 39.30 ± 9.61 | 39.41 ± 8.68 | 39.38 ± 8.86 | 0.945 |
| TSH levels (mU/L) | 4.17± 2.70 | 4.69 ± 4.77 | 4.57 ± 4.36 | 0.511 |
| Free T3 levels (mU/L) | 3.18 ± 0.63 | 3.13 ± 0.50 | 3.14 ± 0.53 | 0.638 |
| Total T3 levels (mU/L) | 1.28 ± 0.88 | 1.21 ± 0.64 | 1.22 ± 0.69 | 0.608 |
| Free T4 levels (mU/L) | 0.88 ± 0.16 | 0.87 ± 0.16 | 0.87 ± 0.16 | 0.899 |
| Total T4 levels (mU/L) | 8.78 ± 2.03 | 8.55 ± 1.57 | 8.59 ± 1.68 | 0.506 |
| T4/T3 ratio (mU/L) | 8.34 ± 4.42 | 7.62 ± 2.26 | 7.77 ± 2.82 | 0.229 |
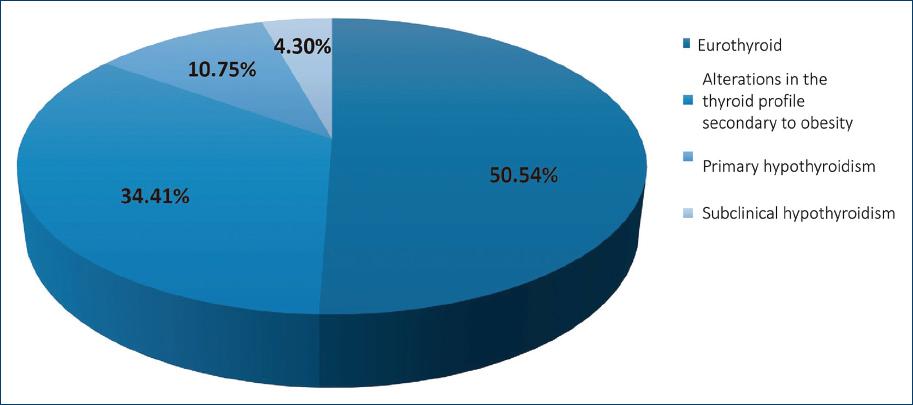
The diagnosis of primary hypothyroidism was shown in 20 patients (10.75%); 64 patients (34.41%) presented alterations in the thyroid profile secondary to obesity: Eight patients (4.30%) presented with subclinical hypothyroidism and 94 patients (50.54%) were reported as euthyroid (Fig. 1).
With regard to patients diagnosed with subclinical hypothyroidism, primary hypothyroidism, and alterations in the thyroid profile secondary to obesity, 80.4% were women and 19.6% were men, while the percentage of women in whom any of these diagnoses were made was 51% and in men 43.9% (Fig. 2).
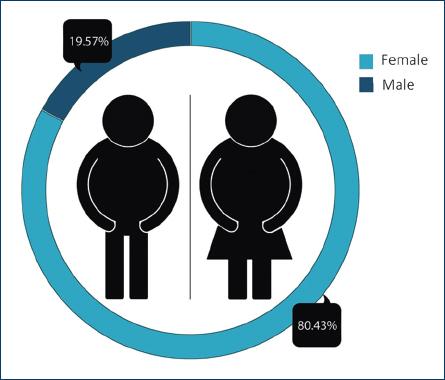
Figure 2 Percentage of patients diagnosed with subclinical hypothyroidism, primary hypothyroidism, and alterations in the thyroid profile secondary to obesity, grouped according to gender.
When the levels of thyroid hormones were compared in the three groups of subjects categorized according to BMI, only a statistically significant difference was found in free T4 levels. These values were higher in patients with obesity Grade 3 (Table 2).
Table 2 Serum thyroid hormone levels (mean and standard deviation) according to patients' body mass index
| Thyroid hormones | Obesity Grade 1 (n = 28) | Obesity Grade 2 (n = 45) | Obesity Grade 3 (n = 113) | p value |
|---|---|---|---|---|
| TSH (mU/L) | 5.64 ± 5.25 | 5.14 ± 6.93 | 4.08 ± 2.41 | 0.15 |
| Free T3 (mU/L) | 3.16 ± 0.48 | 3.11 ± 0.63 | 3.15 ± 0.50 | 0.93 |
| Total T3 (mU/L) | 1.13 ± 0.17 | 1.15 ± 0.24 | 1.26 ± 0.84 | 0.62 |
| Free T4 (mU/L) | 0.90 ± 0.16 | 0.85 ± 0.16 | 0.80 ± 0.13 | 0.003 |
| Total T4 (mU/L)l | 8.76 ± 1.83 | 8.35 ± 1.25 | 8.27 ± 1.32 | 0.28 |
| T4/T3 ratio (mU/L) | 7.46 ± 1.47 | 7.36 ± 1.72 | 7.97 ± 3.29 | 0.51 |
When doing the correlation analysis, a positive correlation was found between TSH levels and weight (r = 0.19; p = 0.007); as well as a correlation between TSH levels and obesity grade (r = 0.13; p = 0.049). As for free T4 and total T4 levels, a negative correlation was found with the obesity grade, at (r = −0.26; p = 0.000275) and (r = 0.18; p = 0.029), respectively. Although an increase in the mean values of free T3, total T3, and T4/T3 ratio was observed in the analysis of the descriptive variables, as the obesity grade increased, no correlation with the obesity grade was found while doing the statistical analysis.
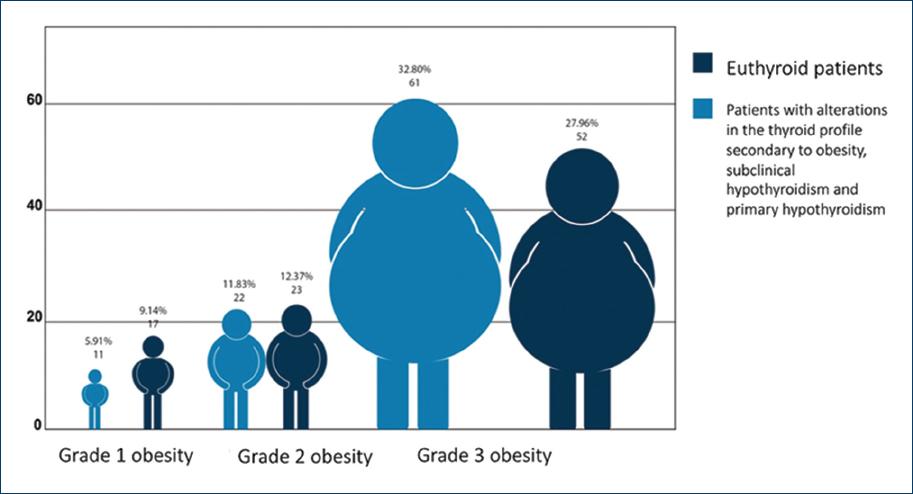
The percentage of patients diagnosed with alterations in the thyroid profile secondary to obesity, subclinical hypothyroidism, and primary hypothyroidism according to the obesity grade was 18.5% for patients with Grade 1 obesity, 25% for patients with Grade 2 obesity, and 56.5% for patients with Grade 3 obesity. However, when Pearson's Chi-squared test was applied, no significant difference was found between the three groups (p = 0.367) (Fig. 3).
Discussion
In this study, 50.55% of patients reported euthyroidism; a prevalence of primary hypothyroidism was estimated at 10.75% and 4.30% for subclinical hypothyroidism. About 34.40% of patients presented alterations in the thyroid profile secondary to obesity, which is similar to a study carried out in Mexico at the Mexican Institute of Social Security in 52 patients with morbid obesity. The study was conducted at the obesity clinic of the Endocrinology Department by Montoya-Morales et al.11 estimating a prevalence of primary hypothyroidism at 8%, subclinical hypothyroidism at 6%, and 23% of patients presented thyroid function alterations secondary to obesity (characterized by elevated TSH and/or elevated total or free T3 and free T4 with normal antithyroid antibodies). These data are very similar to those reported in the international literature where elevated TSH concentrations have been reported in 25% of obese patients1. This increase in prevalence is probably related to some other factors involved in TSH elevation. These include circadian rhythm, age, and some markers of insulin resistance19,20.
Regarding the prevalence of subclinical hypothyroidism in our study, a prevalence of 4.3% was estimated, which is similar to what is reported in the international literature, which ranges between 4 and 10% depending on the gender, age, and population studied21,22. This ranges between 10.5% and 25% in patients with obesity, while Kitahara et al. reported a prevalence of 10.5% for patients with BMI between 30 and 67 kg/m223.
As for the behavior of thyroid hormone levels, a positive correlation was found between TSH and weight levels (r = 0.19; p = 0.007). Regarding obesity grade (r = 0.13; p = 0.049), a negative correlation between obesity grade and free T4 (r = −0.26; p = 0.000275) and total T4 levels (r = −0.18; p = 0. 029), which resonates with other studies mentioned in the international literature. These studies report main alterations in patients with obesity such as an increase in TSH and T3, there being a positive association between TSH levels and body mass index (BMI)7,8, as well as a negative association between body mass index and serum tetraiodothyronine (T4)10.
These correlation ratios are very similar to those cited in a Nigerian study of 76 obese children and adolescents versus non-obese control patients, where serum TSH, T3, and T4 levels were measured. BMI (p < 0.001), T3 (p < 0.01), TSH (p < 0.001), and T3/T4 ratio (p < 0.001) were significantly higher in obese children and adolescents than non-obese children and adolescents. BMI was positively correlated with triiodothyronine levels (r = 0.230; p < 0.05), TSH (r = 0.272; p < 0.02), and T3/T4 ratio (r = 0.232; p < 0.05)9.
In our study, while doing the analysis of free T3, total T3 levels, and T4/T3 ratio, although an increase in T3 values was observed in the analysis of the descriptive variables, as the obesity grade increased, no correlation was found (r = 0.04; p = 0.616) in the statistical analysis. We consider that the lack of correspondence for the determination of the total concentration of thyroid hormones was a limitation of the study, as it was a retrospective study; and that the increase in T3 is dependent on T3r, being considered biologically inactive at a cellular level and without a mechanism of action in obese patients17.
In another study carried out in Caucasian women with obesity, thyroid function was assessed and its possible relationship with body mass index (BMI), leptin, adiponectin, and insulin sensitivity. Obese women with BMI > 40 kg/m2 were found to have higher serum TSH levels than those with a BMI < 40 kg/m2 (p < 0.01). TSH was correlated with BMI (r = 0.44, p = 0.01), leptin (r = 0.41, p = 0.01), leptin/BMI ratio (r = 0.33, p = 0.03), body surface area (r = 0.26, p = 0.05), HOMA-IR (r = 0.245, p = 0.05), and inversely with adiponectin (r = −0.25, p= 0.05)12.
Although correlation ratios were low in our study, it has been reported that morbid obesity (BMI > or = 40 kg/m2) is associated with alterations in thyroid function, with subclinical hypothyroidism being the most reported alteration24. This resonates with what was observed in our study, since the percentage of patients with alterations in the thyroid profile secondary to obesity, subclinical hypothyroidism, and primary hypothyroidism was up to 56.5% for patients with obesity Grade 3 (BMI > or = 40 kg/m2).
Regarding the evidence of thyroid autoimmunity in obese patients, the Third National Health and Nutrition Examination Survey (NHANES III) showed that thyroid antibodies do not differ in morbidly obese patients and in the general population25, which is very similar to the findings in our study, where the evidence of antibodies in 4.3% of patients was corroborated. The lack of evidence of autoimmunity in this group of patients is in accordance with the explanation that the increase in TSH and T3 levels is a response mechanism against weight gain. This leads to counteracting the accumulation of fat by increasing energy expenditure15, coupled with a condition of peripheral thyroid hormone resistance, because TSH receptors are expressed less in the adipocytes of obese individuals18.
Some studies have already begun to analyze population-adjusted cutoff values specifically in patients with obesity. In a representative study of the adult population in Spain that included 3928 patients without thyroid disease, with negative or normal antithyroid antibodies, measurements of free TSH, T3, and T4 levels were made. The reference range for TSH was adjusted as follows: In the overweight category (BMI 25-29.9 kg/m2); 0.5-5.9 mIU/mL in the obesity category (BMI 30-39.9 kg/m2); and 0.7-7.5 mIU/mL in the morbid obesity category (BMI greater than 40 kg/m2)26.
In our study, average TSH levels according to obesity grade were 1.28-5.64 ± 5.25 mU/l for Grade 1 obesity (BMI 30-34.9 kg/m2); 0.29-5.14 ± 6.93 mU/l for Grade 2 obesity (BMI 35-39.9 kg/m2), and 0.68-4.08 ± 2.41 mU/l for Grade 3 obesity (BMI of ≥ 40 kg/m2).
Conclusions
Our conclusion, according to our findings, is that the grade of obesity is associated with alterations in thyroid function that can affect the normal range of thyroid hormone levels. Alterations present in thyroid hormone levels and the actual diagnosis of thyroid disease in obese patients can pose an actual challenge. The values taken as a reference in the non-obese population and applied to the obese population can probably lead to an inadequate diagnosis, especially in the diagnosis of subclinical hypothyroidism and primary hypothyroidism. Thus, TSH levels should probably not be the only parameter to be considered when diagnosing hypothyroidism in obese patients. The absence or evidence of autoimmunity, together with the measurement and analysis of the whole thyroid profile, is also parameters to consider.

