




Services on Demand
Journal
Article
 text in
 English (pdf)
 Article in xml format
 Article references

 Automatic translation
 Send this article by e-mail
Indicators
-
 Cited by SciELO
-
 Access statistics
Related links
-
 Similars in
SciELO
Share

 Permalink

Abanico veterinario
On-line version ISSN 2448-6132Print version ISSN 2007-428X
Abanico vet vol.17 Tepic Jan./Dec. 2026 Epub July 10, 2026
https://doi.org/10.21929/abavet2026.8
Original articles
Epidemiological behavior of bovine paralytic rabies in Mexico: Study period 2017-2023
1
 http://orcid.org/0000-0002-0756-3514
*
1
http://orcid.org/0000-0002-6154-9983
2
http://orcid.org/0000-0003-0306-3560
1
http://orcid.org/0000-0001-9542-8242
1Universidad Autónoma del Estado de Hidalgo, Instituto de Ciencias Agropecuarias, Área Académica de Medicina Veterinaria y Zootecnia. Hidalgo, México.
2 Universidad Autónoma del Estado de México, Facultad de Medicina Veterinaria y Zootecnia. Estado de México. México.
The aim of this study was to determine the epidemiological behavior of bovine paralytic rabies (BPR) in Mexico during the period 2017-2023. Case information was obtained through the National Epidemiological Surveillance System (SIVE, according it’s acronyms in Spanish), from which the prevalence rate at the state level was estimated at the state level and clusters were identified using the SaTScan statistic. Temporal behavior was evaluated using endemic channels and a Seasonal Integrated Moving Average Autoregressive Model developed in the Python environment. During the study period, 2 791 cases of BPR were reported, the states with the highest prevalence rates were Nayarit (47.61), Quintana Roo (32.62), and Campeche (31.24). Spatial scanning detected three significant clusters; the one located in Nayarit had 13 times higher risk of presenting BPR cases. Temporally, a seasonal pattern was observed with endemic peaks in February and October. The SARIMA (2.1.0) (2.1.0)12 model forecasted 320 cases for 2024. BPR in Mexico shows variations across northern, central, and southern regions. Nayarit was the state with the highest prevalence and relative risk. This information could be used to strengthen prevention and control strategies in high-risk periods and areas.
Keywords: spatial distribution; prevalence; prediction
El objetivo del presente estudio fue analizar el comportamiento epidemiológico de la rabia paralítica bovina (RPB) en México durante el periodo 2017-2023. La información de los casos se obtuvo a través del Sistema Nacional de Vigilancia Epidemiológica (SIVE), a partir de los cuales se estimó la tasa de prevalencia a nivel estatal e identificaron clústers a través del estadístico SaTScan. El comportamiento temporal se evaluó por medio de canales endémicos y un Modelo Autorregresivo Integrado de Media Móvil Estacional desarrollado en el entorno Python. Durante el periodo de estudio se reportaron 2,791 casos de RPB, los estados con mayores tasas de prevalencia fueron Nayarit (47.61), Quintana Roo (32.62) y Campeche (31.24). El escaneo espacial detectó 3 clústers significativos; el localizado en Nayarit tiene 13 veces más riesgo de presentar casos de RPB. Temporalmente se observó un patrón estacional con picos endémicos en febrero y octubre. El modelo SARIMA (2,1,0) (2,1,0)12 pronosticó 320 casos para 2024. La RPB en México se presenta con variaciones en las regiones norte, centro y sur. Nayarit fue la entidad con mayor prevalencia y riesgo relativo. Esta información podría servir para reforzar las estrategias de prevención y control en periodos y áreas de alto riesgo.
Palabras clave: distribución espacial; prevalencia; predicción
INTRODUCTION
Bovine paralytic rabies (BPR), also known as derriengue, is an infectious‑contagious viral disease that affects the central nervous system of livestock, mainly cattle and horses, and to a lesser extent goats and sheep (Margineda et al., 2021; Brown & Escobar, 2023). The etiological agent is a neurotropic virus of the genus Lyssavirus, family Rhabdoviridae, transmitted through the bite of infected animals or by direct contact of contaminated saliva with wounds and mucous membranes (Leung et al., 2007; Brunker & Mollentze, 2018; Kavoosian et al., 2023).
The main reservoir and transmitter of the rabies virus to livestock is the hematophagous bat of the genus Desmodus rotundus. This species is distributed in tropical and subtropical regions of Latin America, from Mexico to southern and central Chile and northern Argentina (Zarza et al., 2017). In Mexico, it is found in areas below 2 300 m above sea level and above 10 °C; however, factors such as climate change and land‑use changes have led to modifications in the distribution of this reservoir (Silva et al., 2019; Bárcenas-Reyes et al., 2019).
It is estimated that up to 500 000 animals die annually from BPR in Latin America (Mello et al., 2019), while in Mexico, between 90 000 and 100 000 animal deaths have historically been reported (Anderson et al., 2012). The most common clinical presentation in cattle is the paralytic form, characterized by hypersalivation, incoordination, ascending paralysis, and death, with a lethality rate close to 100 % (Khairullah et al., 2023). The disease represents not only a health risk but also an economic one, due to the high losses for the dairy and meat industries, which amount to more than 2.6 million US dollars per year in Mexico (Sanchez-Gomez et al., 2022).
In Mexico, the disease is geographically restricted. According to the national campaign for the prevention and control of rabies in cattle and livestock species, an endemic zone is recognized, comprising 26 federal entities, extending from southern Sonora to Chiapas and from southern Tamaulipas to Yucatán Peninsula. In this region, sanitary activities are carried out based on rabies vaccination of susceptible livestock and bat population control, in order to reduce the health and economic impact of the disease (SENASICA, 2014; SENASICA, 2022). Due to the above, the objective of this study was to determine the epidemiological behavior of bovine paralytic rabies in Mexico during the period from 2017 to 2023.
MATERIAL AND METHODS
Study area and data source
The study was conducted for the 32 federal entities that comprise the Mexican Republic. Positive cases of bovine paralytic rabies (BPR) in Mexico recorded during the period 2017‑2023 were analyzed from the epidemiological bulletins of the National Epidemiological Surveillance System (SIVE), issued by the National Service for Health, Safety and Agri‑Food Quality (SENASICA, 2025). The database included only cases in cattle, place of occurrence, and date of presentation; for the endemic channel, data were reported by month, and for spatial analysis, by year.
The bovine population per federal entity was consulted from the Agri‑Food and Fisheries Information Service (SIAP, 2024), while geographic coordinates in the latitude‑longitude projection system were obtained from the National Institute of Statistics, Geography and Informatics (INEGI, 2024).
Type of study
With the collected information, a retrospective cross‑sectional epidemiological study was carried out, considering time and space variables.
Determination of the spatial behavior of BPR
Prevalence
The BPR prevalence rate for each federal entity was calculated using the following mathematical formula.
Based on the information obtained, a graduated color map was constructed using a quantile classification in ArcMap software version 10.8 (Yescas-Benítez et al., 2020).
Spatial analysis
To identify BPR clusters, the spatial statistic software SaTScan version 10.1.3 was used, following the methodology described by Zaragoza-Bastida et al. (2012). A retrospective space‑time analysis was performed based on the Poisson probability model with a scanning window of 25 % and a minimum of 2 cases per cluster; the temporal unit was set to years. For each window, the log‑likelihood ratio (LLR) was calculated; the cluster with the highest value was considered the most likely. Statistical significance was assessed through 999 Monte Carlo replicates with a 5 % significance level; clusters with a p‑value ≤ 0.05 were considered significant. For the geographic representation of the identified clusters, ArcMap software version 10.8 was used.
Determination of the temporal behavior of BPR Endemic channel
Using information on cases per epidemiological week, endemic channels were constructed using the quartile method for the Mexican Republic and for each identified cluster. These were created in Microsoft Excel (Bortman,1999).
SARIMA model
A Seasonal Autoregressive Integrated Moving Average (SARIMA) model was performed to forecast BPR cases in Mexico. The Box‑Jenkins methodology was employed in the Python 3.12 programming environment.
The stationarity of the series was evaluated using the augmented Dickey‑Fuller (ADF) test; a p‑value < 0.05 rejects the null hypothesis of a unit root. The order of differencing (d) was determined according to the number of differencing operations required to achieve stationarity, while the autoregressive (AR) and moving average (MA) orders for the seasonal and non‑seasonal components were identified through analysis of the autocorrelation function (ACF) and partial autocorrelation function (PACF) plots (Liu et al., 2023).
The best model was selected according to the lowest Akaike Information Criterion (AIC) value. Subsequently, residual diagnostics were performed using the Ljung‑Box statistical test, where p‑values > 0.05 indicate independence among residuals (Duangchaemkarn et al., 2022).
The data were split into a training set (2017 to 2022) and a test set (2023). The accuracy of the model was evaluated on the test set using the mean absolute percentage error (MAPE), according to the following scale: <10 % accurate forecast, 10‑20 % good forecast, 20‑50 % reasonable forecast, and >50 % inaccurate forecast (Daungchaemkarn et al., 2022). Once the model was validated, forecasts were generated for 2024.
RESULTS
Descriptive analysis
During the period from 2017 to 2023, 2 791 cases of bovine paralytic rabies (BPR) were recorded in Mexico. The year with the lowest number of reported cases was 2020 with 290, while 2023 presented the highest number of cases with 507. The remaining years remained within a range of approximately 320 to 450 cases.
The states with the highest number of recorded cases were Veracruz with 504 cases (18.05 %), Chiapas with 339 cases (12.14 %), and Nayarit with 322 cases (11.53 %). The states where no cases of the disease occurred were Aguascalientes, Coahuila, Mexico City, and Durango.
Prevalence rate
When calculating the prevalence rate per 100,000 cattle, the states with the most cases were Nayarit (47.61), Quintana Roo (32.62), and Campeche (31.24). To a lesser extent were Hidalgo (23.75), Yucatán (22.94), Puebla (21.49), Tabasco (17.81), and San Luis Potosí (17.22). The remaining states presented fewer than 13 cases per 100 000 cattle (Figure 1).
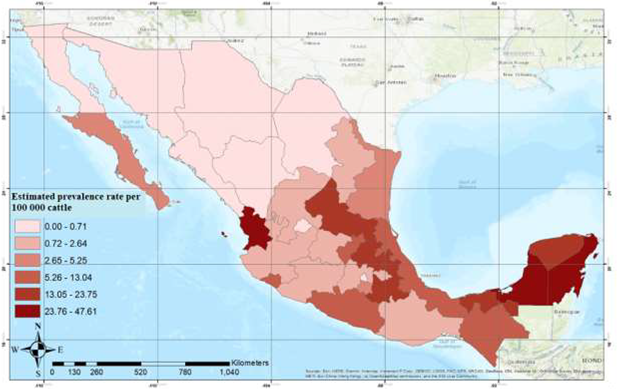
Figure 1 Prevalence rate of bovine paralytic rabies (BPR) in Mexico during the period from 2017 to 2023
Spatial analysis
Regarding the spatial distribution of bovine paralytic rabies (BPR) in Mexico, one primary cluster and two secondary clusters were identified (Figure 2). The primary cluster was located in the southern region, comprising the states of Campeche, Yucatán, Tabasco, Quintana Roo, and Chiapas. During the period from 2021 to 2023, 620 cases were observed compared to 200 expected, with a relative risk (RR) of 3.68. The second cluster was identified in the state of Nayarit during the period 2017 to 2018. In this region, around 16 cases were expected; however, 192 cases were observed, corresponding to an RR of 12.78.
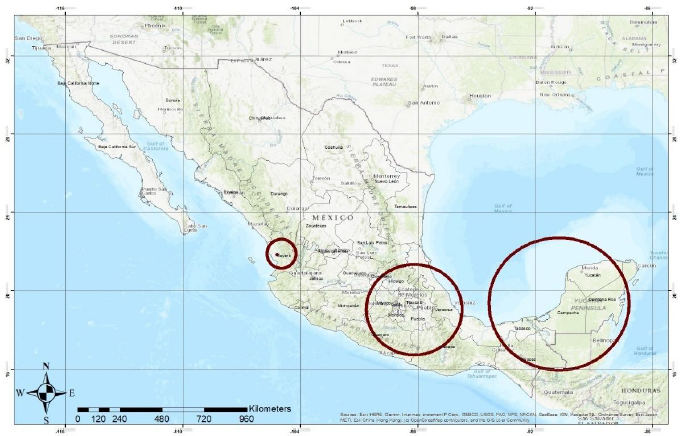
The third cluster was located in the south‑central region of the country, in the states of Puebla, Tlaxcala, Morelos, México, Hidalgo, Veracruz, and Guerrero. Its RR was 1.95, with 505 cases between 2019 and 2021. Although the southeastern cluster had the highest number of cases, the cluster in Nayarit had a 13‑fold higher risk of occurrence. Detailed information on the identified clusters is presented in Table 1.
Table 1 Spatial and temporal description of BPR clusters in Mexico during the period from 2017 to 2023
| Cluster | Coordinates | Radius (km) | Year | Obs | Esp | RR | LLR | P |
|---|---|---|---|---|---|---|---|---|
| 1 | 19.331944 N, -90.795000 W | 374.73 | 2021-2023 | 620 | 200.92 | 3.68 | 315.43 | 0.00000001 |
| 2 | 21.843611 N, -105.204167 W | 0 | 2017-2018 | 192 | 16.05 | 12.78 | 306.29 | 0.00000001 |
| 3 | 19.040000 N, -98.191944 W | 256.65 | 2019-2021 | 505 | 283.64 | 1.95 | 80.02 | 0.00000001 |
Obs: Number of observed cases. Esp: Number of expected cases. RR: Relative risk. LLR: Log‑likelihood ratio
Endemic channel
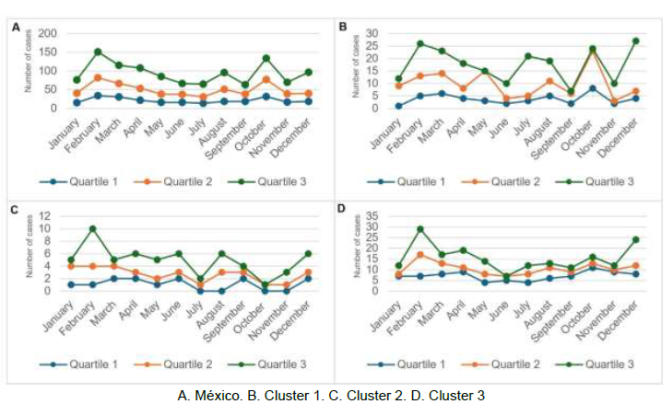
Through the general endemic channel and according to the second quartile, an increase in cases was observed during February, followed by a gradual decrease; however, a second endemic peak was reached in October (Figure 3A).Regarding the cluster analysis, differences were observed among them. In the southeast (Cluster 1), the number of cases increased considerably in May and October (Figure 3B). In contrast, in Nayarit (Cluster 2), the increase in cases was observed from January to March of each year analyzed (Figure 3C). As shown in Figure 3D, only one endemic peak was observed in February for the central cluster.
SARIMA model
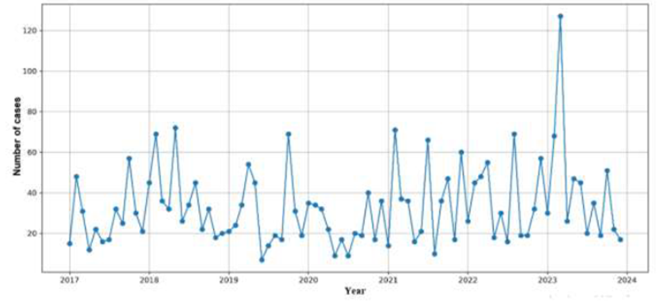
In the time series analysis, variations in the occurrence of BPR cases were observed, with a slight upward trend and significant increases in some periods, such as March 2023 with 127 cases. A seasonal pattern was also observed, mainly in February (Figure 4).
A logarithmic transformation was applied to stabilize the series, and seasonal differencing was considered. The ADF test yielded a value of -8.62 and a p‑value < 0.05.
The analysis of the ACF and PACF plots suggested a first‑order AR and MA component; however, multiple combinations were tested to find an appropriate SARIMA model. For BPR cases in Mexico, the SARIMA (2.1.0)(2.1.0)₁₂ model was selected, with an AIC of 72.68. After fitting, the model components were found to be statistically significant (Table 2).
Table 2 Parameter estimation of the best SARIMA model
| Model | Parameter | Coefficient | Standard error | z | p |
|---|---|---|---|---|---|
| ar.L1 | -1.0402 | 0.198 | -5.257 | 0.000 | |
| SARIMA (2.1.0) | ar.L2 | -0.6085 | 0.197 | -3.066 | 0.002 |
| (2.1.0)12 | ar.S.L12 | -0.6059 | 0.174 | -3.475 | 0.001 |
| ar.S.L24 | -0.4081 | 0.164 | -2.494 | 0.013 | |
| sigma2 | -0.3913 | 0.108 | 3.621 | 0.000 |
The Ljung‑Box test (p = 0.27) indicated the absence of autocorrelation among the residuals (white noise), and the Jarque‑Bera test (p = 0.95) showed that the residuals followed an approximately normal distribution. The MAPE for the test set was 43.65 %.
For 2024, the model forecasted approximately 320 cases of the disease, which represents a significant reduction in cases compared to the previous year. According to the forecasts, the highest number of cases is expected to occur in February (Table 3).
Table 3 Forecast of BPR cases in Mexico for 2024
| Date | Forecasts | Lower limit 95 % | Upper limit 95 % |
|---|---|---|---|
| 01-01-2024 | 27 | 7.73 | 92.20 |
| 01-02-2024 | 42 | 12.78 | 146.13 |
| 01-03-2024 | 36 | 9.09 | 127.03 |
| 01-04-2024 | 36 | 7.90 | 164.42 |
| 01-05-2024 | 15 | 2.69 | 69.28 |
| 01-06-2024 | 22 | 3.66 | 107.92 |
| 01-07-2024 | 27 | 4.52 | 151.13 |
| 01-08-2024 | 17 | 2.25 | 94.85 |
| 01-09-2024 | 20 | 2.54 | 122.28 |
| 01-10-2024 | 30 | 3.96 | 192.16 |
| 01-11-2024 | 16 | 1.55 | 107.92 |
| 01-12-2024 | 32 | 3.74 | 229.98 |
DISCUSSION
BPR in Mexico has a wide geographical distribution, with a higher occurrence of cases in the south of the country, which could be explained by favorable climatic conditions for the distribution of D. rotundus (Maldonado-Arias et al., 2024). This spatial pattern coincides with that described by Ortega-Sánchez et al. (2024), who identified that the highest number of disease cases occurred in four regions: the south, La Huasteca, Nayarit, and the Yucatán Peninsula. The authors suggest that this behavior is driven by favorable climatic conditions for the presence and survival of the main reservoir, D. rotundus, in addition to being associated with high livestock density.
At the state level, Nayarit had the highest prevalence rate, and in the spatial analysis, the cluster comprising this entity showed the highest relative risk. The environmental and topographical conditions of the state could favor the presence of the reservoir and facilitate disease transmission (Lanzagorta-Valencia et al., 2020).
In previous studies, through risk estimation maps, the states with the highest probability of presenting cases were Oaxaca, Guerrero, and Nayarit. Furthermore, it was noted that topographical factors such as mines, tunnels, and bridges may increase the risk of case occurrence in different regions, including Nayarit, since these sites can serve as shelters for D. rotundus colonies, thereby increasing the likelihood of interaction with livestock (Rocha et al., 2019, Ortega-Sánchez et al., 2024).
Similarly, it has been reported that in Nayarit, demographic factors represent a high risk of disease transmission, since a large part of the territory is dedicated to agricultural and livestock activities, including grazing, which increases food availability for the reservoir (Gutiérrez-Plasencia et al., 2022; Ortega-Sánchez et al., 2024).
As part of the results of the present study, BPR cases were identified in the states of Baja California Sur, Baja California, and Tlaxcala, states that have historically been considered disease‑free due to the absence of the reservoir (SENASICA, 2014; SENASICA, 2022). Recent studies suggest that climate change, together with the ecological plasticity of the reservoir in the face of anthropogenic activities, could favor its expansion into new geographical areas.
Using predictive models, it has been estimated that under climate change scenarios, the reservoir could expand northward into Mexico and even reach southern Texas, regions that have acted as ecological barriers to its establishment. Likewise, it has been noted that the distribution of D. rotundus is strongly associated with climatic variables, particularly temperature, since variations in this factor can influence disease transmission dynamics (Zarza et al., 2017; Hayes & Piaggio, 2018).
Regarding the expansion of the reservoir associated with anthropogenic activities, it has been reported that colonization of new regions is related to deforestation, urbanization, and livestock intensification (Brown & Escobar, 2023). For their part, Margineda et al. (2021) indicate that the mobilization of animals from endemic areas to rabies‑free areas may constitute a disease dissemination mechanism. Similarly, Ramírez-Romero et al. (2014) indicate that the risk associated with livestock movement from endemic areas has been underestimated, since it not only represents a problem for livestock production but also a risk to human health.
In addition to the spatial and ecological factors influencing disease distribution, it is important to consider its temporal behavior. According to the national‑level analysis, an increase in the number of cases was identified during the months of February and October. Likewise, the cluster analysis showed that in the central region the increase in cases occurred in February, while in Nayarit it occurred mainly during the first months of the year (January to March).
In a study carried out in Mexico during the period 2007‑2015, Zarza et al. (2017) reported an increase in cases during March and May. Similarly, Ortega-Sánchez et al. (2022) indicated that during the period 2010 to 2019, BPR cases increased mainly between January and March. Both studies coincide in identifying March as a period of higher case occurrence; however, these results differ from those observed in the present study.
Regarding the temporal behavior by region, Bárcenas-Reyes et al. (2015) reported that in central Mexico during the period 2001 to 2013, the disease presented an endemic peak in February; this information coincides with that described in the present investigation. In contrast, a study carried out in Nayarit during 2017 determined that the increase in cases occurred during summer and autumn, which differs from the results obtained for the cluster corresponding to this entity (Gutiérrez-Plasencia et al., 2022).
The temporal variability in case presentation could be associated with different ecological and management factors that influence reservoir dynamics. Among these, climatic conditions, particularly precipitation, can affect the behavior of D. rotundus. It has been observed that during the rainy season, a lower number of cases are recorded compared to the drier months (January to May), because rain hinders flight and foraging activity of bats (Brito-Hoyos et al., 2013).
Likewise, the reproductive behavior of the bat may also influence disease dynamics. Although D. rotundus has an asynchronous polyestrous reproductive pattern, some studies have reported birth peaks during the rainy season, as well as lactation periods between August and November. During these stages, the colonies' food demand increases, which may favor greater foraging activity and consequently increase the risk of contact with livestock (Bárcenas-Reyes et al., 2015; Souza et al., 2018).
Additionally, livestock management practices may also influence the occurrence of hematophagous bat attacks. In some production systems, livestock remain confined or have reduced mobility during certain periods of the year due to forage scarcity, which facilitates food access for D. rotundus. This situation could coincide with some of the months in which an increase in cases was recorded in the present study. It has been documented that bats prefer to feed on animals that remain inactive and stationary during the night and may repeatedly return to the same host over several nights (Johnson et al., 2014).
In this context, time series analysis allowed the identification of a seasonal pattern in case occurrence, with increases during February. Similar results were reported by Ortega-Sánchez et al. (2022), who identified seasonality in the first months of the year (January to March); however, it is important to consider that the observed variations in disease seasonality could be influenced by underreporting of cases. It has been estimated that for each reported BPR case, up to ten cases may go unreported (Bárcenas-Reyes et al., 2015).
The forecast results show consistency with the data observed in 2024. The SARIMA (2.1.0)(2.1.0)₁₂ model forecast a total of 320 BPR cases for 2024, and according to official data, 343 cases were recorded during that year (SENASICA, 2025). This type of model has proven useful for analyzing and predicting the behavior of diseases of public health importance such as tuberculosis and COVID‑19 (Mao et al., 2018; Duangchaemkarn et al., 2022). However, it is important to consider that this type of model only considers historical data and does not include variables that could influence disease occurrence, such as environmental factors, climatic conditions, or sanitary interventions.
CONCLUSION
The states with the highest prevalence rate of BPR were Nayarit and Quintana Roo, with more than 32 cases per 100,000 cattle. BPR occurs throughout the year in the Mexican Republic, with marked seasonality in February and October, as well as temporal variations in the northern, central, and southern regions of the country. Three BPR clusters were identified in Mexico; however, the cluster located in Nayarit had 13 times higher risk of BPR cases occurrence. The information reported in this study could be useful to reinforce prevention and control measures in high‑risk periods and areas.
REFERENCIAS
ANDERSON A, Shwiff S, Gebhardt K, Ramírez AJ, Shwiff S, Kohler D, Lecuona L. 2014. Economic Evaluation of Vampire Bat (Desmodus rotundus). Rabies Prevention in México. Transboundary and Emerging Diseases. 61(2):140-146. ISSN:1865-1674. https://doi.org/10.1111/tbed.12007 [ Links ]
BÁRCENAS-REYES I, Loza-Rubio E, Zendejas-Martínez H, Luna-Soria H, Cantó-Alarcón GJ, Milián-Suazo F. 2015. Comportamiento epidemiológico de la rabia paralítica bovina en la región central de México, 2001-2013. Revista Panamericana de Salud Pública. 38(5):396-402. ISSN:1020-4989. https://www.scielosp.org/pdf/rpsp/2015.v38n5/396-402/es [ Links ]
BÁRCENAS-REYES I, Nieves-Martínez DP, Cuador-Gil JQ, Loza-Rubio E, González-Ruíz S, Cantó-Alarcón GJ, Milian-Suazo F. 2019. Spatiotemporal analysis of rabies in cattle in central Mexico. Geospatial Health. 14(2). ISSN:1827-1987. https://doi.org/10.4081/gh.2019.805 [ Links ]
BORTMAN M. 1999. Elaboración de corredores o canales endémicos mediante planillas de cálculo. Revista Panamericana de Salud Pública. 5:1-8. ISSN:1020-4989. https://www.scielosp.org/article/ssm/content/raw/?resource_ssm_path=/media/assets/rp sp/v5n1/5n1a1.pdf [ Links ]
BRITO-HOYOS DM, Sierra EB, Álvarez RV. 2013. Distribución geográfica del riesgo de rabia de origen silvestre y evaluación de los factores asociados con su incidencia en Colombia, 1982-2010. Revista Panamericana de Salud Pública. 33:08-14. ISSN:1020-4989. https://www.scielosp.org/pdf/rpsp/2013.v33n1/08-14/es [ Links ]
BROWN N, Escobar LE. 2023. A review of the diet of the common vampire bat (Desmodus rotundus) in the context of anthropogenic change. Mammalian Biology. 1-21. ISSN:1616-5047. https://doi.org/10.1007/s42991-023-00358-3 [ Links ]
BRUNKER K, Mollentze N. 2018. Rabies Virus. Trends Microbiology. 26(10):886-887. ISSN:0966-842x. https://doi.org/10.1016/j.tim.2018.07.001 [ Links ]
DUANGCHAEMKARN K, Boonchieng W, Wiwatanadate P, Chouvatut V. 2022. SARIMA Model Forecasting Performance of the COVID-19 Daily Statistics in Thailand during the Omicron Variant Epidemic. Healthcare. 10(7):1310. ISSN:2227-9032. https://doi.org/10.3390/healthcare10071310 [ Links ]
ESRI. 2020. Statistical analysis software ArcMap. Version 10.8, Redlands, C.A, USA: Environmental Systems Research Institute Inc. https://www.esri.com/es-es/home [ Links ]
GUTIÉRREZ-PLASCENCIA L, Peña-Parra B, Ávila-Ramos F, Navarro EP. 2022. Tipificación de la curva de predicción de rabia bovina en Nayarit durante 2017. Abanico Boletín Técnico. 1:e2022-1. ISSN:3061-8452. https://abanicoacademico.com/abanicoboletintecnico/article/view/160 [ Links ]
HAYES MA, Piaggio AJ. 2018. Assessing the potential impacts of a changing climate on the distribution of a rabies virus vector. PLos ONE. 13(1):e0192887. ISSN:1932-6203. https://doi.org/10.1371/journal.pone.0192887 [ Links ]
INEGI (Instituto Nacional de Estadística, Geografía e Informática). 2024. Espacios y datos de México. https://www.inegi.org.mx/app/mapa/espacioydatos/ [ Links ]
JOHNSON N, Aréchiga-Ceballos N, Aguilar-Setien A. 2014. Vampire bat rabies: ecology, epidemiology and control. Viruses. 6(5):1911-1928. ISSN:1999-4915. https://doi.org/10.3390/v6051911 [ Links ]
KAVOOSIAN S, Behzadi R, Asouri M, Ahmadi AA, Nasirikenari M, Salehi A. 2023. Comparison of Rabies Cases Received by the Shomal Pasteur Institute in Northern Iran: A 2-Year Study. Global Health Epidemiology and Genomics. 2023:e3492601. ISSN: 2054-4200. https://doi.org/10.1155/2023/3492601 [ Links ]
KHAIRULLAH AR, Kurniawan SC, Hasib A, Silaen OSM, Widodo A, Effendi MH,Ramandinianto SC, Moses IB, Riwu KHP, Yanestria SM. 2023. Tracking lethal threat: in-depth review of rabies. Open Veterinary Journal. 13(11):1385-1399. ISSN:2218-6050. https://doi.org/10.5455/OVJ.2023.v13.i11.1 [ Links ]
LANZAGORTA-VALENCIA K, Fernández-Méndez JI, Medellín RA, Rodas-Martínez AZ, Ávila-Flores R. 2020. Landscape and cattle management attributes associated with the incidence of Desmodus rotundus attacks on cattle. Ecosistemas y Recursos Agropecuarios. 7:e2164. ISSN:2007-9028. https://doi.org/10.19136/era.a7n1.2164 [ Links ]
LEUNG AK, Davies HD, Hon KL. 2007. Rabies: Epidemiology, pathogenesis, and prophylaxis. Advances in Therapy. 24:1340-1347. ISSN:0741-238x. https://doi.org/10.1007/BF02877781 [ Links ]
LIU J, Yu F, Song H. 2023. Application of SARIMA model in forecasting and analyzing inpatient cases of acute mountain sickness. BMC Public Health. 23:56. ISSN:1471-2458. https://doi.org/10.1186/s12889-023-14994-4 [ Links ]
MALDONADO-ARIAS DF, Guamán-Rivera SA, Mira-Naranjo JM, Ortiz-Naveda NR. 2024. Bovine rabies cases in Ecuador: a retrospective cross-sectional observational study (2007 to 2022). Brazilian Journal of Biology. 84:e279112. ISSN:15196984. https://doi.org/10.1590/1519-6984.279112 [ Links ]
MAO Q, Zhang K, Yan W, Cheng C. 2018. Forecasting the incidence of tuberculosis in China using the seasonal auto-regressive integrated moving average (SARIMA) model. Journal of Infection and Public Health. 11:707-712. ISSN:1876-0341. https://doi.org/10.1016/j.jiph.2018.04.009 [ Links ]
MARGINEDA C, Giannitti F, Liguori E, Russo S, Castro DJ, Zielinski G. 2021. Brote de rabia paresiante bovina en la región libre de enfermedad en la Argentina. Revista Argentina de Microbiología. 53:135-140. ISSN:0325-7541. https://doi.org/10.1016/j.ram.2020.09.002 [ Links ]
MELLO AKM, Brumatti RC, Neves DA, Alcântara LOB, Araújo FS, Gaspar AO, Lemos RAA. 2019. Bovine rabies: economic loss and its mitigation through antirabies vaccination. Pesquisa Veterinária Brasileira. 39:179-185. ISSN:1678-5150. https://doi.org/10.1590/1678-5150-PVB-6201 [ Links ]
ORTEGA-SÁNCHEZ R, Bárcenas-Reyes I, Cantó-Alarcón GJ, Luna-Cozar J, Rojas-Anaya E, Contreras-Magallanes YG, González-Ruiz S, Cortez-García B, Milián-Suazo F. 2022. Descriptive and Time-Series Analysis of Rabies in Different Animal Species in Mexico. Frontiers in Veterinary Science. 9:800735. ISSN:2297-1769. https://doi.org/10.3389/fvets.2022.800735 [ Links ]
ORTEGA-SÁNCHEZ R, Bárcenas-Reyes I, Luna-Cozar J, Rojas-Anaya E, Cuador-Gil JQ, Cantó-Alarcón GJ, Veyna-Salazar N, González-Ruiz S, Milián-Suazo F. 2024. Spatial-temporal risk factors in the occurrence of rabies in Mexico. Geospatial Health.19. ISSN:1827-1987. https://doi.org/10.4081/gh.2024.1245 [ Links ]
Python Software Foundation. 2023. Python. Versión 3.12, Wilmington, D.E., USA: Python Software Foundation. https://www.python.org/ [ Links ]
RAMÍREZ-ROMERO R, Ramírez-Hernández C, García-Márquez LJ, Macedo-Barragán RJ, Martínez-Burnes J, López-Mayagoitia A. 2014. Bovine diseases causing neurological signs and death in Mexican feedlots. Tropical Animal Health and Production. 46:823-829. ISSN:0049-4747. https://doi.org/10.1007/s11250-014-0572-y [ Links ]
ROCHA F, Ulluoa-Stanojlovic FM, Rabaquim VCV, Fadil P, Pompei JC, Brandaño PE, DIAS RA. 2019. Relations between topography, feeding sites, and foraging behavior of the vampire bat, Desmodus rotundus. Journal of Mammalogy. 101:164-171. ISSN: 1545-1542. https://doi.org/10.1093/jmammal/gyz177 [ Links ]
SANCHEZ-GOMEZ WS, Selem-Salas CI, Cordova-Aldana DI. 2022. Common vampire bat (Desmodus rotundus) abundance and frequency of attacks to cattle in landscapes of Yucatán, México. Tropical Animal Health and Production. 54:130. ISSN:1573-7438. https://doi.org/10.1007/s11250-022-03122-w [ Links ]
SaTScan. 2023. Software for the Spatial and Space-Time Scan Statistics SaTScanTM. Version 10.1.3, Calverton, MD., USA: Information Management Services Inc. https://www.satscan.org/ [ Links ]
SENASICA (Servicio Nacional de Sanidad, Inocuidad y Calidad Agroalimentaria). 2022. Rabia paralítica. https://www.gob.mx/senasica/acciones-y-programas/campana-nacional-para-la-prevencion-y-control-de-la-rabia-en-bovinos-y-especies-ganaderas [ Links ]
SENASICA (Servicio Nacional de Sanidad, Inocuidad y Calidad Agroalimentaria). 2025. Sistema Nacional de Vigilancia epidemiológica. https://www.gob.mx/senasica/acciones-y-programas/sistema-nacional-de-vigilancia-epidemiologica-sive-387894 [ Links ]
SENASICA (Servicio Nacional de Sanidad, Inocuidad y Calidad Agroalimentaria). 2014. Modificación a la Norma Oficial Mexicana NOM-067-ZOO-2007, Campaña nacional para la prevención y control de la rabia en bovinos y especies ganaderas. Diario Oficial de la Federación. México. https://www.gob.mx/cms/uploads/attachment/file/203508/Modificaci_ndeNOM-067-ZOO-2007_15julio14.pdf [ Links ]
SIAP (Servicio de Información Agrícola y Pesquera). 2024. Población ganadera. https://nube.agricultura.gob.mx/poblacion_ganadera/ [ Links ]
SILVA AB, De la Torre MR, Grajales JG. 2019. Derriengue (Rabia paralítica bovina) y el murciélago hematófago. Ciencia y Mar. 23:87-96. https://www.researchgate.net/publication/335639480_Derriengue_Rabia_paralitica_bovina_y_el_murcielago_hematofago#fullTextFileContent [ Links ]
SOUZA ACF, Santos FC, Bastos DSS, Sertorio MN, Teixeira JPG, Fernandes KM, Machado-Neves M. 2018. Reproductive functions in Desmodus rotundus: A comparison between seasons in a morphological context. PLoS ONE. 13:e0205023. ISSN:1932-6203. https://doi.org/10.1371/journal.pone.0205023 [ Links ]
YESCAS-BENÍTEZ JE, Rivero-Perez N, Montiel-Díaz HE, Valladares-Carranza B, Peláez-Acero A, Morales-Ubaldo AL, Zaragoza-Bastida A. 2020. Comportamiento epidemiológico de la leptospirosis en México durante el periodo 2013-2019. Revista de Salud Pública. 22:421-427. ISSN: 0124-0064.https://doi.org/10.15446/rsap.V22n4.87535 [ Links ]
ZARAGOZA-BASTIDA A, Hernández-Tellez M, Bustamante-Montes LP, Medina-Torres I, Jaramillo-Paniagua JN, Mendoza-Martínez GD, Ramírez-Durán N. 2012. Spatial and temporal distribution of tuberculosis in the State of Mexico, Mexico. Scientific World Journal. 2012:570278. ISSN:2356-6140.https://doi.org/10.1100/2012/570278 [ Links ]
ZARZA H, Martínez-Meyer E, Suzán G, Ceballos G. 2017. Geographic distribution of Desmodus rotundus in Mexico under current and future climate change scenarios: Implications for bovine paralytic rabies infection. Veterinaria México OA. 4:10-25. ISSN: 2448-6760. https://doi.org/10.21753/vmoa.4.3.390 [ Links ]
Received: August 15, 2025; Accepted: March 23, 2026; Published: May 31, 2026
 Este es un artículo publicado en acceso abierto bajo una licencia Creative Commons
