


 nueva página del texto (beta)
 Inglés (pdf)
 Artículo en XML
 Referencias del artículo
 Enviar artículo por email
 Citado por SciELO
  Similares en
SciELO
Similares en
SciELO 
 Permalink
The combined prevalence of overweight and obesity (OB) among adults in México is 72.5% (Instituto Nacional de Salud Pública, 2016; ENSANUT, 2016). Comorbidities associated are type 2 diabetes, irritable bowel syndrome, hypertension, and some types of cancer and other diseases (Chen, Li, & Xu, 2015). Further, there is a correlation between cognitive dysfunctions, such as anxiety, depression (Li et al., 2017), which is manifested as eating behavioral disorders (TdCA), mainly binging, food craving (FC), pica, and, paradoxically, anorexia and bulimia (Tronieri, Wurst, Pearl, & Allison, 2017).
The atherogenic index is an efficient measure to evaluate dyslipidemia, which is high in overweight and obesity since it is related to cardiovascular disease and atherosclerosis and fatty liver. This index has been found to be a predictor of non-alcoholic fatty liver disease (Wang, Zheng, Liu, Fang & Li, 2018).
There are a high number of individuals with OB who do not exhibit clinically defined pathology, except for high anxiety levels that diminish when they eat (Bąk-Sosnowska, 2017). Therefore, anxiety can be considered as an OB-independent variable, which leads to either overeating (Ho et al., 2018), a probable sign of FC among individuals who show addiction to food, or abstinence from food (Joyner, Gearhardt, & White, 2015). FC encompasses physiological, emotional-cognitive, and predisposition responses (Rodríguez-Martín, Gil-Pérez, & Pérez-Morales, 2015) due to the intense need for and frequent consumption of a determined type of food. FC is distinct from hunger because the former is highly specific, intense, and directed toward one type of food, even when satiety has reached, predisposing the individual to OB (Kahathuduwa, Binks, Martin, & Dawson, 2017; Van den Eynde et al., 2012).
In FC, there are frequent thoughts related to high-calorie foods (Marín-Soto, Méndez-Peña, Murillo-Tovar, Ocadiz-Parra & Aguilera Sosa, 2019a), especially when you intend to choose a snack; the higher the intensity of the FC, the higher the frequency of eating high-calorie foods (Richard, Meule, Reichenberger & Blechert, 2017). It has also been reported that hyperprocessed and appetizing foods with high levels of refined carbohydrates and sugars are desired (Schulte, Avena & Gearhardt, 2015).
The presence of FC is also related to the difficulties in controlling the weight because, FC is positively associated with the emotional feeding that arises when the over-girth is mainly caused by excitation, causing loss of control when consuming (Taylor, 2019), becoming a vicious cycle that triggers the breach of diets (Martin et al., 2011). The molecular mechanisms underlying FC have been investigated in animal models. The expression of melanocortin 4 receptor (MC4R) in obese mice fed a high-fat diet (Huang et al., 2017) was associated with food addiction. Other cellular players associated with food addiction include CART expression, which regulates β-cell function (Shcherbina et al., 2017), and peptides linked to neuromodulatory behavior involved in eating, drug reward, stress, and cardiovascular function (Chaar, Coelho, Silva, Festuccia, & Antunes, 2016; Zhang et al., 2018). Transcriptional regulation of CART has been demonstrated in response to stimuli in the hypothalamus, possibly through leptin signaling (Domínguez & Kuhar, 2004; Vrang, Kristensen, Tang-Christensen, & Larsen, 2002). Further, genetic polymorphisms in CART that enhance the probability of exhibiting TdCA and FC have been identified because of the elucidation of the intimate relationship that TdCA and FC shares with the dopaminergic reward system of the nucleus accumbens (Kahathuduwa, Davis, O’Boyle, & Binks, 2018).
The dopamine D2 receptor (DRD2) in the nucleus accumbens is yet another molecule involved in TdCA and OB (Genis-Mendoza, Nicolini, Tovilla-Zárate, López-Narváez, & González-Castro, 2016), the modulation of which diminishes FC (Volkow, Wang, Fowler, Tomasi, & Telang, 2011). Asian women who harbor DRD2 polymorphisms exhibit FC specific for carbohydrates and junk food (Yeh et al., 2016). Expression of the fat mass and obesity-associated gene (FTO) in the hypothalamus has been associated with the ingestion of foods, energy balance, and interaction with dietary components (Boender, van Rozen, & Adan, 2012; Doaei, Kalantari, Mohammadi, Tabesh, & Gholamalizadeh, 2017; Speakman, 2015). Individuals harboring the rs9939609 A/T variant show lipolysis (Oyeyemi, Ologunde, Olaoye, & Alamukii, 2017), and those with variants in the alleles (rs1421085 and rs17817449) exhibit poor satiety, over-ingestion behavior, gorging, and pica, mainly for highly palatable foods, such as single carbohydrates and fats, despite the socioeconomic and demographic factors involved (Karra et al., 2013).
Recently it has been reported that the atherogenic index of plasma is a marker associated with liver lipid levels and obesity (Capomolla et al., 2019; Xie, Zhou & Wang, 2019) however, its association with FC and with the transcriptional modulation of genes in obese subjects has not been studied. Therefore, the aim of this study was to evaluate the relationship between the scores and measurements of FC and blood lipids in OB individuals and how they determine the transcriptional modulation of CART, DRD2, and FTO.
Method
Ethical considerations
This protocol was approved by the Ethics in Research Committee of the Centro Interdisciplinario de Ciencias de la Salud Unidad Santo Tomás (CEICICS-008). The trial was conducted in accordance with the ethical principles originating in the Declaration of Helsinki, and it was consistent with the Good Clinical Practice Guidelines. Announcement to participate in this study was published in schools close to the CICS-UST and ESM, and in social networks Participants included 150 adults of both genders aged 24-55 years and who were selected according to the exclusion criteria and randomized into obese (OB; n = 21) and normal weight (NW; n = 20) groups. None of the participants had any registered pathology or comorbidities related to OB, including those in the OB group. Written informed consent was read to each participant and signed.
Participants and instruments
Body mass index (BMI) was calculated with anthropometric values obtained using InBody 270 bioimpedance scale by adopting the ranges established by the World Health Organization for OB diagnosis [BMI, ≥ 30 (30-39.9) kg/m2] and NW (BMI, ≤25 kg/m2). Participants were otherwise clinically healthy, and instructions to follow quality-of-life habits and physical activity were imparted, in addition to ensuring their participation in an eating workshop. Selection criteria included their willingness to participate, for the normal weight group (BMI ≥ 18.5), and for the obese group (BMI ≥ 30); normal lipid profile for the control group and no menopause. Exclusion criteria included consumption alcohol / drugs, or other addiction, taking medication, being outside the BMI range, diabetes, hypertension and metabolic syndrome.
The 41 participants were cited from 7:00 to 10:00 in the laboratory of Biología Molecular of the Escuela Superior de Medicina, Instituto Politécnico Nacional, for blood sampling with 12 hours fast. Blood samples (4 ml) were obtained from the antecubital vein of the arm and used for a 6-element blood chemistry analysis, and for the RNA extraction. Subsequently CART, DRD2, and FTO gene expressions were determined by quantitative polymerase chain reaction (qPCR), using previously established methods for RNA extraction, conversion into complementary DNA (cDNA), and design of specific oligonucleotides as described below.
For the evaluation of FC, we utilized the FCQ-T, adapted, and validated for the Mexican population in 2018, placing emphasis on the cognitive, behavioral, emotional, physiological, and contingency variables (Marín-Soto, Vargas-De-Leon, Pérez-Vielma, Castillo-Ramírez, Miliar-García, & Aguilera-Sosa, 2019b). The internal consistency of FCQ-T was 0.97, and the questionnaire is composed of four factorial domains: (1) anticipation and reinforcement for eating, (2) lack of control, (3) physiological response, and (4) positive emotions, totaling 37 items on the Likert scale. The possible responses are never (1), rarely (2), sometimes (3), often (4), nearly always (5), and always (6). FCQT scores corresponded to ≤52 low FC levels, ≤72 medium FC levels, ≤96 levels above the FC mean, and ≥97 very high FC levels.
Procedure
RNA Extraction
Total RNA was extracted from blood samples of the participants using TRIzol reagent (TriPure Isolation Reagent, Roche Applied Science, Indianapolis, IN, USA) according to the manufacturer’s instructions. The amount and purity of RNA was quantified by measuring the optical density at 260 and 280 nm using a nanophotometer (MaestroNano, Maestrogen, Las Vegas, NV, USA). Integrity was checked for all samples using agarose gel electrophoresis. To avoid trace amounts of DNA contamination, RNA samples were treated with amplification-grade DNase I (Invitrogen, Carlsbad, CA, USA) before reverse transcription. All RNA samples were stored at −80°C in an RNA elution solution until further use.
cDNA Synthesis
The First-strand cDNA Synthesis Kit (Roche Diagnostics, GmbH Mannheim, Germany) was used, taking 1 µg of the total RNA sample; reverse transcription was performed with random hexamers for 10 min at 65°C, 50 min at 35°C, and 2 min at 85°C. The concentration of cDNA was determined spectrophotometrically, and qPCRs were performed using specific oligonucleotide primers.
Oligonucleotide Design
Specific oligonucleotide primers were originally generated using a web-based software (https://qpcr.probefinder.com/organism.jsp). The primer pairs used for the identification of CART, DRD2, and FTO fragments included NM_004291.3: 5′-gggaacacgtt-tactcttgagc-3′(forward) and 5′-ctactctgccgtggatgatg-3′ (reverse), NM_000795.3: 5′-agaccatgagccgtaggaag-3′ (forward) and 5′-gcagccagcagatgatga-3′ (reverse), NM_001080432.2: 5′-tcagagggagaatagctccaga-3′ (forward) and 5′-cgcctcctgcatgtagttc-3′ (reverse), respectively, and the constitutive gene 18S NR_003286.2: 5′-cgaacgtctgccctatcaac-3′ (forward) and 5′-ttggatgtggtagccgtttc-3′ (reverse).
Statistical Analysis
Statistical analysis was conducted using the SPSS ver. 22.0 statistical software program (IBM, USA); central tendency and dispersion measurements were obtained. The Kolmogorov-Smirnov test was used to evaluate data distribution, and the Student’s t-test was used for comparative analysis of independent and related samples. For the linear regression model, a step-by-step method was adopted by subgrouping participants based on their BMI (NW, n = 20 and OB, n = 21). A value of p = 0.05 was considered statistically significant.
Results
The participant’s average age was 31.92 ± 5.30 years, and females were predominant in the OB (76.2%) and NW (60%) groups. The average BMI of the OB group (35.45 ± 3.62 kg/m2) was higher than that of the NW group (23.35 ± 1.75 kg/m2) as per the study design. The average weight in the NW group was 55.90 ± 18.42, and the average weight in the Obesity group was 86.42 ± 22.80
FCQ-T evaluations showed that 30% of the NW group had scores of ≤72, which indicated low risk level for FC, in contrast with the OB group, in which 100% had scores of ≥72, with a clinical level of FC. The average FC scores for the NW group was 55.90 ± 18.42, and for the OB group it was 86.42 ± 22.80 (p < 0.001) (Figure 1).

Figure 1 Differences in Food Craving scores between NW and OB are shown. Higher scores in the obesity group (p < 0.001) are observed.
Laboratory evaluation of the biochemical parameters showed significant differences between the groups in terms of ATH (p = 0.004), triglycerides (p = 0.01), high-density lipoprotein (HDL; p = 0.02), and low-density lipoprotein (LDL; p = 0.03), with higher values in the OB group than in the NW group (Table 1).
Table 1 Determination of the Biochemical Parameters of the Study Population
| Lipids | NW (n = 20) | OB (n = 21) | p |
|---|---|---|---|
| ATH | 3.28 ± 0.85 | 4.74 ± 1.40 | 0.004 |
| Cholesterol | 170 ± 38.54 mg/dl | 181.24 ± 39.23 mg/dl | 0.48 |
| Triglycerides | 82.45 ± 40 mg/dl | 122.84 ± 41.09 mg/dl | 0.01 |
| HDL | 50.17 ± 14.85 mg/dl | 39.11 ± 9.18 mg/dl | 0.02 |
| LDL | 83.33 ± 26.52 mg/dl | 139.00 ± 194.57 mg/dl | 0.03 |
| VLDL | 56.87 ± 64.99 mg/dl | 62.35 ± 32.22 mg/dl | 0.26 |
Note. Results are expressed as average ± standard deviation (SD), p=significance. ATH= atherogenic index. Significant differences between NW and OB groups were found in all variables, except cholesterol
Results of the qPCR analysis showed significant increase in the relative DRD2 expression in the OB group compared with that in the NW group (p = 0.027; Figure 2), whereas CART expression was significantly suppressed in the OB group (p = 0.001; Figure 3). Although there was a tendency toward decrease in the OB group, there was no significant difference between the groups in the FTO expression (Figure 4).

Figure 2 Relative expression of DRD2 gene. Average of the expression of DRD2 in the OB and NW groups shows a significant increase in the OB group (*p = 0.027).
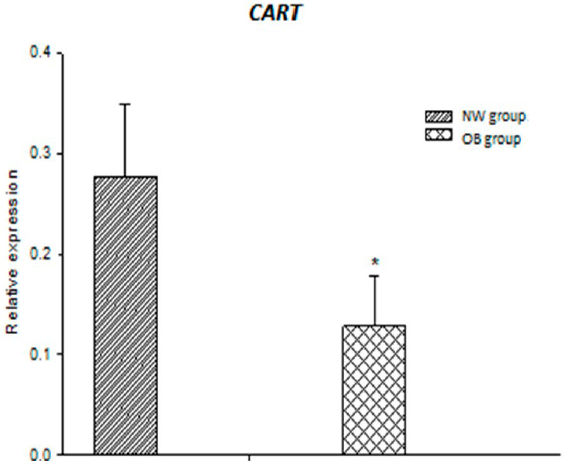
Figure 3 Relative expression of CART gene. Average of the expression of CART in the OB and NW groups shows a significant decrease in the OB group (*p = 0.001).

Figure 4 Relative expression of FTO gene. Average of the expression of FTO in the OB and NW groups shows no significant differences in the OB group.
Linear Regression Model
We applied linear regression models to assess the association between dependent variables, FC, DRD2, CART, and FTO, and predictive variables, BMI, HDL, LDL, very-low-density lipoprotein (VLDL), total cholesterol, triglycerides, and ATH, using the method of successive steps that allows separation of these variables to levels of significance <0.05 and >0.05. Nine linear regression models, two for the NW group and seven for the OB group, were identified and applied in this study.
The two explanatory models for HDL in the NW group were FC and DRD2. On the other hand, the seven models in the OB group were as follows: first, FC explains LDL; second and third, CART explains ATH and VLDL; fourth and fifth, DRD2 explains ATH and VLDL; sixth, DRD2 explains FC; and seventh, CART explains FC. Thus, HDL was the predictor variable of the NW group and ATH, LDL, VLDL and FC were the predictor variables of the OB group (Table 2, figure 5).
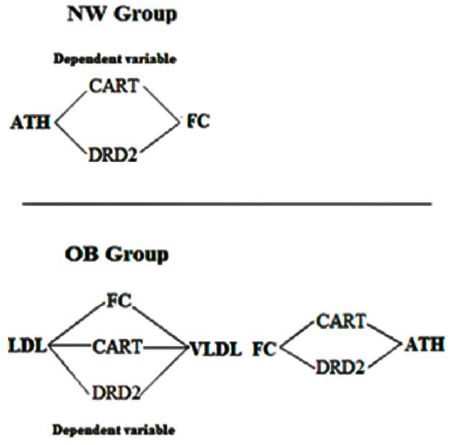
Figure 5 Representation of linear regression models by group. This diagram describes the relationships between variables, those that are outside the rhombuses, are the independent ones, those that are inside are the dependent ones. Thus, the dependent variables in the NW group are CART and DRD2 gene expression, and in the OB group are FC, CART and DRD2 gene expression. OB= Obesity group; NW= Normal Weight group.
Table 2 Linear Regression Models
| Group | Predictor variable | Dependent variable | r2 | p |
|---|---|---|---|---|
| NW | HDL | FC | 0.44 | 0.001 |
| HDL | DRD2 | 0.20 | 0.028 | |
| OB | LDL | FC | 0.19 | 0.026 |
| ATH | CART | 0.23 | 0.015 | |
| VLDL | CART | 0.40 | 0.020 | |
| ATH | DRD2 | 0.44 | 0.001 | |
| VLDL | DRD2 | 0.58 | 0.022 | |
| FC | DRD2 | 0.61 | 0.047 | |
| FC | CART | 0.52 | 0.032 |
Note. r2 = R Square, p = significance. The linear regression models applied show that in the OB group, lipids and FC are predictive variables of CART and DRD2 gene expression.
Discussion
In this study, we were able to determine a significant FC score in OB subjects as well as a significant correlation with blood lipid levels and ATH. The intense desire or urge to eat a particular type of food has been associated with OB individuals. Frequent and intense FC can provoke alterations in psychological and emotional well-being and nutritional status and are associated with psychophysiological disorders such as bulimia (Van den Eynde et al., 2012).
Measurement of FC is facilitated through validated instruments, such as self-reports and questionnaires. One such multidimensional tool is the FCQ-T, which has been validated in several countries, including Spain (Cepeda-Benito, Gleaves, Williams, & Erath, 2000), Holland (Nijs, Franken, & Muris, 2007), Germany (Meule, Lutz, Vögele, & Kübler, 2012), Cuba (Rodríguez-Martín et al., 2015), Brazil (Queiroz de Medeiros, Campos Pedrosa, Hutz, & Yamamoto, 2016) and México (Marín-Soto et al., 2019b. It is a sensitive instrument, and the Mexican version has a high internal consistency (Cronbach’s alpha = 0.97) for the scales, since it has been validated and standardized, it is worth mentioning that it is the first standardization of this questionnaire. The results of the linear regression models are significant prompting its use in the current study. We applied FCQ-T to assess the strength of the desire to consume food by a specific group of participants and examined its association with physiological and genetic variables. To the best of our knowledge, this is the first study that demonstrated the relationship between gene expression, FC, and other variables, such as BMI, ATH, triglycerides, HDL, and LDL in obese and normal weight individuals. The scores obtained in FCQ-T (Marín-Soto et al., 2019b) consider the significant differences that exist in FC of both groups, as noted in the standard deviations in the population. The high FCQ-T score in OB participants they indicate an intense desire to consume the food they crave (usually highly appetizing), this will evoke frequent thoughts related to consumption and pleasant emotions that are generated after ingestion; contrary to the findings that suggest that obese subjects (particularly in women) would benefit from interventions to improve their coping strategies to manage the negative emotions that trigger cravings (Imperatori et al., 2013). In this investigation, obese subjects anticipate pleasurable emotions that are generated after intake (Marín-Soto et al., 2019b). In addition to the above, our findings suggest that obese subjects after anticipating hedonic states will reinforce the search for food by overlapping the low capacity to inhibit consumption, correlative to gene expression.
Recently Massicotte, Deschênes, & Jackson (2019), showed that a low ability to inhibit intake is related to FC after it is induced, in obese people with greater traits of food addiction; the inhibition of behavior is diminished (Rodrigue et al., 2018) being a limitation to lose weight because it favors unhealthy habits. Although many studies related to addictive behavior have focused on genetic polymorphisms (Lek, Ong, & Say, 2018; Obregón, Valladares, & Goldfield, 2017; Vasseur et al., 2007; Yeh et al., 2016), we examined gene expression and found an increase in the DRD2 expression in OB participants, in whom it is involved in the transport of dopamine. Dopamine levels are increased in addicted individuals, in whom this neurotransmitter is involved in motivational behavior and persistence and effort toward the pursuit of reinforcements of stimuli (Volkow et al., 2011). We found through linear regression that DRD2 explains FC in OB participants, providing an explanation for the association between FC and the effect of dopamine on addiction.
Studies on the polymorphisms of DRD2 have linked the rs1800497 variant to eating behaviors. The carriers of the T allele are susceptible to accumulation of total body fat, greater reinforcement of foods, and greater motivation to eat, particularly a hypercaloric diet (Obregón et al., 2017). Furthermore, the DRD2 TaqI A1 allele was significantly associated with BMI in a study that evaluated correlations between candidate genes, FC, overeating, and BMI (Yeh et al., 2016). The role of dopamine was further implicated when it was demonstrated that the DRD2 A1 variant was associated with craving for carbohydrates and fast food among Asian Americans (Yeh et al., 2016). In addition, DRD2 expression was correlated to eating behaviors in a study on homozygote twins. Higher gene expression was noted in individuals who exhibited a "compulsivity to eat" (Genis-Mendoza et al., 2016). This finding corroborates the results of the present investigation, wherein we demonstrate a linear correlation between DRD2 expression in the OB group and high FC. There is a paucity of studies showing how the DRD2 expression is related to FC and other important metabolic variables. Our findings support the hypothesis of the important relationship between the DRD2 overexpression and FC as well as with obesity.
CART expression regulates production of peptides with neuromodulatory activity that controls eating, satiety, drug reward, stress, and cardiovascular function (Chaar et al., 2016; Leone et al., 2018; Vasseur et al., 2007). Mutations in CART affect appetite such that individuals who harbor such mutations have a greater propensity of developing TdCA and FC due to the intimate relationship that obesity shares with the dopaminergic reward system determined by DRD2 (Lisa, Sook, & Yee, 2012). High CART expression levels were found to localize in the brain regions, including the arcuate nucleus, lateral hypothalamus area, paraventricular nucleus, and nucleus accumbens, of rodents, monkeys, and humans. This pattern of localization suggests an important role of CART in the regulation of food intake and satiety. Consistently, injection of CART peptide into the nucleus accumbens in rodents inhibits feeding behavior (Lau & Herzog, 2014; Yang, Shieh, & Li, 2005). Furthermore, studies of mutations in CART in humans suggest a primary anorectic role of CART (Lau & Herzog, 2014). These data agree with the CART expression profile, showing a significant suppression in OB individuals as seen in the present study. Our results suggest an important role of CART in satiety. On the other hand, leptin levels are elevated in obese individuals and leptin reportedly modifies CART expression (Domínguez & Kuhar, 2004; Vrang et al., 2002). It is plausible for leptins to be involved in the suppression of CART in obesity. This warrant further investigation in this association.
FTO expression studies suggest its important role in energy homeostasis, wherein it influences brain regions that regulate eating, such as the hypothalamus. Indeed, short-term exposure to a high-fat diet suppresses the hypothalamic expression of FTO, but prolonged exposure increases its expression, which is manifested as not only overeating behavior and elevated body fat (Karra et al., 2013) but also food restriction. Although we did not find significant differences in FTO expression between OB and NW groups in the current study, FTO expression has been mainly reported in adipocytes; however, we examined its expression in the blood. Therefore, it would be useful to measure the expression levels in adipose tissue of these participants in future studies.
In the linear regression analysis, one of the most outstanding findings was the sensitivity of FCQ-T, particularly a high score (≥68) to DRD2 and CART expressions in the OB group. It is noteworthy that both ATH and VLDL were identified as predictor variables for DRD2 and CART expressions. Therefore, we postulate that FCQ-T could be a useful tool for predicting the alteration in the expression of the CART and DRD2 gene as well as dyslipidemia in obese individuals. Therefore, it is proposed that using this questionnaire as a preventive instrument in population studies could reduce health costs, particularly in controlling cardiovascular diseases.
Conclusion
Results of our study show that FCQ-T can be of great use for predicting obesity and ATH of risk, independently of BMI. The DRD2 gene is observed with higher expression in the OB group with statistical differences, confirming the working hypothesis that suggests that dopamine is dysregulated in subjects with OB.
On the other hand, the relative expression of CART gene shows a significant decrease in the OB group; in the linear regression we found that FC explains LDL; CART explains ATH and VLDL; DRD2 explains ATH, VLDL and FC; and finally, CART explains FC.
We confirmed differences between OB and NW in FC, and in the gene expression of DRD2 and CART.
For future works, we suggest expanding the sample and investigating eating and physical activity habits, dividing into subgroups by gender and fat percentage levels. It would be interesting to analyze the predictive power of the FC questionnaire related to blood chemistry indicators, mainly with lipids and
its possible relationship with glucose.

