


 nova página do texto(beta)
 Inglês (pdf)
 Artigo em XML
 Referências do artigo
 Enviar este artigo por email
 Citado por SciELO
  Similares em
SciELO
Similares em
SciELO 
 Permalink
Woody climbers (lianas) are an important component of tropical plant communities worldwide. Gentry (1991a) estimated 3,513 neotropical liana species. In many tropical forests, they can include almost 25 % of stems and between 8-35 % of regional flora species (Gentry 1988, Hegarty & Caballé 1991, Ibarra-Manríquez et al. 2015). Lianas can influence several relevant ecological processes such as forest gap dynamics, forest biomass and carbon dynamics, and a wide range of biotic interactions (Gentry 1991b, Lü et al. 2009, Schnitzer 2018, Visser et al. 2018). Most censuses carried out in lianas have been established in plots ≤ 1-ha or have excluded individuals with diameters < 2.5 cm. Nonetheless, these censuses have shown that about 60 % of the stems in tropical forests are lianas (Putz & Chai 1987, Hegarty & Caballé 1991). Further, studies in larger areas have revealed that taxonomic composition can be strikingly different and that local richness and stem density per hectare can be up to twice the average value in nearby or adjacent plots (Lü et al. 2009, Ewango et al. 2015, Nogueira et al. 2015, Schnitzer et al. 2015, Thomas et al. 2015). Consequently, there is biased information on liana community attributes in many tropical forests, which indicates the need to increase censuses with areas of at least 1-ha, and which should include individuals with stems from 1 cm in diameter.
Some patterns in liana composition, structure, and diversity have been described in tropical forest communities at different scales. Globally, there is a preponderance in the species richness of the Bignoniaceae and Fabaceae in Neotropics, while Apocynaceae, Annonaceae, Celastraceae, and Fabaceae are often mentioned as dominant in Paleotropics (Gentry 1991a). Moreover, it has been found that species richness and stem density show a negative relationship with latitude, elevation, and total annual rainfall but stem density is correlated positively with dry season length (Gentry 1982, DeWalt et al. 2010, 2015, Schnitzer 2018). At the local scale, light availability has a positive effect with both community attributes (Dalling et al. 2012, Ledo & Schnitzer 2014). Contrary to what has been reported for tree communities, the higher values of these attributes have been generally recorded in Africa, followed by Neotropics and Australasia (Gentry 1991a, DeWalt et al. 2015).
Considering that the Los Tuxtlas Tropical Biology Station (TBS), in the SE of Mexico, is considered as one of the northernmost neotropical rain forests, the liana community composition, structure, and diversity may differ in relation to other tropical and subtropical forests worldwide. In the TBS, previous ecological work on liana community included the analysis of their phenology, the functional types of the seedlings, and general interactions with tree species (Ibarra-Manríquez et al. 1991, Pérez-Salicrup & De Meijere 2005, Vleut & Pérez-Salicrup 2005). There has been only one attempt to characterize lianas with ≥ 1 cm in diameter in a 1-ha plot (Bongers et al. 1988). Nevertheless, the information on structure and diversity of this study was restricted to the number of individuals and species, and several morpho-species were reported, which make comparisons with global data difficult. Besides, this hectare has two atypical conditions in the reserve: i) a relatively flat topography (Figure 1), and ii) a high dominance of the canopy tree Damburneya ambigens (S.F. Blake) Trofimov (synonymous Nectandra ambigens (S.F. Blake) C.K. Allen). Thus, it would be convenient to have liana community data in other parts of the forest with different topography and tree composition to evaluate the degree of coincidence with global patterns.
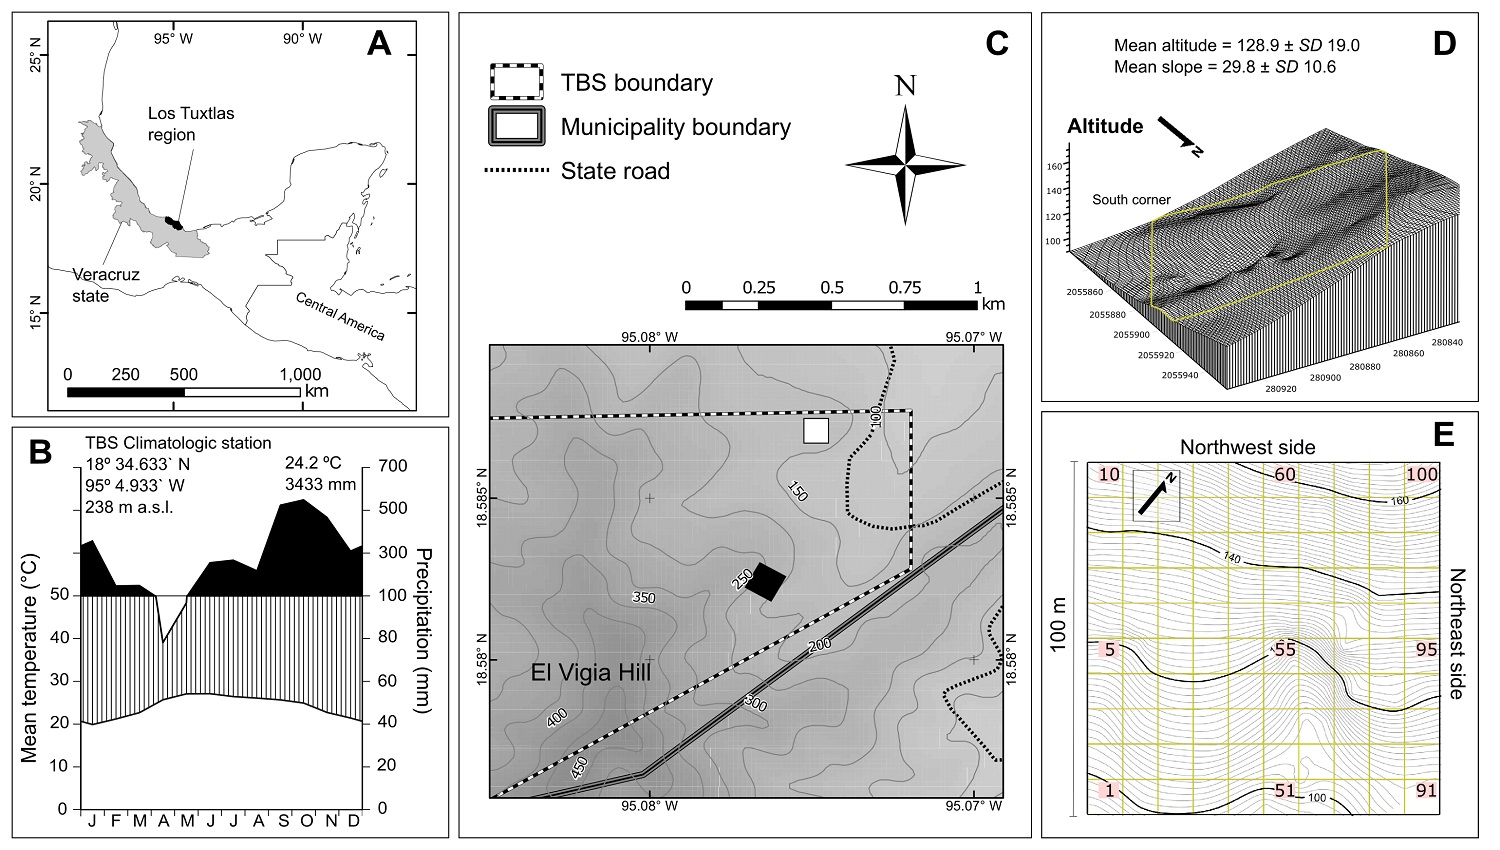
Figure 1: (A) Study site location in Los Tuxtlas region, state of Veracruz, Mexico. (B) Ombrothermic diagram for the Los Tuxtlas Tropical Biology Station for years 2011-2017. (C) Plot location (Black square) in this reserve; the white square indicates the plot surveyed by Bongers et al. (1988). (D) 3-D diagram of the plot relief; yellow lines indicate plot limits, and UTM (N15 zone) coordinates are shown on both sides every 20 m. (e) Plot plane showing contour lines at 1 m and the 10 × 10 m squares into which the plot was divided; the numbering begins in the lower left corner with number 01 and continues upwards to the top and so on for each row until reaching 100.
This study focuses on answering the following questions, based on the census of lianas ≥ 1 cm in diameter, within a 1-ha plot of tropical rain forest of the TBS, which was selected to exhibit a complex topography and low dominance of D. ambigens: i) What is the degree of coincidence of the dominant liana families in terms of species richness, abundance, and basal area, with respect to that documented for other tropical and subtropical rainforests? ii) What are the liana species with the greatest structural importance in the studied hectare? and iii) Is the composition, structure, and diversity of the liana community in our study site similar to that recorded in other tropical and subtropical rainforests?
Considering the latitudinal location of the TBS (Figure 1A), within the northernmost area of the tropical rain forest in America, the average amount of rainfall registered throughout the year (> of 4,000 mm), and with the short dry season (2 months on average), we expect that: i) Bignoniaceae and Fabaceae will be the most diverse and abundant families as occurs in other neotropical forests, and ii) Abundance, basal area, and diversity of lianas will show minor values in comparison with other tropical and subtropical forests.
Materials and methods
Study site. The TBS is one of the most important reserves for the study of tropical flora in Mexico (Figure 1A) and protects 640 ha of tropical rain forest (Ibarra-Manríquez et al. 1997). The reserve registers a mean temperature of 24.2 °C, an average annual precipitation of 3,433 mm and a dry season of two months (Figure 1B). Its topography is heterogeneous, with elevations ranging from 150 to 650 m asl and slopes typically between 6 and 34 °. The soil is volcanic, rich in nutrients and organic matter.
Plot location and liana survey. We established a 1-ha plot near the SW limit of the TBS (95° 04’ 34” W and 18° 34’ 56” N), on the NE slope of El Vigía peak, in an old growth forest, without recent evidence of disturbance (Figure 1C). The plot relief varies strongly with a difference in elevation of ca. 70 m between the lowest and highest point and slope ranging between 0 and 40 °, typically > 20 º (Figure 1C-E), where D. ambigens is not a dominant species in the upper stratum since only documented 12 individuals in the hectare (Ek-Rodríguez 2019), which contrasts with the hectare sampled by Bongers et al. (1988). The plot was divided into 100 squares of 10 × 10 m (100 m2), where all rooted lianas with ≥ 1 cm at the base were tagged. All numbered individuals were identified to the species level. This task was possible because two of the authors (G I-M and S S-C) have extensive experience in the vegetative determination of the TBS flora species, an experience reflected in the publication of floristic studies supported by herbarium specimens (Ibarra-Manríquez & Sinaca-Colín 1995, 1996a, b). The diameter of each stem was measured without distinguishing clonal stems. Woody hemiepiphytes species were not included (see definition in Gentry 1991a).
Data analysis. The liana floristic composition was quantified by determining the number of families, genera, and species of the lianas in the plot. The families were classified according to the APG IV (2016) system, and we calculated the number of genera and species of each. To quantify structure, we calculated the number and the basal area of stems (BA = π (Stem diameter/2)2) of the total liana community, by family and by species. To determine the structural importance of liana species, we calculated an importance value index (IVI) adding relative values of abundance, basal area, and frequency (number of 100 m2 subplots in which each species was registered). The degree of relationship between abundance and basal area was determined by plotting the number of individuals and the basal area that these accumulated progressively, as well as from a linear model of these variables by species. Finally, we characterized the diametric distribution of abundance and basal area.
To quantify liana community diversity in the plot, we computed the effective number of species
Comparison of community parameters with other studies. We compiled data from studies worldwide in other tropical and subtropical forests (Table 1). Since the minimum diameter used and the census area of these studies varied, we carried out our comparison as follows. For those studies with a diameter greater than that used in this study, abundance and basal area were estimated for that diameter cut-off. For studies that had surveyed more than 1-ha we obtained the average values of those attributes for that area. In some cases, we included studies of 1-ha or less due to their importance as they were in areas with only a few liana censuses. To compare liana diversity, we used absolute and rarefacted values obtained with iNEXT function described below and, when possible, the respective values reported in all compiled studies.
Table 1 Summary of studies at tropical and subtropical sites worldwide used to compare its community attributes with those registered in the hectare sampled. Census and site characteristics are shown. For further information on liana community attributes values see the original source. Source (Africa: 1. Thomas et al. (2015); 2. Ewango et al. (2015); 3. Mumbanza et al. (2020); 4. Senbeta et al. (2005); Australasia: 5. DeWalt et al. (2006); 6. Rahmad et al. (2018); 7. Putz & Chai (1987); 8. Lü et al. (2009); 9. Ghosh (2013); 10. Muthuramkumar & Parthasarathy (2000); 11. Muthumperumal & Parthasathy (2010); 12. Padaki & Parthasarathy (2000); 13. Swamy et al. (2000); North and Central America: 14. Mascaro et al. (2004); 15. Arroyo-Rodríguez & Toledo-Aceves (2009); 16. Bongers et al. (1988); 17. Ibarra-Manríquez & Martínez-Ramos (2002); 18. Schnitzer et al. (2015); South America: 19. Macia (2008); 20. Pérez-Salicrup et al. (2001); 21. Nogueira et al. (2015); 22. Alves et al. (2012): 23. Macía (2011); 24. Burnham (2004); 25. Nabe-Nielsen (2001); 26. Romero-Saltos (2011)). MDI: (minimum diameter; cm), NPL (number of plots), TAR (total area; ha), MAP (mean annual precipitation; mm), DSL (dry season length months), ALT (altitude; m asl), REF (references).
| Location | MDI | NPL | TAR | MAP | DSL | ALT | REF |
|---|---|---|---|---|---|---|---|
| Africa | |||||||
| Cameroon (Korup) | 1 | 1 | 18 | 5.4 | 3 | 160 | 1 |
| Congo (Ituri) | 2 | 2 | 20 | 1.8 | 3 | 800 | 2 |
| Congo (Yangabi) | 2 | 12 | 12 | 1.7 | 3 | 470 | 3 |
| Ethiopia | 2 | 190 | 7.6 | 1.2-2.2 | - | 950-2,200 | 4 |
| Australasia | |||||||
| Borneo (Sepilok) | 2.5 | 9 | 2.25 | 2.9 | 1 | ~180 | 5 |
| Malaysia (Royal Belum) | 1 | 5 | 1 | ? | ? | 290-540 | 6 |
| Malaysia (Lambir) | 1 | 10 | 1 | 2.9 | 0-1 | 50-140 | 7 |
| China (Xishuangbanna) | 2 | 3 | 3 | 1.5 | 6 | 581-730 | 8 |
| India (Andaman) | 0.5 | 12 | 1.23 | 3.0 | - | - | 9 |
| India (Western Ghats) | 1 | 1 | 30 | 1.6 | 4 | ~900 | 10 |
| India (Eastern Ghats) | 1.5 | 110 | 55 | 1.1 | 7 | ~500 | 11 |
| India (Agumbe)* | 1.5 | 3 | 3 | 7.3 | 5 | 200- 650 | 12 |
| India (Tamil Nadu) | All | 6 | 0.6 | 2.3 | 4 | ~475 | 13 |
| North and Central America | |||||||
| Costa Rica (La Selva) | 0.2 | 9 | 0.78 | 4.0 | 0 | ~100 | 14 |
| Mexico (Los Tuxtlas) ** | 2.5 | 15 | 1.5 | 4.6 | 1 | ~400 | 15 |
| Mexico (Los Tuxtlas) | 1 | 1 | 1 | 4.7 | 1 | 150 | 16 |
| Mexico (Chajul) | 1 | 240 | 1.2 | 3.0 | 2 | ~700 | 17 |
| Panama (Barro Colorado) | 1 | 1 | 50 | 2.6 | 4-6 | 79 | 18 |
| South America | |||||||
| Bolivia (Madidi) | 2.5 | 24 | 2.4 | 2.3 | 3-4 | 330-530 | 19 |
| Bolivia (Oquiriquia) | 2 | 12 | 1.08 | 1.5 | 6 | 200 | 20 |
| Brazil (Viruá) | 1 | 13 | 1.3 | 1.9 | 8 | - | 21 |
| Brazil (BDFFP) | 2 | 18 | 18 | 2.9 | 2 | - | 21 |
| Brazil (Ducke) | 1 | 12 | 3 | 2.1 | 3 | - | 21 |
| Brazil (Cotriguacu) | 1 | 56 | 14 | 1.2 | 7 | - | 21 |
| Brazil (Ubatuba) | 1 | 5 | 5 | 1.7-2.4 | 1-3 | 11-1025 | 22 |
| Ecuador (Yasuní) | 2.5 | 11 | 1.1 | 2.8 | 0 | 275 | 23 |
| Ecuador (Yasuní) | 2.5 | 14 | 1.4 | 2.8 | 0 | 275 | 23 |
| Ecuador (Yasuní) | 1 | 60 | 2.4 | 2.9 | 0 | 250 | 24 |
| Ecuador (Yasuní) | <1 | 2 | 0.4 | 3.1 | 0 | 240 | 25 |
| Ecuador (Yasuní) | 1 | 30 | 1.2 | 3.0 | 0 | 243 | 26 |
* Only includes lianas supported by trees; ** Landscape with a low deforestation level.
Additionally, to test if there was any effect of latitude, precipitation, and dry season length on mean species richness per hectare ( 0 N ha-1) reported in previous studies (Table 1), we performed simple linear regression analysis using the base library in R (R Core Team 2019). We include in these analyses our study plot values to determine how much our results matched with the predicted values of the regressions. For each study, we used reported values of latitude in absolute decimal degrees (transformed if other), average annual precipitation (mm), and dry season length as the number of months with less than 100 mm of precipitation.
Results
Family composition. We documented 42 lianas species belonging to 35 genera representing 20 families (Table 2). Nine families accounted for 73.8 % of the species, 68.6 % of the genera, 78.5 % of the stem density, and 76.5 % of the basal area (Table 3). Bignoniaceae had the highest number of genera, species, and stem density, and was second for basal area. The number of individuals in Apocynaceae is close to that accumulated by Bignoniaceae (84 and 89 individuals, respectively), and was the most important with respect to the basal area (Table 3), although it was represented only by two species. Celastraceae ranked third for abundance and basal area but second in species richness. Eleven families (55 %) were represented by only a single species (Table 2).
Table 2 Liana species recorded in the 1-ha plot within the Los Tuxtlas Tropical Biology Station arranged by family. Frequency (number of 100 m2 subplots where the species was registered) and Importance Value Index (IVI) are shown. The numbers in parenthesis alongside the family name indicate the genera and species number, respectively.
| Family and Species | Frequency | IVI |
|---|---|---|
| 1. Apocynaceae, (2/2) | ||
| 1. Forsteronia acouci (Aubl.) A. DC. | 31 | 59.3 |
| 2. Prestonia mexicana A. DC. | 1 | 0.67 |
| 2. Arecaceae (1/1) | ||
| 3. Desmoncus orthacanthos Mart. | 3 | 2.3 |
| 3. Aristolochiaceae (1/1) | ||
| 4. Aristolochia ovalifolia Duch. | 4 | 4.0 |
| 4. Asteraceae (2/2) | ||
| 5. Mikania hookeriana DC. | 4 | 3.3 |
| 6. Tuxtla pittieri (Greenm.) Villaseñor & Strother | 1 | 2.9 |
| 5. Bignoniaceae (6/9) | ||
| 7. Anemopaegma chrysanthum Dugand | 7 | 5.8 |
| 8. Dolichandra unguis-cati (L.) L.G. Lohmann | 1 | 0.9 |
| 9. Fridericia candicans (Rich.) L.G. Lohmann | 8 | 8.3 |
| 10. Fridericia chica (Bonpl.) L.G. Lohmann | 4 | 3.2 |
| 11. Fridericia florida (DC.) L.G. Lohmann | 2 | 1.6 |
| 12. Fridericia schumanniana (Loes.) L.G. Lohmann | 5 | 5.3 |
| 13. Mansoa verrucifera (Schltdl.) A.H. Gentry | 13 | 13.1 |
| 14. Stizophyllum riparium (Kunth) Sandwith | 16 | 16.0 |
| 15. Tanaecium pyramidatum (Rich.) L.G. Lohmann | 15 | 16.9 |
| 6. Celastraceae (4/5) | ||
| 16. Hippocratea volubilis L. | 1 | 0.7 |
| 17. Pristimera caribaea (Urb.) A.C. Sm. | 7 | 9.0 |
| 18. Pristimera celastroides (Kunth) A.C. Sm. | 4 | 3.8 |
| 19. Salacia cordata (Miers) Mennega | 22 | 23.4 |
| 20. Tontelea hondurensis A.C. Sm. | 5 | 4.2 |
| 7. Combretaceae (1/1) | ||
| 21. Combretum laxum Jacq. | 14 | 18.8 |
| 8. Connaraceae (1/1) | ||
| 22. Connarus schultesii Standl. | 13 | 12.2 |
| 9. Convolvulaceae (1/1) | ||
| 23. Ipomoea philomega (Vell.) House | 15 | 11.5 |
| 10. Dilleniaceae (1/1) | ||
| 24. Tetracera volubilis L. | 1 | 1.1 |
| 11. Fabaceae (1/1) | ||
| 25. Machaerium floribundum Benth. | 4 | 4.4 |
| 12. Loganiaceae (1/1) | ||
| 26. Strychnos panamensis Seem. | 2 | 2.3 |
| 13. Malpighiaceae (3/3) | ||
| 27. Mascagnia vacciniifolia Nied. | 3 | 2.3 |
| 28. Stigmaphyllon lindenianum A. Juss. | 5 | 5.5 |
| 29. Tetrapterys glabrifolia (Griseb.) Small | 1 | 1.1 |
| 14. Menispermaceae (3/3) | ||
| 30. Abuta panamensis (Standl.) Krukoff & Barneby | 2 | 3.9 |
| 31. Disciphania calocarpa Standl. | 2 | 1.6 |
| 32. Odontocarya mexicana Barneby | 9 | 8.8 |
| 15. Nyctaginaceae (1/1) | ||
| 33. Pisonia aculeata L. | 4 | 8.7 |
| 16. Rhamnaceae (1/1) | ||
| 34. Gouania lupuloides (L.) Urb. | 1 | 0.8 |
| 17. Rubiaceae (1/1) | ||
| 35. Randia retroflexa Lorence & M. Nee | 1 | 0.7 |
| 18. Sapindaceae (1/2) | ||
| 36. Paullinia clavigera Schltdl. | 11 | 8.9 |
| 37. Paullinia venosa Radlk. | 1 | 1.0 |
| 19. Smilacaceae (1/2) | ||
| 38. Smilax aristolochiifolia Mill. | 1 | 1.4 |
| 39. Smilax domingensis Willd. | 1 | 0.8 |
| 20. Vitaceae (2/3) | ||
| 40. Cissus gossypiifolia Standl. | 13 | 16.4 |
| 41. Cissus microcarpa Vahl | 2 | 1.7 |
| 42. Vitis tiliifolia Humb. & Bonpl. ex Schult. | 2 | 1.5 |
Table 3 Families with two or more species recorded in a 1-ha plot at the Los Tuxtlas Tropical Biology Station. All variables are percentages, but the number of genera and species is in parentheses.
| Family | Abundance (ind ha-1) |
Stem density (stems ha-1) |
Basal área (cm2 ha-1) |
Genera | Species |
|---|---|---|---|---|---|
| Bignoniaceae | 22.5 | 23.6 | 21.5 | 17.1 (6) | 21.4 (9) |
| Celastraceae | 15.2 | 14.8 | 11 | 11.4 (4) | 11.9 (5) |
| Malpighiaceae | 3.0 | 2.5 | 2.4 | 8.6 (3) | 7.1 (3) |
| Menispermaceae | 5.8 | 5.3 | 3.6 | 8.6 (3) | 7.1 (3) |
| Vitaceae | 6.3 | 5.9 | 6.8 | 5.7 (2) | 7.1 (3) |
| Apocynaceae | 21.2 | 19.6 | 26.5 | 5.7 (2) | 4.8 (2) |
| Asteraceae | 1.8 | 1.9 | 2.5 | 5.7 (2) | 4.8 (2) |
| Sapindaceae | 3.5 | 3.6 | 1.8 | 2.9 (1) | 4.8 (2) |
| Smilacaceae | 1.0 | 1.3 | 0.5 | 2.9 (1) | 4.8 (2) |
Liana community structure. We recorded 396 individuals accounting for 474 stems and a total basal area of 6,619.2 cm2. We registered lianas in 84 of the 100 subplots in which the 1-ha plot was divided. Density and basal area are strongly related, since individuals contribute a similar amount to the basal area (Figure 2A), while the 10 species with the highest abundance contribute similar percentages, both to the basal area (68.4 %) as well as the total abundance of the community (67.2 %). Furthermore, the two variables have a statistically significant linear relationship (Figure 2B).
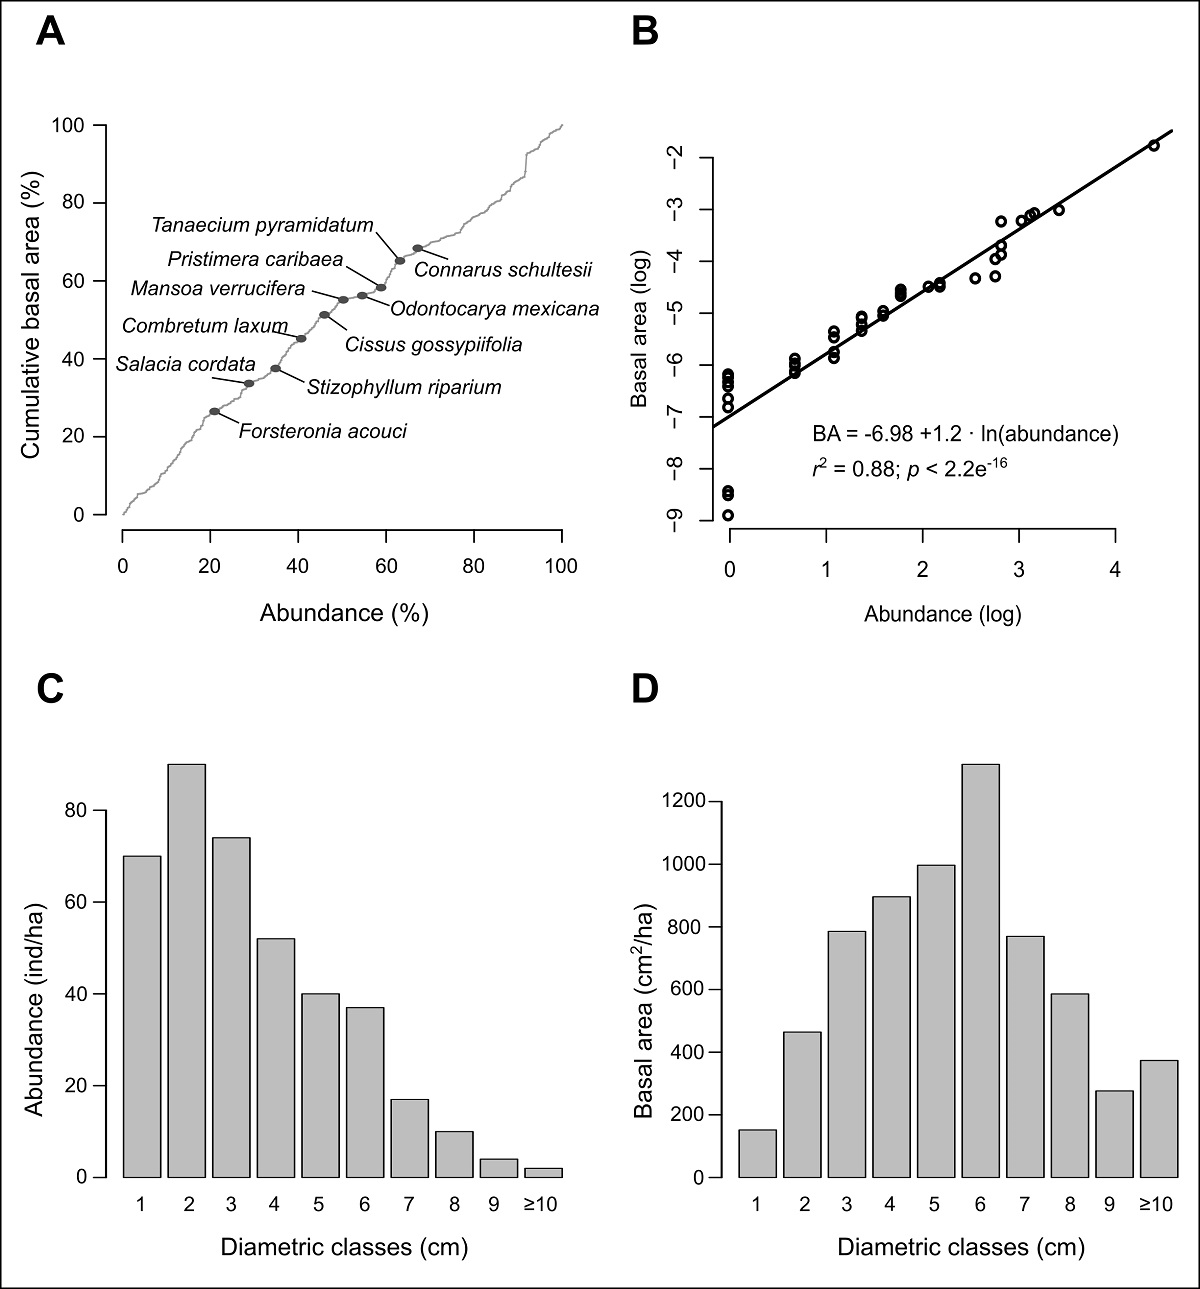
Figure 2: Structural attributes of the lianas censused in the 1-ha study plot. (A) Percentage of the accumulated basal area by species ranked by abundance; the first 10 most abundant species are indicated by gray circles. (B) Simple linear regression between natural logarithm of the abundance and basal area by species. (C) Diametric distribution of abundance. (D) Diametric distribution of basal area.
Most of the individuals presented diameters between 1 and 3.9 cm (59.1 %), being the individuals with diameter between 2 and 2.9 cm the most abundant than those in the smaller category; the remaining diametric categories decrease progressively (Figure 2C). Conversely, basal area is accumulated in intermediate categories (bell-shaped distribution). Individuals between 6 and 6.9 cm were the ones with a larger amount of basal area (Figure 2D) in spite the fact that they were not the most abundant. Only two individuals, both belonging to Pisonia aculeata L. (Nyctaginaceae), had diameters of ≥ 10 cm, which encompass 5.6 % of the total basal area (Figure 2C-D; Table 4).
Table 4 Values for density, basal area, and diversity of order q (0, 1 and 2) for the different minimum diameter cut-off for lianas censused in the 1-ha plot at the Los Tuxtlas Tropical Biology Station.
| Structure and diversity parameters | Stem minimum diameter (cm) | |||
|---|---|---|---|---|
| 1 | 2.5 | 5 | 10 | |
| Abundance (ind ha-1) | 396 | 274 | 110 | 2 |
| Stem density (stems ha-1) | 474 | 337 | 132 | 2 |
| Basal area (cm2 ha-1) | 6,619.2 | 6,246.4 | 4,321.5 | 373.6 |
| 0N | 42 | 39 | 24 | 1 |
| 1N | 21.9 | 19.8 | 12.6 | 1 |
| 2N | 13.4 | 11.1 | 7.5 | 1 |
The 10 species with the highest IVI are shown in Table 5. These include more than 60 % of individuals, basal area, frequency, and stem density of the lianas registered in the plot, which is also reflected in the accumulated percentage of IVI (65.6 %). Forsteronia acouci (Aubl.) A. DC. (Apocynaceae) stands out above the rest since it represents about 20 % of the total IVI of the community, as well as their abundance, stem density, and basal area. The values of these variables for species between the second and fifth position of the IVI were remarkably similar but are almost three times lower than those of F. acouci. Nine species (23 %) were represented by only one individual; therefore, they contributed an exceptionally low percentage to the basal area (2 %), stem density (2.3 %), frequency (3.4 %), and IVI (2.6 %).
Table 5 Liana species sorted by Importance Value Index (IVI) in 1-ha plot at the Los Tuxtlas Tropical Biology Station. The relative values of abundance, stem density, basal area, and frequency are indicated.
| Species | Abundance | Stem density | Basal área | Subplots frequency | IVI |
|---|---|---|---|---|---|
| Forsteronia acouci | 21.0 | 19.4 | 26.5 | 11.8 | 59.3 |
| Salacia cordata | 7.8 | 7.6 | 7.2 | 8.4 | 23.4 |
| Combretum laxum | 5.8 | 5.7 | 7.6 | 5.3 | 18.8 |
| Tanaecium pyramidatum | 4. | 4.2 | 6.9 | 5.7 | 16.9 |
| Cissus gossypiifolia | 5.3 | 5.1 | 6.1 | 5.0 | 16.4 |
| Stizophyllum riparium | 6.1 | 8.6 | 3.9 | 6.1 | 16.0 |
| Mansoa verrucifera | 4.3 | 3.8 | 3.9 | 5.0 | 13.1 |
| Connarus schultesii | 4.0 | 4.2 | 3.2 | 5.0 | 12.2 |
| Ipomoea philomega | 4.0 | 3.6 | 1.7 | 5.7 | 11.6 |
| Pristimera caribaea | 4.3 | 4.0 | 2.0 | 2.7 | 9.0 |
Liana community diversity. Community diversity metrics are shown in Table 4. Although F. acouci exceeds almost three times the following species in abundance, we found a gradual decrease in the remaining species with a slope of -0.8 (-0.6 when this species is excluded). This pattern of the rank abundance curve is consistent, regardless of the minimum diameter of the included individuals in this analysis (Figure 3A). A similar trend can be observed in the diversity profiles (Figure 3B), since the effective number of species does not show a substantial decrease as the order of diversity increases. Although there is a difference of 122 individuals between the first two diameter categories, both present a similar diversity, but from a 5 cm diameter cut-off, liana diversity is reduced by almost half (Figure 3; Table 4). However, the magnitude of the decrease in diversity with respect to the diversity order is relatively homogeneous. Both rankings of species and diversity profiles reflect that the liana community has a high evenness.
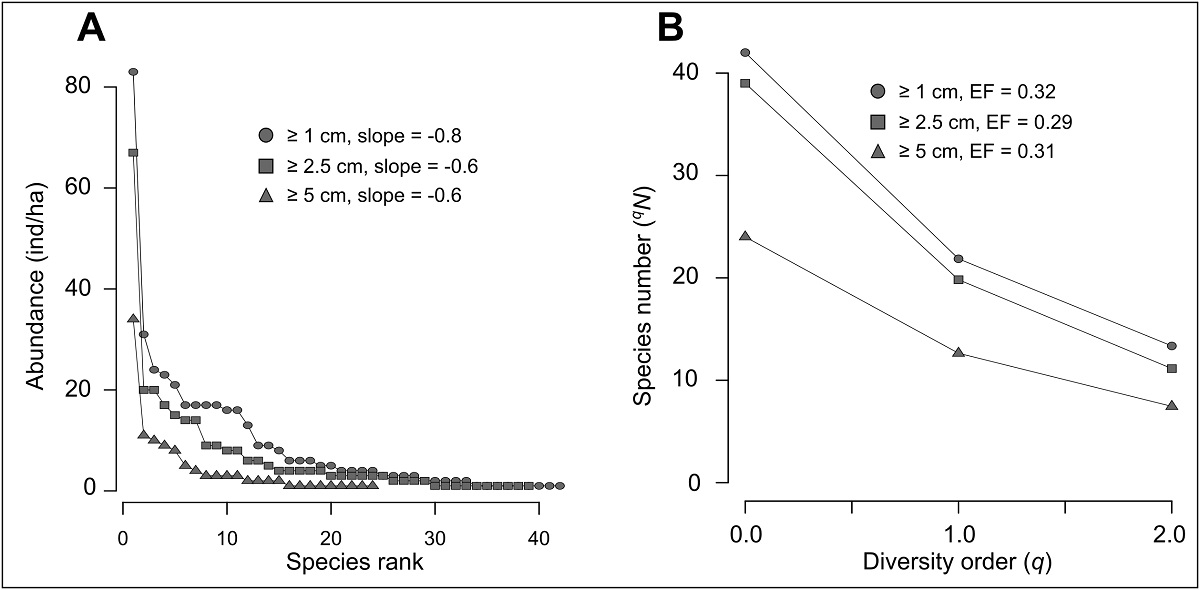
Figure 3: (A) Rank-abundance curves and (B) Alpha diversity profiles for the liana community, considering different minimum diameter cut-off. The evenness factor (EF) was calculated by dividing the number of species when q = 2 over the respective value when q = 0, so when EF ~ 1, evenness is greater.
Discussion
Community attributes of the families. The most speciose families were Bignoniaceae and Celastraceae (Table 3). This coincides in general with a previous study by Bongers et al. (1988) and is consistent with published data from a floristic perspective for Mexico (Ibarra-Manríquez et al. 2015), as well as in other censuses carried out in smaller areas within the TBS (Phillips & Miller 2002, Arroyo-Rodríguez & Toledo-Aceves 2009). Except for Menispermaceae, the families included in Table 3 have all been documented to be among the most relevant for the Neotropics (Gentry 1991a, Ibarra-Manríquez & Martínez-Ramos 2002, Macía 2008, Burnham & Romero-Saltos 2015, Ibarra-Manríquez et al. 2015, Schnitzer et al. 2015). Menispermaceae has been reported as an important family only in sites in South America, often ranking after the third position (Gentry 1991a). The importance of this family along with Apocynaceae and Celastraceae has been documented in Africa and Asia (Muthumperumal & Parthasarathy 2010, Ewango et al. 2015, Thomas et al. 2015). It is also noteworthy that Fabaceae is absent in Table 3, despite the findings that have documented that this family along with Bignoniaceae to be nearly always the most diverse in Neotropical forests (Gentry 1982, 1988, 1991b, Macía 2008, Ibarra-Manríquez & Martínez-Ramos 2002). Fabaceae only had one species in the plot (Machaerium floribundum Benth., five individuals in four subplots, 108.82 cm2 basal area, and IVI of 4.4 (Table 2) and therefore, our prediction about the importance of this family in TBS was not fulfilled.
A comparison of our results at the global level indicates that the accumulation of stem density and basal area in a few families can be invoked as a structural pattern. Studies in tropical and subtropical regions of America, Africa, and Australasia (Table 1) have documented that the first three most abundant families comprise a high percentage of these two attributes (34-48 %), although the respective percentage in the TBS was higher (59 %, Table 3). Bignoniaceae has always been reported to be among the five predominant families in exclusively neotropical sites, while, in the Paleotropic, Apocynaceae, Fabaceae, and Celastraceae are usually among the most abundant.
Liana community structure. We found that the stem density of lianas in our census plot (396 ha-1) was very similar to that previously reported by Bongers et al. (1988) (368 ha-1). These results can be explained, in part, by the relative proximity of the censuses (Figure 1). Nevertheless, studies in other regions of the world have revealed a strong variation in local stem density. For example, in two studies which surveyed three and four 1-ha plots in China (Lü et al. 2009) and India (Padaki & Parthasarathy 2000), abundance ranked between 112 and 207 stems for lianas with diameters of ≥ 2 cm and from 211 to 668 stems for those with diameters ≥ 5 cm, respectively. In a census of contiguous 18-ha plot, mean density per hectare was 547 individuals with diameter ≥ 1 cm, but standard deviation was 105.2 and 1-ha subplots ranged from 388 to 721 individuals (Thomas et al. 2015). In addition, in censuses of large plots (18-50 ha), densities of 373 to 676 lianas ha-1 (SD up to ± 141) have been reported (Figure 5). Therefore, the current liana censuses in the TBS may not allow to correctly document the variation in liana stem density and similar studies must be carried out in other areas of the reserve, for instance, those located on different soil types (Ibarra-Manríquez et al. 1997).
Regarding the fact that the number of individuals per hectare in several liana censuses world-wide in Figure 4 present a high variation (range: 75-2,471, μ = 639.7 ± SD 493.7), the values recorded in this study are among the lowest, which supports our prediction. This trend persists even though lianas from 1 cm in diameter were included in our plot, which is not the case for many of the other studies used in the comparison (Figure 4A). In the few cases for which the TBS presented higher values, the majority are localities in Australasia and/or subtropical sites with less water limitation (more precipitation and less severe dry season), which is consistent with previous patterns described (DeWalt et al. 2010, 2015). The basal area, being highly correlated with density, presented a similar trend, although this is not as evident because the values are less variable, and few studies report this attribute (Figure 4B).
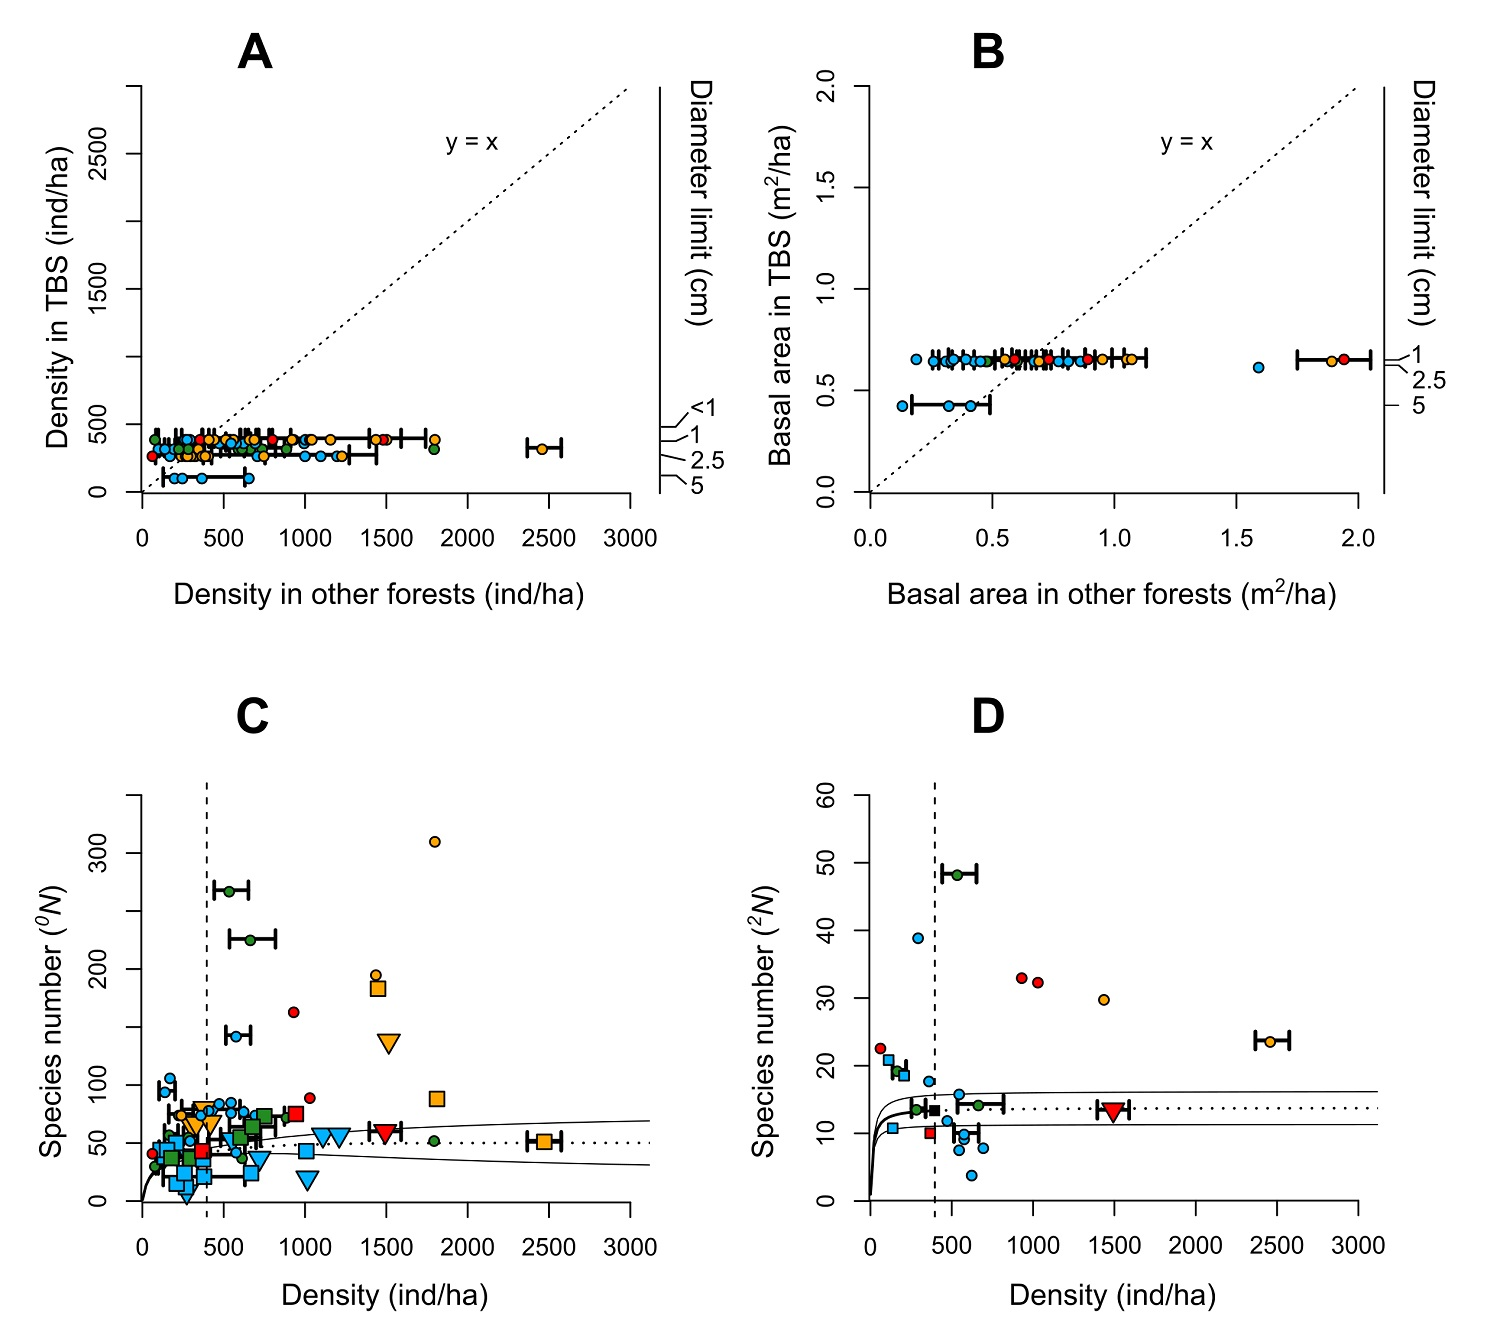
Figure 4 Structural parameters and diversity of liana community of the 1-ha plot in the Los Tuxtlas Tropical Biology Station compared with those of other tropical forests. (A) Density of individuals per hectare. (B) Basal area per hectare. (C) Species richness ( 0 N), and (D) Number of dominant species ( 2 N). The values reported for other forests were based on studies indicated in Table 1, and the respective values for the Los Tuxtlas Tropical Biology Station were recalculated considering the minimum diameter cut-off in each census. In a and b, the identity line (y = x) represents the trend that would exist if the attributes compared had the same value among other forest and our plot. A greater dispersion towards the right or left side of the line indicates higher values in other forests and our plot, respectively, of these forests regarding of the TBS values. In c and d, the diversity values were compared with the density of individuals reported in each study; the circles and triangles indicate the total values in censuses of more than 1-ha and less than 1-ha, respectively, while the squares represent values per hectare, regardless of the total area surveyed in each study. The solid black line shows the observed values (interpolation) for the 1-ha plot censused and the dotted lines represent the estimated values (extrapolation) based on Hsieh et al. (2016) and performed without correction. The colors are indicative of the continent for each study: Green (Africa), Blue (Australasia), Red (Central America), Orange (South America). For some cases, the standard deviation of the density and the basal area are shown when it was reported or was calculated based on the absolute values per hectare.
The distribution of density and basal area between diameter categories does not present the classic shape for arboreal communities. Most individuals are grouped into the three smallest categories (Figure 2C). This distribution is rather like Type 1 described by Bongers et al. (1988) for the TBS trees, in which there is good reproduction and continuous recruitment. In general, it has been described that liana communities have a low contribution to the total basal area of tropical forests as they present few individuals with diameters ≥10 cm (Hegarty & Caballé 1991, Macía 2008, Nogueira et al. 2015, Schnitzer et al. 2015). In our plot only two individuals of one species (P. aculeata) exceeded 10 cm in diameter, which differs from Bongers et al. (1988), who reported 13 individuals of nine species, representing about 4 % of the total density. This may explain why this category did not present the highest basal area (Figure 2D) as well as the lowest basal area values with respect to other locations in the world (Figure 4B).
An explanation regarding the above is that provided by Müller-Landau & Pacala (2020) who mention that for lianas with larger diameters, the transport of water and nutrients, as well as the production of new leaves, has a higher physiological cost, which could limit their dimensions. Another explanation is that some features of the host trees (e.g., the diameter and texture of the trunk, the hardness of the wood, the architecture of the crown), can determine the abundance of lianas of a certain size or with a particular climbing mechanism, and it is even probable that a phylogenetic component is involved (Vleut & Pérez-Salicrup 2005, Zulqarnain et al. 2016, Visser et al. 2018).
The liana community in our study plot was somewhat dominated by F. acouci, which almost tripled the abundance of Salacia cordata (Miers) Mennega (Celastraceae), a species which has been reported as important in other studies within the TBS (Bongers et al. 1988). This dominance trend has also been reported in other humid tropical forests (Schnitzer et al. 2015, Thomas et al. 2015). For example, in Costa Rica, Moutabea aculeata (Ruiz & Pav.) Poepp. & Endl. (Fabaceae) was recorded to have 47 individuals in a 0.78 ha census (Mascaro et al. 2004), which represents almost double the abundance of Davilla nitida (Vahl) Kubitzki (Dilleniaceae), whereas Manniophyton fulvum Müll. Arg. (Euphorbiaceae) recorded 3,287 individuals (164 ha-1) in a 20 ha census (Ewango et al. 2015), which was approximately 3.5 times more than the next most important species, Rourea thomsonii (Baker) Jongkind (Connaraceae).
Is noteworthy the fact that some of the species that were important in this study are also among the most abundant in many areas of the Neotropics. For example, Combretum laxum Jacq. (Combretaceae), F. acouci, two Bignoniaceae (Stizophyllum riparium (Kunth) Sandwith and Tanaecium pyramidatum (Rich.) L.G. Lohmann) and Tetracera volubilis L. (Dilleniaceae) are relatively abundant in Yasuní (Ecuador), Barro Colorado (Panama), La Selva (Costa Rica), and Selva Lacandona (Mexico) (Nabe-Nielsen 2001, Ibarra-Manríquez & Martínez-Ramos 2002, Mascaro et al. 2004, Macía 2011, Schnitzer et al. 2015). This is interesting because, despite the marginal location of the TBS in relation to other neotropical regions, we found similarities with respect to the dominant species of other forest sites. Burnham & Romero-Saltos (2015) mention that this pattern of dominance of species with wide distributions may reflect their high ecological tolerance to different environments.
Liana community diversity. The species richness of our 1-ha plot is almost the same as that previously recorded by Bongers et al. (1988) (43 species), although only 17 species are shared. However, this estimate must be taken with caution, since 32 % of those reported in the latter work are morphospecies. Arroyo-Rodríguez & Toledo-Aceves (2009) recorded a richness equal to that of this study (41 species and one morphospecies) in 1.5 ha census, but they only documented 113 individuals, so it can be said that the diversity was greater. In the Selva Lacandona, a less rainy and more seasonal region of Mexico, Ibarra-Manríquez & Martínez-Ramos (2002) found a greater diversity of lianas in an area similar in size to that of this study (90 species in 1.2 ha), a fact partially explained because this area is located latitudinally more toward the equator (16° N).
On a broader scale, we observed that the TBS presented a relatively low species richness ( 0 N) of lianas (Figure 4C). In Central America, a greater number of species and average individuals has been recorded (Mascaro et al. 2004, 76 species and 1,488 ind ha-1; Schnitzer et al. 2015, 75 species, 943 ind ha-1). Most of the sites in South America and the Paleotropic region present a higher average diversity per hectare, but there are some exceptions, mostly in Australasia and few in Africa (Figure 4C). We may conclude that the lower species richness of the TBS compared with other tropical rain forests on the planet confirm our prediction based on previous studies about the effects of the latitude, annual rainfall, and dry season length. However, we may point out that, in the first place, the differences in sampling methods used (minimum diameters, non-contiguous plots, types of climbing plants, etc.) may cause some bias in reported values and second, the estimations made for TBS diversity values have too high confidence intervals because of the sampling effort, so comparisons with larger areas could be inaccurate.
The low diversity of lianas documented in the TBS is confirmed when we compare the number of dominant species ( 2 N), except for some sites in Australasia (Figure 4D). It should be noted that there is less variation for this value between studies than richness ( 0 N), suggesting that the number of dominant species is similar among the different locations throughout the world regardless of area size. This could be due to the high relative evenness of liana communities that has been reported in a global scale. Schnitzer et al. (2015) mention that this quality distinguishes the liana from arboreal communities, in which there is generally a hyper-dominance of a small group of species, particularly in very diverse humid tropical forests (Hubbell 2013, 2015). Therefore, the proportion of rare liana species is much lower compared to tree species.
The low values registered for liana diversity in TBS can be attributed specially to geographical factors. Latitude is negatively related to the diversity of most of living organisms, including lianas (Gentry 1988, 1991b, Schnitzler et al. 2016). In fact, we found that there is a statistical significative effect of latitude over mean number of species per hectare in many sites around the world, and this differs between paleotropical and neotropical sites (Figure 5). We may expect a high species richness given that the total annual precipitation of the TBS is one of the highest in Mexico and Central America (~ 4,000 mm) and that this climatic variable relates positively with liana diversity globally (Gentry 1982, 1988; DeWalt et al. 2010, 2015), but the number of species registered in this study does not match with this general pattern (Figure 5). This suggests that geographical location of TBS plays a major role, however, dry season length could influence the species richness (Figure 5), but this relation needs more detailed studies in the future, because until now it may show a positive relationship or none (van der Heijden & Phillips 2009, DeWalt et al. 2015).
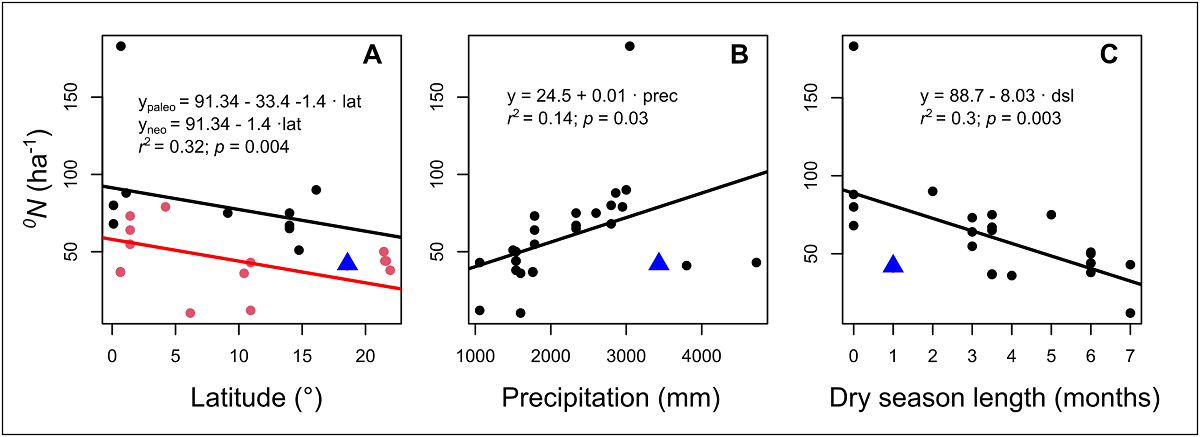
Figure 5 Relation between average species richness ( 0 N, order cero diversity) ha-1 and the latitude, mean annual precipitation, and the duration of the dry season (number of months with precipitation <100 mm) in different censuses of ≥ 1 ha in different parts of the world. The red and black symbols in latitude figure represent paleotropical and neotropical sites, respectively, which differed significantly with respect to their intercepts. The blue triangles represent the values observed in our study. Although the minimum diameter of the censuses differed (See Table 1), this did not have a significant effect on the models.
In this study, we described the composition, density, basal area, and diversity of the TBS liana community based on a 1-ha plot. Our results indicate a high concordance with the patterns that have been described for lianas in tropical forest communities worldwide, although there were some very marked and interesting exceptions. Therefore, this work represents an important contribution for evaluating the role the lianas perform in the attributes of the neotropical rain forests.

