


Servicios Personalizados
Revista
Articulo
 Inglés (pdf)
 Artículo en XML
 Referencias del artículo
 Enviar artículo por email
Indicadores
-
 Citado por SciELO
 -
 Accesos
Links relacionados
-
 Similares en
SciELO
Similares en
SciELO
Compartir

 Permalink
Revista Chapingo serie ciencias forestales y del ambiente
versión On-line ISSN 2007-4018versión impresa ISSN 2007-3828
Rev. Chapingo ser. cienc. for. ambient vol.21 no.1 Chapingo ene./abr. 2015
https://doi.org/10.5154/r.rchscfa.2014.09.041
Compatible dominant height - site index model for juniper (Juniperus deppeana Steud.)
Modelo compatible de altura dominante - índice de sitio para táscate (Juniperus deppeana Steud.)
Antonio Rodríguez-Carrillo*; Francisco Cruz-Cobos; Benedicto Vargas-Larreta; Francisco J. Hernández
Instituto Tecnológico de El Salto. Mesa del Tecnológico s/n. C. P. 34942. El Salto, Pueblo Nuevo, Durango, MÉXICO. Correo-e: ebrat_3@hotmail.com, tel.: +52 (675) 87 104 52 (*Autor para correspondencia).
Received: September 22, 2014.
Accepted: February 26, 2015.
ABSTRACT
The aim of this study was to determine the site quality of juniper (Juniperus deppeana Steud.) in the San Dimas region of the state of Durango, Mexico, using the site index method. The database comes from stem analysis of 43 trees felled in harvesting activities. The Chapman-Richards and Schumacher models, by means of the algebraic difference and generalized algebraic difference approaches, were tested to determine the site index; in addition, the error structure was modeled with a second-order autoregressive model to remedy the dependency of existing longitudinal errors. The results showed that the Chapman-Richards model in generalized algebraic difference form provided the best fit according to the adjusted coefficient of determination (R2adj = 0.98) and root mean square error (RMSE = 0.46 m). Plotting of the quality curves generated with this model, superimposed on the observed heights, corroborated the goodness of fit of the model selected. The equation obtained with the generalized algebraic difference approach directly estimates the dominant height and site index at any height and base age.
Keywords: Algebraic difference approach, generalized algebraic difference approach, Chapman-Richards.
RESUMEN
El objetivo de este trabajo fue determinar la calidad de estación de táscate (Juniperus deppeana Steud.), a través del método de índice de sitio, en la región de San Dimas, Durango. La base de datos proviene de 43 análisis troncales de árboles derribados en actividades de aprovechamiento. Los modelos de Chapman-Richards y de Schumacher, mediante los procedimientos de diferencias algebraicas y diferencias algebraicas generalizadas, se probaron para determinar el índice de sitio; además, se modeló la estructura del error con un modelo autorregresivo de segundo orden para corregir la dependencia de errores longitudinales presentes. Los resultados mostraron que el modelo de Chapman-Richards en diferencias algebraicas generalizadas presentó el mejor ajuste de acuerdo con el coeficiente de determinación ajustado (R2adj = 0.98) y la raíz del cuadrado medio del error (RCME = 0.46 m). La representación gráfica de las curvas de calidad generadas con este modelo, sobrepuestas a las alturas observadas, corroboraron la bondad de ajuste del modelo seleccionado. La ecuación obtenida con la metodología de diferencias algebraicas generalizadas estima directamente la altura dominante y el índice de sitio a cualquier altura y edad de referencia.
Palabras clave: Diferencias algebraicas, diferencias algebraicas generalizadas, Chapman-Richards.
INTRODUCTION
Evaluation of site quality, estimated through productivity indicators, is an important element in the planning and implementation of sustainable forest management programs. In this regard, several indicators have been tested in different forest types, but the most accepted for specific and homogeneous forests has been the site index, defined as the height growth at a base age (Avery & Burkhart, 2002; Payandeh & Wang, 1994; Skovsgaard & Vanclay, 2008).
Various methods have been developed for constructing site index functions; however, the most commonly used ones are the guide curve method and the algebraic difference approach. In the first, the original model is fitted to estimate the parameters applied in the functional equations to generate families of anamorphic or polymorphic curves. This type of model is the most common way to model the height-age relationship in unispecific and homogeneous stands through static equations (Cieszewski, 2001). The algebraic difference method involves fitting the parameters of the functional equation and inevitably requires periodic measurements (Torres-Rojo, 2001), forming dynamic equations (Cieszewski, 2001). Dynamic site index equations have the property of base-age invariance, so their selection has no effect on the prediction. Bailey and Clutter (1974) presented the Algebraic Difference Approach (ADA), expressing the independent variable as a function of age and the model's parameters (X = f [t, B]). This methodology is based on the assumption that the parameters of the base equation are dependent on site productivity, thereby generating families of anamorphic or polymorphic growth curves, depending on the parameter isolated from the equation. Cieszewski and Bailey (2000) proposed the Generalized Algebraic Difference Approach (GADA) from the ADA methodology. The major advantage of this method is that dynamic equations can be obtained from a base growth model, ensuring that more than one parameter depends on the specific conditions of the forest site (Cieszewski, 2001, 2002, 2003; Cieszewski & Bailey, 2000). The parameters must be expressed as functions of the site defined by a variable X (unobservable independent variable) that describes site productivity as a result of a combination of factors such as management regimes, soil conditions and ecological and climatic factors, thereby obtaining families of more flexible curves. With this generalization, families that are both polymorphic and with multiple asymptotes are obtained (Cieszewski, 2002). Selecting any of the methods described above has generated much controversy; however, in recent years greater importance has been given to developing dynamic site index functions with polymorphic curves dependent on a parameter, since it is believed that the trends of the curves model the height growth of trees with greater accuracy (Goelz & Burk, 1992; Ker & Bowling, 1991; Payandeh & Wang, 1994).
In the San Dimas region of Durango, Juniperus deppeana Steud. accounts for about 3.55 % of the authorized volume (Soto, 2009). It is widely used in the furniture and handicraft industries, and in rural areas it is used for poles and as fuel for domestic use. Since this forest region does not have scientifically-validated site index equations, the aim of this work was to construct site quality curves of J. deppeana using the generalized algebraic difference approach.
MATERIALS AND METHODS
Study area
The work was conducted in the San Dimas region comprising the municipality of the same name and a portion of the municipalities of Tamazula, Canatlán, Otáez and Durango. The study area covers about 586,000 ha in which J. deppeana is distributed in a scattered manner. The central coordinates of the area are 24° 25' 27'' NL and 105° 35' 33'' WL; the predominant altitude ranges between 2,000 and 2,800 m. The region is located in three hydrologic regions: Sinaloa, Presidio-San Pedro and Nazas Aguanaval.
Study data
A total of 273 data pairs from stem analysis of 43 dominant trees were used. The trees were selected so that they would represent all topographic, edaphic and heights above sea level conditions of the study area. Each tree was felled at the minimum possible stump height, extracting three sections from the base of the tree to diameter at breast height (1.30 m); later sections varying in length between 1.0 and 2.54 m were obtained until reaching the top of the tree. A slice was obtained from each section in which the trunk was divided, in order to count and measure the growth rings. Following the field portion of the study, the age of each section was determined and true heights were estimated with the Carmean (1972) method as modified by Newberry (1991).
Models to determine the J. deppeana site index
In the present study we fitted two models that, due to their flexibility, have been widely used in other conifers; however, this work represents the first such analysis of J. deppeana. The dominant height-age relationship was described using models based on those of Schumacher (1939) and Chapman-Richards (Richards, 1959) that have proved to be efficient for determining the site indexes of various conifer species (Castillo et al., 2013; Diéguez, Álvarez, Barrio, & Rojo, 2005; Vargas-Larreta, Álvarez-González, Corral-Rivas, & Aguirre-Calderón, 2010). Table 1 presents these models tested in their ADA and GADA expressions, from the base equations.
Analysis and comparison of models
The best model was selected on the basis of fit statistics in terms of accuracy, bias and graphical comparisons. The statistics calculated were: the adjusted coefficient of determination (R2adj) that reflects the total variability explained by the model, considering all the parameters to be estimated, the root mean square error (RMSE) that analyzes the accuracy of the estimates, and the mean bias (Ē) that evaluates the deviation of the model with respect to the observed values. Although there are debates regarding the use of R2 in nonlinear regression, the general usefulness of an overall measure of the predictive ability of the model appears to override some of these limitations (Ryan, 1997). The expression of these statistics is as follows:
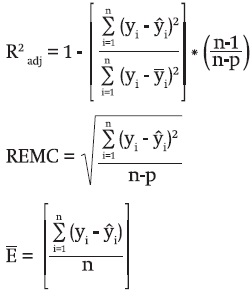
Where:
yi = Observed value
ŷi = Predicted value
ȳ = Average height value
n = Number of observations
p = Number of model parameters
In addition to the statistics described, the fit of the model-generated curves superimposed with the observed values, the residues versus the predicted values, and the graphs of the root mean square error and mean bias were analyzed.
Correcting for the autocorrelation of longitudinal errors
The possible autocorrelation of the longitudinal data was corrected using a continuous autoregressive (CAR [x]) model, which can even be used with data obtained at intervals not constant in time or space and with a different number of measurements per sampling unit (Zimmerman & Núñez, 2001). In the second-order continuous autoregressive structure (CAR [2]), the error term is expanded as:
eij = d1ρ1tij-tij-1eij-1 + d2ρ2tij-tij-2 eij-2 + εij
Where:
eij = j-th residue of the sampling unit i
dk = 1 for j > k and 0 for j = k(k = 1, 2)
ρk = k-order autoregressive parameter to estimate
t tij-tij-k = Time or distance separating the measurement j-th from the measurement j-th-k in each sampling unit tij > tij-k and is the random error.
For the site index curves, the autocorrelation is spatial (tij is the age of the measurement j in the tree i).
Methodology for fitting the site index equations
The fitting technique for estimating the parameters was a base-age invariant method called the nested iterative procedure (Tait, Cieszewski, & Bella, 1988), which was performed in accordance with the procedure of Vargas-Larreta et al. (2010). The method estimates the specific effects of the site and assumes that there are always random and measurement errors in the data, which must be modeled (Cieszewski, 2003). The simultaneous fitting of the growth equation and the error structure (given by the autoregressive model) was made with the MODEL procedure of the statistical package SAS/ETSTM (Statistical Analysis System [SAS], 2004), allowing a dynamic updating of the residues (Vargas-Larreta et al., 2010).
RESULTS AND DISCUSSION
Fitting equations using the algebraic difference approach
The mean errors (RMSE) obtained with the algebraic difference method ranged between 0.66 and 1.06 m. Table 2 presents the parameters estimated for the Schumacher and Chapman-Richards models. In this table it can be seen that the Chapman-Richards model presented the best values, showing a better fit in the polymorphic II modality (equation 5) and explaining more than 96 % of the variance in dominant height growth as a function of age. The parameters were highly significant for all equations (P < 0.01).
Differences in the goodness of fit statistics of the equations were minimal, so the graphical analysis was useful for selecting the best model, by overlapping the curves generated onto the observed data, and thus comparing the ability of each model to describe the dominant height-age relationship. Figure 1 shows the graphical analysis of the site index curves, which allowed comparing the individual height growth trends of J. deppeana. Figure 1 shows that equations 1 and 2, anamorphic and polymorphic respectively, derived from the Schumacher model, present bad fits especially at the sites of greatest productivity. On the other hand, equations 3, 4 and 5, derived from the Chapman-Richards models, in general, best describe the dominant height growth trend with a marked improvement in the anamorphic model (equation 3). The curves generated with equation 3 have more plausible asymptotic values than those generated with the rest. Although the two base models are biologically realistic because they consider a point of maximum growth (asymptote) and a growth rate, the Chapman-Richards model also considers an inflection point on the growth curve, making it more flexible (Alder, 1980).
Fitting the site index equation using the generalized algebraic difference approach
Equation 5 of Chapman-Richards (Table 1) was selected as the best model to describe the dominant height growth trend of J. deppeana, so we proceeded to fit it with the generalized algebraic difference approach, integrating a second-order autoregressive model to correct potential autocorrelation in the errors. The model explains over 98 % of the variance in dominant height growth with a mean error of 0.46 m, which is slightly lower than the values obtained by the algebraic difference method. The Durbin-Watson statistic had a value of 1.86 (very close to 2), thereby demonstrating correction of residue dependency.
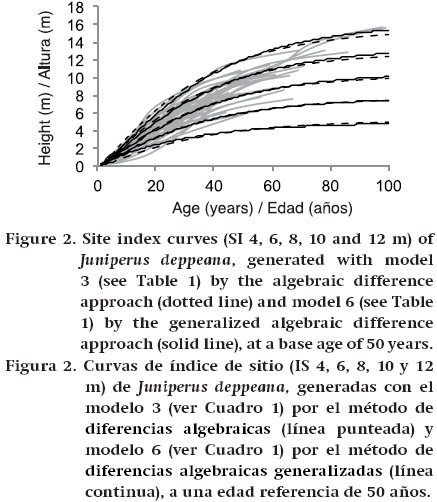
Figure 2 shows the curves obtained for site indices 4, 6, 8, 10 and 12 m at the age of 50 superimposed onto the observed data that were used in the fit. The graph shows that the curves follow the data trajectories over the entire age range and describe dominant height growth plausibly for ages over 30 years. The ADA (Table 1, equation 5) and GADA (Table 1, equation 8) equations generate similar curves, as shown in Figure 2; however, the ADA method has better fits at early ages than the GADA method. Despite this, use of the generalized algebraic difference approach is recommended since a significant gain is obtained in the goodness of fit statistics, as well as more accurate parameters.
It is important to note that, from a practical standpoint, parameters ρ1 and ρ2, used to model the error structure, are generally not used (Castillo et al., 2013; Diéguez-Aranda, Burkhart, & Amateis, 2006). The main purpose of modeling the error structure is to obtain consistent estimates of the parameters and their standard errors, while the specific parameter of site quality estimated for each individual is removed in a way similar to that of the autocorrelation process (Cieszewski, 2001); thus, the estimated height as a function of age of a new individual is directly incorporated to make predictions.
Residual analysis
Figure 3a shows the trend of the fitted model's residues without considering the autoregressive parameters. After fitting the second-order autoregressive model, the residual correlation indicator trend disappears (Figure 3c). Figure 4 shows that considering the autocorrelation correction provides the random pattern of the residues around the line 0 with homogeneous variance and without detecting a definite trend; these results agree with those obtained by Castillo et al. (2013), Vargas-Larreta et al. (2010) and Diéguez-Aranda et al. (2005).
The evolution of the bias of equation 6 is analyzed in Figure 5a. This graph shows the distribution of the predicted values around the line 0 in almost all the age classes; however, the lack of data in categories over 70 years is evident, causing a considerable increase in the bias. On the other hand, the evolution of the mean error (RMSE) by height category supports the model's presumed good prediction (Figure 5b). These results are similar to those reported by Vargas-Larreta et al. (2010).
CONCLUSIONS
The goodness of fit statistics with the ADA methodology showed significant differences between models, so it is concluded that the Chapman-Richards model presented better fits in the three modalities (anamorphic, polymorphic I and polymorphic II). When the site index curves are superimposed onto the observed data, the anamorphic model best represents the growth in all site qualities. The equation obtained with the GADA methodology is polymorphic with multiple asymptotes and base-age invariant; also, the equation directly estimates the dominant height and site index at any height and base age. Using the Chapman-Richards equation in GADA form will improve the estimation of the production potential of J. deppeana, through its incorporation into existing forest management programs for the forest region of San Dimas, Durango.
REFERENCES
Alder, D. E. (1980). Estimación del volumen forestal y predicción del rendimiento, con referencia especial a los trópicos. Roma, Italia: FAO. [ Links ]
Avery, T. E. & Burkhart, H. E. (2002). Forest measurement (5th ed.). New York, USA: McGraw-Hill. [ Links ]
Bailey, R. L. & Clutter, J. L. (1974). Base-age invariant polymorphic site curves. Forest Science, 20, 155-159. Obtenido de http://www.ingentaconnect.com/content/saf/fs/1974/00000020/00000002/art00013. [ Links ]
Carmean, W. H. (1972). Site index curves for upland oaks in the Central States. Forest Science, 18, 109-120. Obtenido de http://www.ingentaconnect.com/content/saffs/1972/00000018/00000002/art00004. [ Links ]
Castillo, L. A., Vargas-Larreta, E., Corral, R. J. J., Nájera, L. J. A., Cruz, C. F., & Hernández, F. J. (2013). Modelo compatible altura-índice de sitio para cuatro especies de pino en Santiago Papasquiaro, Durango. Revista Mexicana de Ciencias Forestales, 4(18), 86-103. Obtenido de http://revistas.inifap.gob.mx/index.php/Forestales/article/view/3003/2483. [ Links ]
Cieszewski, C. J. (2001). Three methods of deriving advanced dynamic site equations demonstrated on inland Douglas-fir site curves. Canadian Journal of Forest Research, 31, 165-173. doi: 10.1139/x00-132. [ Links ]
Cieszewski, C. J. (2002). Comparing fixed- and variable-base-age site equations having single versus multiple asymptotes. Forest Science, 48, 7-23. Obtenido de http://www.ingentaconnect.com/content/saf/fs/2002/00000048/00000001/art00002. [ Links ]
Cieszewski, C. J. (2003). Developing a well-behaved dynamic site equation using a modified Hossfeld IV function Y3 = (axm)/(c + xm-1), a simplified mixed-model and scant subalpine fir data. Forest Science, 49, 539-554. Obtenido de http://www.ingentaconnect.com/content/saf/fs/2003/00000049/00000004/art00006. [ Links ]
Cieszewski, C. J., & Bailey, R. L. (2000). Generalized algebraic difference approach: Theory based derivation of dynamic site equations with polymorphism and variable asymptotes. Forest Science, 46, 116-126. Obtenido de http://www.ingentaconnect.com/content/saf/fs/2000/00000046/00000001/art00015. [ Links ]
Diéguez, A. U., Álvarez, G. J., Barrio, A. M., & Rojo, A. A. (2005). Site quality equations for Pinus sylvestris L. plantations in Galicia (north-west Spain). Annals of Forest Science, 62, 143-152. doi: 10.1051/forest:2005006. [ Links ]
Diéguez-Aranda, U., Burkhart, H. E., & Amateis, R. L. (2006). Dynamic site model for Loblolly pine (Pinus taeda L.) plantations in the United States. Forest Science, 52(3), 262-272. Obtenido de http://www.ingentaconnect.com/content/saf/fs/2006/00000052/00000003/art00006. [ Links ]
Goelz, J. C. & Burk, T. E. (1992). Development of a well-behaved site index equation: Jack pine in north-central Ontario. Canadian Journal of Forestry Research, 22, 776-784. doi: 10.1139/x92-106. [ Links ]
Ker, M. F. & Bowling, C. (1991). Polimorphic site index equations for four New Brunswick softwood species. Canadian Journal of Forestry Research, 21, 728-732. doi: 10.1139/x91-103. [ Links ]
Newberry, J. D. (1991). A note on Carmean's estimate of height from stem analysis data. Forest Science, 37(1), 368-369. Obtenido de http://www.ingentaconnect.com/content/saf/fs/1991/00000037/00000001/art00029. [ Links ]
Payandeh, B. & Wang, Y. (1994). Relative accuracy of a new base-age invariant site index model. Forest Science, 40(2), 341-348. Obtenido de http://www.ingentaconnect.com/content/saf/fs/1994/00000040/00000002/art00011. [ Links ]
Richards, F. J. (1959). A flexible growth function for empirical use. Journal of Experimental Botany, 10, 290-301. doi: 10.1093/jxb/10.2.290. [ Links ]
Ryan, T. P. (1997). Modern regression methods. New York, USA: Jonh Wiley and Sons, Inc. [ Links ]
Statistical Analysis System (SAS Institute). (2004). SAS/ETS User's Guide, Version 9.1. Cary, NC, USA: Author. [ Links ]
Schumacher, F. X. (1939). A new growth curve and its application to timber-yield studies. Journal of Forestry, 37, 819-820. [ Links ]
Skovsgaard, J. P. & Vanclay, J. K. (2008). Forest site productivity: A review of the evolution of dendrometric concepts for even-aged stands. Forestry, 81(1), 13-31. doi: 10.1093/forestry/cpm041. [ Links ]
Soto, R. J. (2009). Estudio regional forestal UMAFOR, núm. 1006, "San Dimas". Obtenido de http://www.conafor.gob.mx:8080/documentos/docs/9/1133ERF_.UMAFOR1006.pdf. [ Links ]
Tait, D. E., Cieszewski, C. J., & Bella, I. E. (1988). The stand dynamics of lodge pole pine. Canadian Journal of Forestry Research, 18, 1255-1260. doi: 10.1139/x88-193. [ Links ]
Torres-Rojo J. M. (2001). Curvas de índice de sitio de forma y escala variables en investigación forestal. Agrociencia, 35, 87-98. Obtenido de http://www.redalyc.org/articulo.oa?id=30235108. [ Links ]
Vargas-Larreta, B., Álvarez-González, J. G., Corral-Rivas, J. J., & Aguirre-Calderón, O. (2010). Construcción de curvas dinámicas de índice de sitio para Pinus cooperi Blanco. El Salto P. N. Durango. Revista Fitotecnia Mexicana, 33(4), 343-351. Obtenido de http://www.redalyc.org/articulo.oa?id=61015520008. [ Links ]
Zimmerman, D. L. & Núñez, A. V. (2001). Parametric modelling of growth curve data: An overview (with discussion). Test, 10, 1-73. doi: 10.1007/BF0259582. [ Links ]

