nova página do texto(beta)
 Inglês (pdf)
 Artigo em XML
 Referências do artigo
 Enviar este artigo por email
 Citado por SciELO
  Similares em
SciELO
Similares em
SciELO 
 Permalink
Introduction
Rodents belonging to the genus Peromyscus have been called the “Drosophila of North American mammalogy” (Musser and Carleton 1993), and as a model system, they have long been the focus of ecological, evolutionary, systematic, and biogeographic research (e. g., King 1968; Harney and Dueser 1987; Kirkland and Layne 1989; Wolff 1996; Berl et al. 2017; Bedford and Hoekstra 2015; Lewarch and Hoekstra 2018). Peromyscus species also are of public-health interest due to their ability to serve as reservoirs for a variety of pathogens and viruses, such as hantaviruses and Lyme disease, that can be transmitted to humans (e. g., Rand et al. 1993; Childs et al. 1994; Schmaljohn et al. 1995; Song et al. 1996; Drebot et al. 2001; Oliver et al. 2006; Larson et al. 2018). Given the importance of these species to a wide variety of scientific fields, it is essential to identify and differentiate Peromyscus species accurately. However, these ecologically and medically important species are morphologically variable across their geographic range (Dice 1940), thus making accurate identification difficult.
Rigorous analytical techniques may be necessary to differentiate morphologically similar taxa. Two techniques commonly used to separate organismal groups based on morphology are traditional (linear) morphometrics and two-dimensional (2D) geometric morphometrics. Traditional morphometrics focus on linear-distance measurements of traits (usually obtained using calipers) and often incorporate size components. In contrast, geometric morphometrics is a method that primarily captures variation in shape (Rohlf and Slice 1990; Slice 2007) and requires advanced imaging of specimens from various views (e. g., ventral, dorsal, and lateral views) followed by careful placement of morphological landmarks on the image. The geometric relationships of these landmarks are then analyzed, allowing an independent analysis of shape after removing the influence of size, position, and orientation in landmark data (Rohlf and Marcus 1993; Adams et al. 2004). Geometric morphometrics are believed to have multiple benefits over traditional morphometric approaches, such as better visualization of among-group differences and provision of additional information for analysis (Breno et al. 2011). Traditional morphometrics, however, are generally more readily accessible in terms of data acquisition and have a demonstrated record of successfully differentiating taxa morphologically.
Two Peromyscus species that have been the subject of many studies involving morphological differentiation are the white-footed deer mouse (P. leucopus) and the North American deer mouse (P. maniculatus sensu lato; Bradley et al. 2019; Greenbaum et al. 2019). These species are distributed widely throughout North America, often with overlapping distributions (Kirkland and Layne 1989). Although not close phylogenetic relatives (Platt et al. 2015) and placed in different (but sister) species groups, P. leucopus and P. maniculatus are morphologically similar (Hall 1981), with tail length, extent of tail bicoloration, pelage color, hindfoot length, and ear size commonly used to differentiate these two species (e. g., Palas et al. 1992; Bruseo et al. 1999). However, both external (e. g., tail length) and cranial characters are geographically variable (e. g., Osgood 1909; Choate 1973; Choate et al. 1979; Hall 1981; Dalquest and Stangl 1983; Myers et al. 1996; Pergams and Ashley 1999; Pergams and Lacy 2008; Grieco and Rizk 2010; Holmes et al. 2016; Millien et al. 2017). This geographic variation may result in higher likelihoods of species misidentification. Thus, genetic or molecular means of identification is often necessary to confidently identify morphologically similar species such as P. leucopus and P. maniculatus (e. g., Aquadro and Patton 1980; Feldhamer et al. 1983; Rich et al. 1996; Sternburg and Feldhamer 1997; Bruseo et al. 1999; Reed et al. 2004; Tessier et al. 2004; Ridenhour and Cramer 2015; Seifert et al. 2016).
In Texas, the distributions of P. leucopus and P. maniculatus are thought to overlap throughout much of the state, often making species identification difficult (Schmidly and Bradley 2016). An examination of specimens on VertNet (9 November 2020) suggests that P. leucopus is far more common throughout the state than P. maniculatus (Figure 1). For example, there are 8,350 specimens of P. leucopus in collections, compared to 3,603 specimens of P. maniculatus, with P. leucopus recorded from 198 of Texas’ 254 counties (78 %; Figure 1a) and P. maniculatus recorded from 159 counties (63 %; Figure 1b). The Balcones fault zone (Figure 1) divides the state into distinct western and eastern regions, which are further divided into four regions based on the ecological distribution of mammals: the Trans-Pecos and Plains Country west of the fault zone and East Texas and the Rio Grande Plains including and east of the fault zone (Schmidly 1983; Davis and Schmidly 1994; Schmidly and Bradley 2016; Figure 1c). These regions differ in climate, precipitation, flora, and fauna and many species meet their western or eastern limits at the Balcones fault zone (e. g., Smith and Buechner 1947; Gehlbach 1991). According to Schmidly and Bradley (2016), approximately 18 terrestrial-mammal species occur primarily west of the Balcones fault zone, 13 species principally occur east of the Balcones fault zone, and 31 species (including P. leucopus and P. maniculatus) are distributed throughout the state. However, specimens from natural history collections, indicate that P. maniculatus is less common in East Texas (Figure 1) and is perhaps even rarer than is perceived given the difficulty in accurately identifying Peromyscus species.
A major objective of this study is to determine if P. leucopus and P. maniculatus of East Texas can be differentiated morphologically based on reference samples of genetically identified specimens of each species. This study also compares the utility of traditional (linear) and geometric morphometrics for differentiating P. leucopus and P. maniculatus and describes general morphological variation present in these species from East Texas. Lastly, the distribution of P. maniculatus east of the Balcones fault zone will be reassessed.
Materials and Methods
Specimens examined. Specimens, primarily from East Texas, were obtained from Angelo State University Natural History Collections, Texas A&M University Biodiversity Research and Teaching Collections, and The Museum of Texas Tech University (n = 61; Suplementary material 1). These specimens were identified to species by the collector or the natural history collection. To determine if traditional or geometric morphometric analyses could confidently differentiate P. leucopus and P. maniculatus from East Texas, only specimens from which genetic data were obtained (with four exceptions; see below) were included in the analyses.
Laboratory methods. Frozen tissues (stored at -20ºC) or destructive samples of toe clips, skin snips, or rib bones (stored at room temperature) were subjected to molecular assessment. DNA was extracted from frozen tissues using an Omega Bio-Tek E.Z.N.A. Tissue DNA Kit (Omega Bio-Tek, Norcross, Georgia) following manufacturer’s instructions. For destructive samples of specimens from natural history collections, all DNA extractions were performed using a QIAmp DNA Micro Kit (QIAGEN Inc., Valencia, California) in a dedicated laboratory for historical samples; this laboratory was free of recent DNA and subjected to rigorous sterilization protocols to prevent contamination. DNA extractions of historical specimens were performed following manufacturer’s instructions but also included a 24-h presoak in a 1x phosphate-buffered saline solution.
Because the mitochondrial cytochrome-b (Cytb) gene is one of the most frequently amplified and sequenced mammalian markers and is useful for differentiating Peromyscus species (e. g., Zheng et al. 2003; Dragoo et al. 2006; Lucid and Cook 2007; Gering et al. 2009; Kalkvik et al. 2012; Greenbaum et al. 2017), fragments of this gene were targeted for genetic assessments of specimens included in this study. For DNA extractions of frozen tissues, a 414 base pair (bp) fragment of Cytb was amplified using the primers MVZ04 and MVZ05 (Smith and Patton 1991) following Benedict et al. (2019). Two fragments of Cytb from destructive samples were amplified using primers designed from alignments of P. leucopus and P. maniculatus. The first fragment amplified a ca. 163 bp fragment using primers Pero53F (5’-AATGAATCCTTCATTGATCTCCCCAC-3’) and Pero216R (5’-GTAGTTKACGTCTCGGCAGAT-3’) and the second fragment amplified a ca. 130 bp fragment using primers Pero268F (5’-GAGCCTCAATATTCTTYATCTGCTT-3’) and Pero402R (5’-GATATTTGTCCTCATGGRAGTACAT-3’). In reference to the full Cytb gene, the 5’ nucleotide of Pero53F, Pero216R, Pero268F, and Pero402R occur at base 43, 206, 257, and 392, respectively (determined via alignments of lab generated sequences to P. leucopus GenBank number KY064165 and P. maniculatus GenBank number EF666219). PCR cycling parameters for Cytb fragments from DNA from frozen tissues were initialized with a 5-minute denaturation step at 95ºC, 35 cycles of 95ºC (30 s), 52ºC (60 s), and 72ºC (90c), and a final extension of 72ºC for 5 min. Cycling parameters were similar for DNA obtained from historical samples except for five additional cycles and an annealing temperature of 45ºC (or 43ºC if fragments failed to amplify). All amplified fragments (amplification success was determined via gel electrophoresis) were purified using ExoSAP-IT (USB Corporation, Cleveland, Ohio) and sequenced in forward and reverse directions using the primers listed above and ABI Prism BigDye Terminator cycle sequencing protocols (New Haven, Connecticut) at the DNA Analysis Facility on Science Hill at Yale University. Sequences were edited using Sequencher 4.10 (GeneCodes Corporation, Ann Arbor, Michigan) and compared to published sequences using the National Center for Biotechnology Information Basic Local Alignment Search Tool (BLAST). Top BLAST hits were used to determine species identifications. In our case, given the high prevalence of P. leucopus and P. maniculatus Cytb sequences on GenBank, there were > 20 sequences producing significant alignments with > 98 % identity and > 80 % query coverage when we performed our searches. All sequences were deposited to GenBank (Supplementary material 1). In total, 37 specimens of P. leucopus from 13 counties (from Denton Co. south to Willacy and Starr Cos.), and 24 specimens of P. maniculatus from seven counties (from Denton Co. south to Aransas Co.; Figure 1c; Appendix 1) were genetically identified to species and included in the morphological analyses. Four specimens of P. maniculatus failed to amplify for both Cytb fragments (three from Robertson Co. and one from Caldwell Co.); however, successful amplification and sequencing occurred for a minimum of five other specimens from the same or nearby collection locality (Supplementary material 1). We are therefore confident of their species identity and these specimens were retained for morphological analyses. Two of the 37 specimens of P. leucopus (TCWC 63781 and 63951) were identified to species by another mitochondrial gene (NADH dehydrogenase 2; from another study conducted by JEL). Laboratory methods and results of BLAST searches were similar to what was described above.
Morphological analysis. Morphological analyses were conducted using both traditional (linear) and 2D geometric morphometric techniques. All genetically identified specimens were adults, as determined by their complete dental eruptions and cheek tooth cusp patterns and wear (Koh and Peterson 1983; Rich et al. 1996). Sixteen standard morphological measurements were taken directly from the specimen tag (external measurements) or using digital calipers: total length (ToL), tail length (TL), hindfoot length (HL), ear length (EL), depth of braincase (DB), diastema length (DIA), length of incisive foramen (IFL), interorbital constriction (IOC), length of auditory bulla (LAB), mastoid breadth (MB), molar tooth row (MTR), nasal length (NL), occipital-incisor length (OIL), occipital-nasal length (ONL), post-palatal length (PPL), rostral width (RW), and zygomatic breadth (ZB; Figure 2). In some analyses described below, the ratio of tail length to head-body length (TL:TBL) was examined. We recognize that measurements recorded on specimen tags may not always be correct (especially if taken by an inexperienced collector). However, for the purposes of this study, we have accepted them as-is.
Prior to geometric morphometric analyses, specimens were photographed in ventral and lateral cranial views (Figure 2; Appendix 1). Landmark locations were selected, in part, based on previous analyses used to discriminate P. leucopus and P. maniculatus (e. g., Myers et al. 1996; Grieco and Rizk 2010; Millien et al. 2017). Both traditional characters and landmark locations were selected to emphasize rostral length and width, tooth arrangement, and zygomatic breadth, regions of cranial morphology known to differ between Peromyscus species (Rich et al. 1996; Millien et al. 2017). All landmarks were placed using tpsDig2 (Rohlf 2001). The number of specimens used in each morphological analysis (i.e., dataset) described below varied as broken specimens or those missing landmark locations were removed from the analyses (traditional morphometrics cranial and external characters: n = 29 P. leucopus and 20 P. maniculatus; traditional morphometrics cranial characters only: n = 34 P. leucopus and 22 P. maniculatus; traditional morphometrics external characters only: n = 32 P. leucopus and 22 P. maniculatus; geometric morphometrics ventral view: n = 35 P. leucopus and 23 P. maniculatus; geometric morphometrics lateral view: n = 35 P. leucopus and 18 P. maniculatus; traditional morphometrics cranial and external characters combined with geometric morphometrics ventral and lateral views: n = 27 P. leucopus and 16 P. maniculatus; Supplementary material 1); analyses including external characters were run using either ToL and TL separately or the TL:TBL ratio.
All traditional morphometric characters were transformed logarithmically to decrease the effect of individual size variation (Gould 1966; dos Reis et al. 1990) and assessed for normality; no extreme outliers were identified and there were no significant departures from a normal distribution for any of the measured characters. Similar to the findings of previous studies (e. g., Kamler et al. 1998; Pergams and Lacy 2008), secondary sexual dimorphism was not found to be associated with any of the cranial traits in either species (P > 0.05 in all Welch’s unpaired t-tests of the log-transformed traditional characters); therefore, males and females were pooled in subsequent analyses of traditional morphometric characters. In the geometric morphometric analyses, a Procrustes superimposition was applied to remove non-shape related variation associated with location, rotation, and scale on all raw landmark data (Lawing and Polly 2010; Zelditch et al. 2012). Procrustes-corrected data were ordinated using a principal component analysis (PCA). Principal component (PC) scores were extracted from these analyses as independent components of shape variation. As with the traditional morphometric data, secondary sexual dimorphism was not detected in the geometric morphometric datasets as assessed using multivariate analyses of variance (MANOVA) in association with the PC scores of each species (ventral view: F = 0.73, P > 0.05, lateral view: F = 0.99, P > 0.05); therefore, all geometric morphometric analyses were conducted with pooled sexes. Significant size-related allometry was observed using a linear regression on the geometric morphometric datasets (ventral view: F = 3.29, P < 0.01; lateral view: F = 3.50, P < 0.01). This allometric relationship did not differ significantly between the species as assessed using a multiple linear regression (ventral view: F = 0.58, P > 0.05, lateral view: F = 1.86, P > 0.05; Appendix 2); geometric morphometric analyses were conducted using both allometry-minimized and non-allometry-minimized residuals. Both traditional and geometric morphometric analyses were conducted using R version 3.6.3, with the MASS and geomorph packages (Venables and Ripley 2002; Adams et al. 2020; R Core Team 2020).
Welch’s unpaired t-tests were performed to assess differentiation between species for each individual traditional morphometric character; Bonferroni corrections were included to account for the number of individual tests. PCAs were performed on the log-transformed traditional morphometric variables using a covariance matrix (the scales of the variables are standardized after log-transformation; Croux and Haesbroek 2000). MANOVAs were conducted on both traditional and geometric morphometric datasets using PC scores to detect differentiation between species and analyses of variance (ANOVAs) were used to detect the specific PCs that differed between species. Discriminant function analyses (DFAs) were performed to determine if specimens could be separated based on the a priori hypothesis of group membership to genetically identified species. Leave-one-out cross-validation linear discriminant function analyses (DFA-CVs) also were performed to determine if a priori group membership could be appropriately predicted. In these analyses, individual specimens were assessed in an iterative process, removing each specimen from the training dataset to estimate the likelihood that it is included within either P. leucopus or P. maniculatus based on its morphology. Both DFAs and DFA-CVs were performed on all datasets (with allometry-minimized and non-allometry-minimized residuals for the ventral and lateral cranial views) as well as combined geometric and traditional morphometric datasets. For analyses including linear measurements from the traditional morphometric datasets, both the PCs of these linear measurements (as in geometric morphometrics) as well as the log transformed data were examined. For all DFAs and DFA-CVs, specimens were assigned posterior probabilities (pp) of membership to P. leucopus or P. maniculatus based on Mahalanobis distance.
Multiple logistic regressions were conducted to examine the relationship between specimen misidentification and morphology (for both traditional morphometric traits and PC scores extracted from geometric morphometric analyses). Specimen misidentification was tabulated for each specimen as a binary ‘yes’ or ‘no’ based on the specimen’s genetic identification and the identification originally assigned by the collector or natural history collection.
To further examine the distribution of P. maniculatus in Texas, data were downloaded from VertNet (accessed 17 January 2021) for all specimens with the county of collection and external measurement information (n = 386). These were then further classified as either likely correct species identification (multiple localities of multiple individuals for that county) or “suspect” (only a single locality, often with only a single individual, for that county). This “suspect” classification based on county occurrence was considered reasonable due to the rather constant geographic area of counties in eastern Texas, forming a nearly uniform grid: the 126 counties of eastern Texas (as defined here; Figure 1) average 2,302 km2, or about 50 km on a side, and a single county record could reasonably be considered of suspect identification. Suspect specimens were included as unassigned specimens in a DFA (SYSTAT 7.0, Wilkinson 1997) based on external measurements (ToL, TL, HL, and EL) with the genetically identified reference samples. Suspect specimens were assigned posterior probabilities (pp) of membership to the two reference groups based on Mahalanobis distance and grouped for comparison with those reference samples into geographic groups representing P. leucopus and the Texas subspecies of P. maniculatus: P. m. pallescens in East Texas, P. m. blandus in West and South Texas, and P. m. luteus in the Texas Panhandle. Specimens were assigned to subspecies of P. maniculatus based on geographic distribution, and differences among these taxa and the genetically identified reference groups were assessed using Tukey’s honestly significant difference post hoc tests.
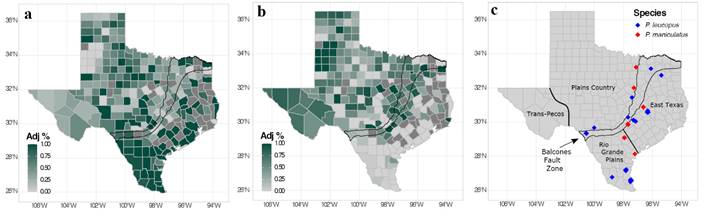
Figure 1 Heat map of specimens of Peromyscus leucopus and P. maniculatus across Texas and counties sampled per species. Percentage of specimens per county were calculated based on specimens in natural history collections (data obtained from VertNet on 9 November 2020; assumes all specimen identifications are correct). Percentages were calculated from the total number of specimens of each species across the entire state. Heat maps were generated as follows: a) percentage of P. leucopus divided by the sum of percentages of P. leucopus and P. maniculatus and b) percentage of P. maniculatus divided by the sum of percentages of P. leucopus and P. maniculatus. These adjusted percentages demonstrate the relative prevalence of specimens collected within Texas counties. c) Specimens of P. leucopus and P. maniculatus examined in this study indicated by blue and red diamonds, respectively. The Balcones fault zone is indicated with a black border.
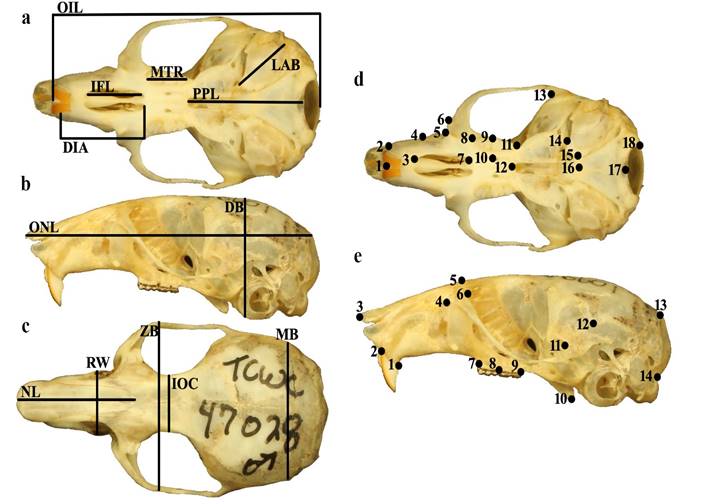
Figure 2 Traditional characters and landmark schemes used in morphometric analyses of Peromyscus specimens. Traditional morphological characters were obtained from a) ventral, b) lateral, and c) dorsal views of the skull (see text for definitions of abbreviations). Landmark schemes used in geometric morphometric analyses were obtained from d) ventral and e) lateral views of the skull (see text for anatomical definitions of landmarks).
Results
Traditional morphometrics. Welch’s Two-Sample t-tests indicated a significant difference between P. leucopus and P. maniculatus in many traditional linear characters. All cranial and external traits except length of auditory bulla (LAB) and length of incisive foramen (IFL) were significantly different between species (P < 0.001; Figure 3; Appendix 3). The first principal component (PC1) associated with the traditional characters accounted for 60.81 % of the total variation, all coefficients had the same sign, and occipital-nasal length (ONL) and occipital-incisor length (OIL) had the highest loadings (eigenvalue of PC1 = 9.73; Figure 4; Appendix 4). PC2 of the traditional morphometric dataset accounted for 9.75 % of the total variation and was primarily associated with length of auditory bulla (LAB) and length of incisive foramen (IFL; Figure 4; Appendix 4). MANOVA results indicated that PC scores of P. leucopus and P. maniculatus were significantly different (P < 0.001), including a significant difference between species associated with PC1 (P < 0.001) and PC2 (P < 0.05).
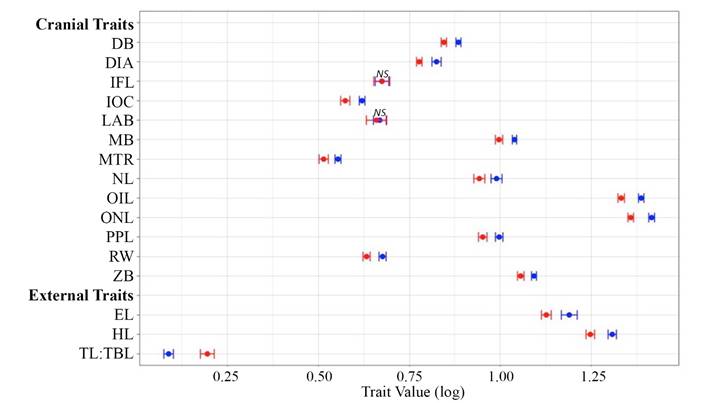
Figure 3 Traditional morphometric characters of Peromyscus leucopus and P. maniculatus (see text for definitions of abbreviations). Points represent the mean value of each trait and the associated 95 % confidence interval, where blue = P. leucopus and red = P. maniculatus. All traits, except those marked with “NS” (non-significant) were significantly different between the two species.
Table 1 Discriminate function analysis classification results conducted without (DFA) and with (DFA-CVs) leave-one-out cross-validation for all traditional and geometric morphometrics analyses and datasets. Type of data examined for each morphometric dataset is indicated.
| DFA % Correct | DFA-CVs % Correct | ||||
|---|---|---|---|---|---|
| Morphometric Analysis | Dataset | P. leucopus | P. maniculatus | P. leucopus | P. maniculatus |
| Log-Transformed Traditional Data | |||||
| Traditional | Cranial & External1 | 100 | 100 | 100 | 95 |
| Traditional | External only1 | 100 | 86.36 | 96.88 | 77.27 |
| Traditional | Cranial only | 100 | 100 | 100 | 90.91 |
| Principal Components | |||||
| Traditional | Cranial & External1 | 100 | 100 | 100 | 100 |
| Traditional | External only | 87.50 | 77.27 | 84.38 | 72.73 |
| Traditional | Cranial only | 100 | 100 | 97.06 | 95.45 |
| Geometric2 | Ventral & Lateral | 94.12 | 83.33 | 94.12 | 83.33 |
| Geometric3 | Ventral & Lateral | 73.53 | 27.78 | 73.53 | 27.78 |
| Geometric2 & Traditional | Ventral & Lateral, Cranial & External1 | 100 | 100 | 100 | 100 |
| Geometric3 & Traditional | Ventral & Lateral, Cranial & External1 | 100 | 100 | 100 | 100 |
| Log-Transformed Traditional Data & Geometric Morphometric Principal Components | |||||
| Geometric2 & Traditional | Ventral & Lateral, Cranial & External1 | 100 | 100 | 100 | 100 |
| Geometric3 & Traditional | Ventral & Lateral, Cranial & External1 | 100 | 100 | 100 | 100 |
1Results were similar regardless of if the total length and tail length external characters were examined separately, or included as a ratio of tail length to head-body length.
2Non-allometry-minimized residuals.
3Allometry-minimized residuals.
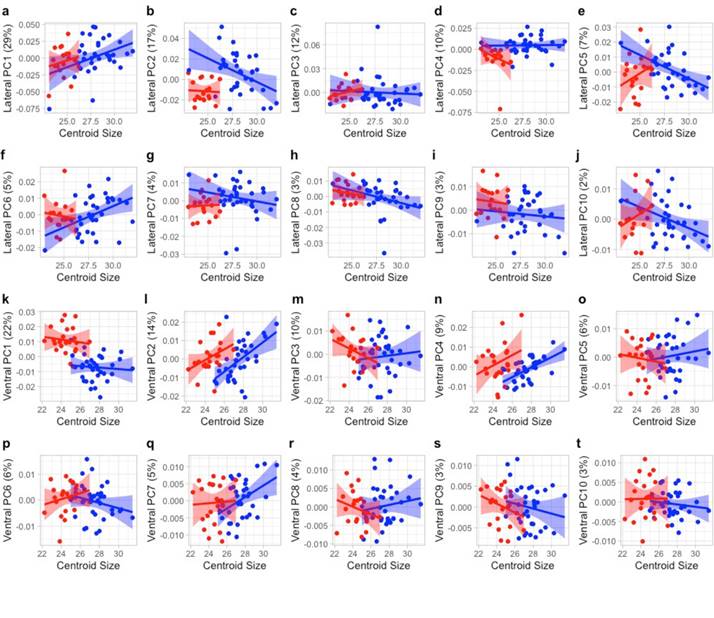
Geometric morphometrics.-Geometric morphometric analyses also detected a significant difference between P. leucopus and P. maniculatus based on cranial size and certain axes of morphology. In the ventral view, PC1 accounted for 18.46 % of the overall variation in the allometry-minimized dataset and was primarily related to the relative skull length and cheek-tooth arrangement, whereas PC2 accounted for 13.34 % of the variation and was primarily associated with the relative rostral length and skull width (Figure 4). In the lateral view, PC1 accounted for 27.94 % of the variation in the allometry-minimized dataset and was associated with cranial width and depth and PC2 accounted for 17.69 % of the variation and was associated with skull length and post-dental cranial width (Figure 4). Results were similar for analyses of non-allometry-minimized datasets (data available upon request). MANOVAs associated with the allometry-minimized ventral- and lateral view analyses failed to detect a significant overall morphological difference between the species (P > 0.05), although this relationship was significant with the non-allometry-minimized cranial views (P < 0.0001; Appendix 5). ANOVAs of individual allometry-minimized PCs detected several axes of morphological differentiation between the species, including PC1 of the ventral view (P < 0.01) and PC2 and PC4 of the lateral view (both P < 0.05). Results were similar for ANOVAs of non-allometry-minimized datasets (data available upon request).
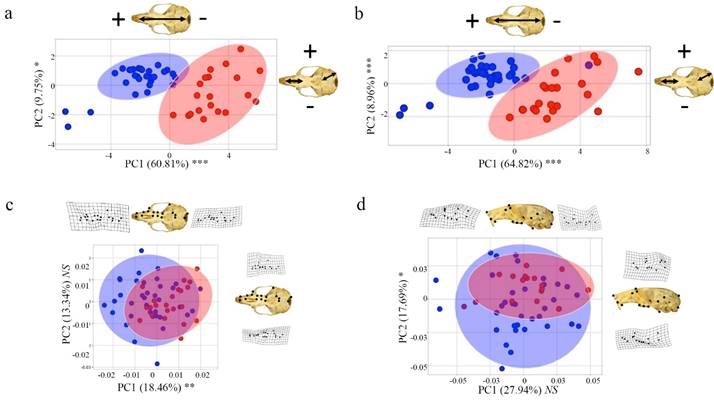
Figure 4 Principal components analysis of traditional and geometric morphometric analyses, where skull photos, arrows, and thin-plate splines represent the morphology of each PC axis. a) Traditional morphometric dataset including both cranial and external characters. b) Traditional morphometric dataset including cranial characters only. c) Ventral view geometric morphometric dataset. d) Lateral view geometric morphometric dataset. Blue = Peromyscus leucopus and red = P. maniculatus. Asterisks represent significant morphological differences at a PC axis as assessed with an ANOVA. P-value: 0.01-0.05*, 0.001-0.01**, 0-0.001*** where NS indicates non-significance. For the traditional morphometric analyses (Plates a and b), the morphology across each PC axis is associated with longer (plus sign corresponding to the skull photo) or shorter (minus sign) cranial trait characters (see Table S3 for complete PCA factor loadings). For the geometric morphometric analyses (Plates c and d), the morphology across each PC axis is represented by thin-plate splines depicting the relative configuration of the skull morphology at the extremes of each PC axis.
Specimen misidentification and distribution of P. maniculatus in Texas.-Genetic analyses revealed that 21 of 61 (34.43 %) specimens in our dataset, all P. leucopus, had previously been misidentified; 14 of these misidentified specimens are from east of the Balcones Escarpment (Appendix 1). Discriminant function analysis (DFA) on various suites of morphological characters correctly classified (posterior probability, or pp, = 1) the majority of specimens of P. leucopus and P. maniculatus to species, regardless of the dataset analyzed (e. g., cranial characters only, cranial and external characters, and combined datasets; Table 1). For DFAs of traditional morphological characters, results were similar whether PCs or log-transformed data were used, or if total length (ToL) and tail length (TL) were analyzed separately or as part of the tail length to head-to-body length ratio (Table 1). ONL, OIL, and ToL tended to have the highest factor loadings. In DFAs of exclusively external characters, TL had the highest factor loadings and no specimens were misclassified. However, in analyses of log-transformed external data, there was low certainty in the classification of three specimens of P. maniculatus (pp = 0.54 for TCWC 46975, 0.61 for TCWC 46976, and 0.66 for 46994; Appendix 1). Similarly, DFA of the PCs of the external data resulted in four specimens of P. maniculatus misclassified (TCWC 46974, 46975, 46994, and 46998), and there was low certainty of classification for four specimens of P. leucopus (pp = 0.51 for TCWC 63240, 0.67 for TCWC 63355, 0.63 for TCWC 63781, and 0.65 for TCWC 64157) and one specimen of P. maniculatus (0.72 for TCWC 46976). DFA using the non-allometry-minimized residuals of the combined ventral and lateral cranial views resulted in high confidence of classification (pp > 0.80) for both species with TCWC 56617 misclassified as a P. maniculatus and TCWC 46972 misclassified as a P. leucopus; however, all specimens were correctly classified with the inclusion of traditional morphological characters (Table 1). By far, the worst-performing dataset was that using allometry-minimized residuals of the combined ventral and cranial views (although all specimens were again correctly classified with the inclusion of traditional morphological characters). Results for the cross-validation linear discriminant function analyses (DFA-CVs) were similar to those of the DFAs, although sometimes with increased rates of misclassification (Table 1). When geometric and traditional morphometric data were combined in singular DFA and DFA-CV analyses, ventral and lateral cranial views had the highest factor loadings.
Multiple logistic regressions did not detect a significant association between species misidentification and morphology in either the traditional or geometric morphometric analyses (including both allometry-minimized and non-minimized datasets). However, when conducted using exclusively traditional external morphometric characters (ToL, TL, HL, EL, and TL:TBL), multiple logistic regression detected a significant relationship between species misidentification and hindfoot length (P < 0.01), where specimens of P. leucopus with the longest hindfoot length were more likely to be misidentified (Figure 5).
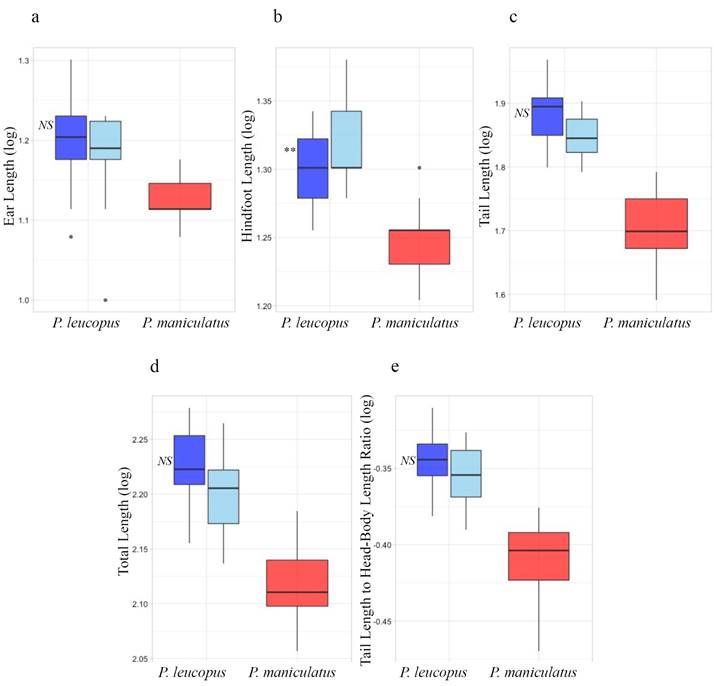
Figure 5 Specimen misidentification based on external traditional morphometric characters. a) Ear length, b) Hindfoot length, c) Tail length, d) Total length, and e) Tail to total length ratio; blue = Peromyscus leucopus and red = P. maniculatus. For P. leucopus, the darker shade of blue indicates specimens that are genetically P. leucopus and were correctly identified by the collector or natural history collection; light blue indicates specimens that are genetically P. leucopus but were misidentified in natural history collections as P. maniculatus; asterisks represent a significant association between morphology and misidentification as assessed with a Multiple Logistic Regression conducted with tail length and total length external characters considered separately (Plates a-d) and with tail length and total length external characters considered as a ratio (Plate e). P-value: 0.01-0.05*, 0.001-0.01**, 0-0.001*** where NS indicates non-significance.
For the additional specimens downloaded from VertNet with county of collection and external measurement information, of the 56 counties of eastern Texas from which P. maniculatus has been recorded, 29 were represented by a single locality, and 17 of those 29 were represented by a single specimen. Twelve of these single sample, single site records are from south or considerably east of the fault zone indicating that P. maniculatus may not be common in this region of Texas. Four taxonomic groups were compared in the DFA based on external measurements only (Figure 6): P. m. blandus (n = 99), P. m. luteus (n = 119), and the reference groups of P. m. pallescens (n =22) and P. leucopus (n = 32). All taxonomic groups were significantly different (P < 0.01) from one-another with the exception of P. m. blandus and P. leucopus (P = 0.687). Specimens of suspect identification as P. m. pallescens (n = 30) from 16 counties in East Texas were assigned to either P. maniculatus (n = 20 from eight counties) or P. leucopus (n = 10 from eight counties) with a posterior probability (pp) of > 0.75. Specimens with suspect identification as P. m. blandus (n = 17) from six counties in the Río Grande Plains were assigned to P. leucopus (pp > 0.90). However, it is not possible to distinguish this subspecies from P. leucopus based on external measurements alone, and these localities remain as undetermined species (Figure 6). An additional 13 specimens from four counties were assigned with a lower pp and were excluded from further consideration.
Discussion
This study resulted in several main findings: 1) genetically identified specimens of P. leucopus and P. maniculatus from east of the Balcones fault zone in Texas can be differentiated morphologically based on size; 2) both traditional and geometric morphometric techniques can be used to differentiate these species; 3) many of the specimens of P. leucopus used in this study were originally misidentified as P. maniculatus; and 4) P. maniculatus appears to be rare in East Texas.
Morphological species differentiation. Results from this study generally support that analysis of a suite of morphological characters can successfully differentiate P. leucopus and P. maniculatus (Figure 4; Table 1). Although multiple traditional morphological characters can be used to differentiate P. leucopus and P. maniculatus (Figure 3), it is unlikely that these two species can be consistently differentiated based on any one morphological character alone, similar to findings from previous studies (e. g., Choate 1973; Choate et al. 1979; Stromberg 1979; Feldhamer et al. 1983; Thompson and Conley 1983; Rich et al. 1996; Kamler et al. 1998; Lindquist et al. 2003; Reed et al. 2004; Stephens et al. 2014; Millien et al. 2017). For example, although length of incisive foramen (IFL) and length of auditory bulla (LAB) were not significantly different between P. leucopus and P. maniculatus when assessed individually in the traditional morphometric analyses (Figure 3), these two characters were significant (P < 0.05) drivers of PC2, which differed significantly (P < 0.05) between the species (Figure 4).
Field researchers often rely on individual external characters such as hindfoot length, ear length, tail length, or the ratio tail length to head-body length for identification of P. leucopus and P. maniculatus. The utility of these characters, however, often varies with geography. Some studies have used external characters to successfully differentiate P. leucopus and P. maniculatus (e. g., Kamler et al. 1998; Ridenhour and Cramer 2015) whereas other studies were not successful (e. g., Feldhamer et al. 1983; Stromberg 1979; Palas et al. 1992; Stephens et al. 2014). Given the variation in the utility of external characters to differentiate P. leucopus and P. maniculatus, reliance on these characters may be associated with species misidentification (see below). Although this study shows genetically-identified P. leucopus and P. maniculatus can be correctly classified with greater than 80 % confidence when exclusively using external characters, low certainty of classification and misclassification of individual specimens still occurred (Table 1). This finding provides additional support for caution when using exclusively external characters to differentiate these two morphologically similar species.
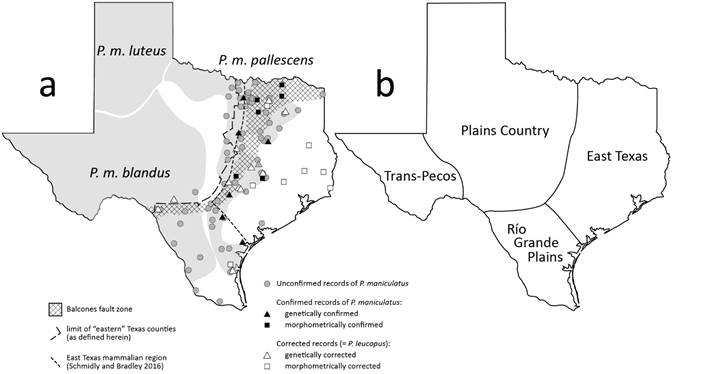
Figure 6 a) Geographic distribution of Peromyscus maniculatus (sensu lato) in Texas (shading), modified from Hall (1981), Bradley et al. (2019), and Greenbaum et al. (2019) based on VertNet localities. b) Mammalian regions of Texas (Schmidly and Bradley 2016).
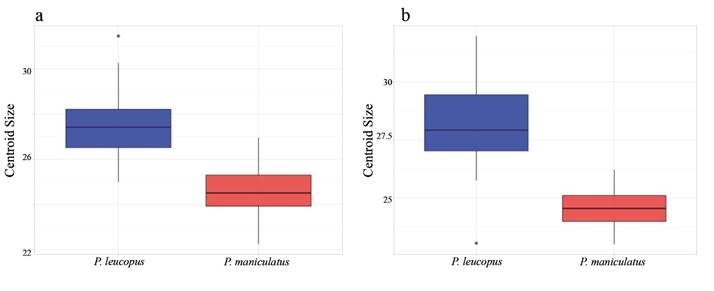
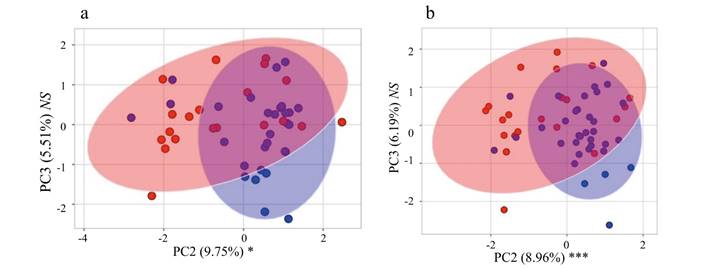
Size appears to be especially important when differentiating P. leucopus and P. maniculatus in East Texas; there is minimal overlap of these species in principal component morphospace (Figures 4a and 4b) and all or nearly-all specimens were correctly classified in discriminant function analyses when including datasets that accounted for size (Table 1). Examination of centroid sizes for both ventral and lateral views from geometric morphometrics (the square root of the sum of squared distances between each landmark and the geometric center of the landmark scheme; Zelditch et al. 2012), which primarily examines size, revealed clear separation between P. leucopus and P. maniculatus (Appendix 6). However, when size is removed from principal component analyses, there is substantially more species overlap in morphospace. This can be seen when examining PC2 and PC3 of the traditional morphological characters (Appendix 7) and PC1 and PC2 of the geometric morphometric datasets (Figures 4c and 4d). Additionally, species misclassification when analyzing allometry-minimized residuals (which reduces the effect of size relative to shape) of ventral and lateral cranial data was substantially higher than when analyzing non-allometry minimized residuals (Table 1). Shape can still be used to differentiate P. leucopus and P. maniculatus (DFAs as well as PCs of the ventral and lateral views of the skull having the highest factor loadings when geometric and traditional morphometric data were combined in DFA and DFA-CV analyses), but it appears to be less important than size in differentiating these two species in this region. Given that P. leucopus and P. maniculatus last shared a common ancestor approximately 2.5 million years ago (Platt et al. 2015; Bradley et al. 2019) and are separated by at least eight speciation events (Greenbaum et al. 2019), the overall morphological similarity in shape observed between these two species is consistent with a hypothesis of remarkable convergent evolution between these two species. Mitochondrial DNA data from P. maniculatus sensu lato has been hypothesized to represent multiple, cryptic species across its geographic range (reviewed in Bradley et al. 2019 and Greenbaum et al. 2019) and it is unknown if there are reliable and consistent morphological differences among these putative species.
Traditional and geometric morphometrics. Both traditional and geometric morphometric techniques can be used to differentiate these species, primarily based on size as described above. Traditional morphometrics are by far the more common methodology used to morphologically differentiate mammalian species and continue to be a reliable and efficient way to examine morphological differentiation. Geometric morphometric techniques are primarily used to examine the inter-relationship across multiple landmark locations, reducing the influence of rotation, location, and scale to explore shape exclusive of size (Lawing and Polly 2010; Zelditch et al. 2012), thereby offering a novel way to examine morphological shape. In addition to our study, geometric morphometric analyses of other cranial and mandibular views have been useful in differentiating P. leucopus and P. maniculatus in other geographic regions (e. g., width of skulls and size of braincases in Berens 2015; length and width of the rostrum and the position of the anterior margin of the tooth row; Millien et al. 2017) and with other rodent species (e. g., expanded crania in Camargo et al. 2019; thickness of mandibles and shapes of mandibular processes in Rowsey et al. 2019). Future workers attempting to differentiate P. leucopus and P. maniculatus across their geographic range therefore have options regarding types of data to collect and analyses to perform.
Specimen misidentification and P. maniculatus distribution in Texas. Over a third of the specimens examined in this study initially were misidentified. This is alarming given the use of Peromyscus specimens in a wide variety of ecological and evolutionary studies as well as the economical and medical importance of P. leucopus and P. maniculatus as reservoirs for disease-causing pathogens. Some of these misidentifications are apparently the result of over-reliance on certain traits, such hindfoot length (Figure 5). Specimens of P. leucopus with relatively long hindfoot measurements were more likely to be misidentified, a surprising result given that P. maniculatus has comparatively shorter hindfeet. These results imply that specimens measured incorrectly or with unusual body proportions may be more likely to be misidentified.
This study resulted in the reassignment of specimens of P. maniculatus to P. leucopus from localities in 19 Texas counties, five of which were among the few supposed records of P. maniculatus located east of the Balcones fault zone (Figure 6). These corrections were based on either molecular sequences (12 localities in 11 counties; Supplementary material 1) or the significantly larger external measurements observed in VertNet specimens from P. leucopus versus P. maniculatus (8 localities in 8 counties; Kleberg, Lee, Montgomery, Nagadoches, Orange, Polk, Rockwall, and Tyler Cos.). Because only external characters from VertNet were examined, juvenile P. leucopus (being smaller) might be mistaken for P. maniculatus, and localities that could not be assigned to species may represent a mixture of juvenile and adult P. leucopus, mixtures of the two species, or simple errors in measurements. Additional research should examine skull and dental morphology of these specimens to determine appropriate age classes such that external characters can be more confidently used in future analyses (but see results above recommending use of a suite of morphological characters to differentiate P. leucopus and P. maniculatus).
It is clear that P. maniculatus is far less common east of the Balcones fault zone than was previously thought (Figure 6). Museum records previously indicated that P. maniculatus occurred in 21 counties east of the Balcones fault zone; records from 10 of those 21 counties have been reidentified as P. leucopus, four based on genetics (Bastrop, Brazos, Kenedy, and Milam Cos.) and six based on external morphology (Kleberg, Montgomery, Nagadoches, Orange, Polk, and Tyler Cos.). In addition to the remaining unconfirmed species records from 11 counties east of the fault zone, there are several specimens from localities from southern Texas (Figure 6) that may eventually be determined to be either P. leucopus or P. maniculatus. Thus, the Balcones fault zone may limit the distribution of P. maniculatus in Texas, as it does for many other taxa and that different climates, flora, and fauna across the four major regions in Texas (Trans-Pecos, Plains Country, East Texas, and Rio Grande Plains), and may additionally delimit the distribution of cryptic species within P. maniculatus (Bradley et al. 2019; Greenbaum et al. 2017, 2019). Future research with increased sampling is needed to determine the geographic range of “P. maniculatus” species in Texas.
The level of specimen misidentification observed herein is also of concern to natural history collections and researchers using specimens from these collections; large numbers of specimens in collections may be misidentified. Researchers, curators, and collections managers could use the same morphometric methods as described in this study to verify the species identification. Care should be taken, however, to recognize that P. leucopus and P. maniculatus are morphologically variable across their geographic range and the methodologies used in this study may not result in similar findings if used in different geographic areas even though use of a suite of morphological characters has repeatedly been shown to accurately differentiate these species (e. g., this study; Choate 1973; Choate et al. 1979; Stromberg 1979; Feldhamer et al. 1983; Thompson and Conley 1983; Rich et al. 1996; Kamler et al. 1998; Lindquist et al. 2003; Reed et al. 2004; Stephens et al. 2014; Millien et al. 2017). Researchers trying to assess identification of unknown specimens will need to adjust their analyses accordingly (e. g., use a base dataset including genetically-known specimens such as used in this study and include “unknown” specimens in PCAs and DFAs). Field ecologists and others working with specimens of Peromyscus in the field should consider recording additional data at the site of capture, such as external measurements in the field as well as habitat of collection, because P. leucopus and P. maniculatus are known to differ in their habitat preferences. To be truly confident in species identifications of P. leucopus and P. maniculatus in East Texas and possibly throughout their range, genetic or molecular tools are likely to be the most accurate methodology.
Determination of the distribution and relationships of the taxa within P. maniculatus sensu lato in Texas will depend on additional genetic sampling and responsible collecting efforts, possibly via novel collaborations with field courses and wildlife agencies (McLean et al. 2016; Cook and Light 2019; Miller et al. 2020). Newly collected specimens accessioned into natural history collections are vital to the future of organism-based research. These specimens can be invaluable for a variety of disease ecology, evolutionary, and distributional studies, especially those examining fairly common species such as P. leucopus and P. maniculatus in eastern Texas.