


 nova página do texto(beta)
 Inglês (pdf)
 Artigo em XML
 Referências do artigo
 Enviar este artigo por email
 Citado por SciELO
  Similares em
SciELO
Similares em
SciELO 
 Permalink
Introduction
The majority of studies on bat richness have focused on the roles of spatial scales and sampling methods (Bergallo et al. 2003; Meyer et al. 2011; Skalak et al. 2012) as well as the relationships between richness and different environmental parameters (McCain 2007; Tello and Stevens 2010; López-González et al. 2012; Schoeman et al. 2013; López-González et al. 2015). Other studies have evaluated the effects of habitat deterioration on richness at the local, regional or global level (Estrada et al. 1993; Estrada and Coates-Estrada 2001; Mehr et al. 2011; Frey-Ehrenbold et al. 2013). In recent years, the study of biological richness has acquired greater relevance as a means for evaluating the impacts of global environmental changes and human activities, wherein more robust and reliable estimates using new approaches are required in order to improve analyses (Henry et al. 2010; Bellamy et al. 2013). Also, in the last two decades greater attention has been placed on the adaptive responses of bats to habitat heterogeneity in addition to the effects of habitat modification on functional and phylogenetic diversity (Soriano 2000; Stevens et al. 2003; Roncancio and Estevés 2007; Cisneros et al. 2014; Melo et al. 2014; Aguirre et al. 2016; Scheiner et al. 2016).
The systematics and the anatomy of bats have been widely studied as well as different aspects of their behavior, physiology and ecology (Altringham 1997; Crichton and Krutzsch 2000; Neuweiler 2000; Kunz and Fenton 2003; Simmons 2005; Fenton and Simmons 2015). Compared with other mammals, bats are small in size and have great longevity, a relatively long gestation period and a low reproductive rate (Brunet-Rossini and Austad 2004). Bats occupy a wide variety of habitats and roost in both natural and manmade structures and are adapted to living in specialized or somewhat uncommon environments and are highly responsive to environmental variables. Finally, bats can perform long-distance movements of various kilometers on a daily basis and are capable of extensive migrations (Findley 1993). Notwithstanding the biological distinctiveness of bats and their great capacity of displacement, it is expected that bats present common patterns in their distributions that are regionalized and influenced by biotic and abiotic interactions.
Bat distribution patterns have been little studied, mainly due to logistical and methodological limitations. One of the most recurrent problems was the limited occurrence records to characterize the species’ range. Others more complex, were to scale the occurrence data to the characteristics of the life history (e. g., vagility), the issues of environmental variable selection and the lack of models to analyze them jointly (Phillips et al. 2006; Rondinini et al. 2006; Segura-Trujillo and Navarro- Pérez 2010).
Mexico is considered a megadiverse country due to the large number of plant and animal species that inhabit its territory (Arita 1997; Ceballos et al., 1998; Sarukhán et al. 2014). This diversity results from the geographical position, geological history and the rugged topography of Mexico, which create a diverse mosaic of environmental and microenvironmental conditions. In Mexico, 512 species of terrestrial mammals have been recorded (Álvarez-Castañeda et al. 2017), and their general distribution at the species level has been largely mapped since the last half of the past century (Hall and Kelson 1959), enabling richness patterns to be studied. Such information has also been used to propose various biogeographical regions for the country, the majority of which are predominantly based on the distributions of terrestrial mammals (Ramírez-Pulido and Castro-Campillo 1990, 1993; Arita 1993, 1997; Arriaga et al. 1997; Escalante et al. 2002; Escalante et al. 2003; Escalante et al. 2007). Unquestionably, these studies have contributed towards increasing knowledge of the country’s biogeography but have often excluded or marginalized bats based on their biological differences, the size of their distribution areas and their capacity for widespread movement.
Biogeographical works carried out specifically on Mexican bats are scarce: Arita and Ortega (1998) have proposed that the richness and diversity of bats responds to a latitudinal gradient; Wang et al. (2003) made a species richness prediction map for the chiroptera in the state of Michoacán using temperature, precipitation, soil and vegetation environmental data. López-González et al. (2012) proposed that the distribution of bats along environmental gradients is determined by characteristics of the species group present in a site and not for the study areas defined arbitrarily which confine them. Grimshaw and Higgins (2017) analyzed the correlation of the phylogenetic structure in Mexican bat communities with environmental factors as temperature, precipitation, latitude, and longitude.
In this context, the distribution of bat richness at taxonomic levels not previously evaluated is important for understanding how bats relate to the biogeographical regions proposed for Mexico. In addition, more in-depth analyses are needed on the influence of important environmental variables (latitude, climate and vegetation) on the structuring of bat richness patterns. Bats are particularly sensitive to habitat destruction and to environmental changes, although it also has been reported that the response of bats to change in land use is varied and depends on the taxonomic group (García-Morales et al. 2013). A precise map of their species richness patterns will enable the variation in such patterns to be better understood and aid in the design of effective regional conservation schemes.
The development of Geographic Information Systems (GIS) along with geostatistical methods and the wide availability of species occurrence records in online databases enable the in-depth analysis of spatial correlations among variables using diverse functions that estimate or predict the values and the distribution of a property across space and time. The Kriging method facilitates the interpolation of different variables, allows spatial estimation for prediction of values in areas where data is not available, based on a limited number of points obtained from a sample, useful for the analysis of species patterns distributions (Fortin et al. 2005; ESRI 2006; Tittensor et al. 2010; Hortal and Lobo 2011; Henríquez et al. 2013; Tapia-Silva et al. 2015). Kriging appears to be appropriate for the creation of thematic maps for visualizing zones of greatest species richness under the combined effect of some variables.
The present study had the following objectives: 1) evaluate the spatial variation in bat richness in Mexico, both overall and at the family level. 2) Quantify overlapping species occurrences and corresponding richness values in order to statistically model and generate bat richness maps at different taxonomical levels. 3) Explore the relationship of bat richness with different environmental factors and with the complex biogeographic regions proposed for Mexico. 4) Identify areas of interest with high diversity.
Material and Methods
Databases. Locality records for bats in Mexico were obtained from the online database of the Global Biodiversity Information Facility (GBIF; http://www.gbif.org accessed in January 2016). Only georeferenced distribution records supported with specimens deposited in scientific collections, either national or foreign, were considered. The data were reviewed with respect to their geographical distribution and nomenclatural status according to Medellín et al. (2008) and Álvarez-Castañeda et al. (2015). Island records were eliminated as well as reports outside the known geographic distribution of species. Species sampled in less than five localities were not included under the assumption that such records were not sufficient for representing the overall distribution of a species. The edited data set was exported to a database constructed in MS Excel 2011. The database was composed of 6,979 presence records corresponding to 97 species belonging to eight families of Chiroptera distributed throughout Mexico (Table 1), which represents 70.3 % of the 138 species registered for the country (Álvarez-Castañeda et al. 2017). The 39 species omitted from the analysis is due to that for some of them there are no records in GBIF, others have fewer than five records and also the families represented by a single species cannot be considered in the geostatistical method used.
Table 1 Families of Mexican bats considered in this study with their number of species and localities. The data were obtained from an analysis of the information deposited in the online database Global Biodiversity Information Facility (GBIF http://www.gbif.org/ - Accessed January 2016)
| Emballonuridae: Species 7 Localities 373 | ||||
|---|---|---|---|---|
| Balantiopteryx io | 25 | Peropteryx macrotis | 30 | |
| Balantiopteryx plicata | 201 | Rhynchonycteris naso | 17 | |
| Diclidurus albus | 9 | Saccopteryx bilineata | 84 | |
| Peropteryx kappleri | 7 | |||
| Molossidae: Species 12 Localities 27 | ||||
| Eumops ferox | 11 | Nyctinomops aurispinosus | 14 | |
| Eumops perotis | 6 | Nyctinomops femorosaccus | 36 | |
| Eumops underwoodi | 13 | Nyctinomops laticaudatus | 27 | |
| Molossus molossus | 24 | Nyctinomops macrotis | 16 | |
| Molossus rufus | 25 | Promops centralis | 7 | |
| Molossus sinaloae | 20 | Tadarida brasiliensis | 226 | |
| Mormoopidae: Species 4 Localities 778 | ||||
| Mormoops megalophylla | 330 | Pteronotus parnellii | 232 | |
| Pteronotus davyi | 139 | Pteronotus personatus | 77 | |
| Natalidae: Species 1 Localities 172 | ||||
| Natalus mexicanus | 172 | |||
| Noctilionidae: Species 1 Localities 41 | ||||
| Noctilio leporinus | 41 | |||
| Phyllostomidae: Species 38 Localities 3960 | ||||
| Dermanura azteca | 34 | Glossophaga leachii | 69 | |
| Dermanura phaeotis | 189 | Glossophaga morenoi | 18 | |
| Dermanura tolteca | 176 | Glossophaga soricina | 543 | |
| Anoura geoffroyi | 100 | Glyphonycteris sylvestris | 9 | |
| Artibeus hirsutus | 61 | Hylonycteris underwoodi | 15 | |
| Artibeus jamaicensis | 442 | Leptonycteris nivalis | 51 | |
| Artibeus lituratus | 347 | Leptonycteris yerbabuenae | 110 | |
| Chrotopterus auritus | 11 | Macrotus californicus | 73 | |
| Choeroniscus godmani | 14 | Mimon cozumelae | 16 | |
| Choeronycteris mexicana | 114 | Musonycteris harrisoni | 13 | |
| Carollia perspicillata | 90 | Micronycteris microtis | 32 | |
| Carollia subrufa | 90 | Macrotus waterhousii | 73 | |
| Chiroderma salvini | 45 | Phyllostomus discolor | 32 | |
| Chiroderma villosum | 32 | Platyrrhinus helleri | 24 | |
| Centurio senex | 59 | Sturnira parvidens | 333 | |
| Diphylla ecaudata | 35 | Sturnira hondurensis | 123 | |
| Desmodus rotundus | 420 | Trachops cirrhosus | 24 | |
| Enchisthenes hartii | 13 | Uroderma bilobatum | 47 | |
| Glossophaga commissarisi | 76 | Vampyrodes caraccioli | 7 | |
| Thyropteridae: Species 1 Localities 5 | ||||
| Thyroptera tricolor | 5 | |||
| Vespertilionidae: Species 33 Localities 1623 | ||||
| Antrozous pallidus | 86 | Myotis keaysi | 30 | |
| Corynorhinus mexicanus | 17 | Myotis nigricans | 39 | |
| Corynorhinus townsendii | 10 | Myotis peninsularis | 8 | |
| Eptesicus furinalis | 44 | Myotis planiceps | 6 | |
| Eptesicus fuscus | 186 | Myotis thysanodes | 32 | |
| Idionycteris phyllotis | 7 | Myotis velifer | 191 | |
| Lasiurus blossevillii | 22 | Myotis vivesi | 42 | |
| Lasiurus borealis | 50 | Myotis volans | 29 | |
| Lasiurus cinereus | 57 | Myotis yumanensis | 60 | |
| Lasiurus ega | 75 | Nycticeius humeralis | 20 | |
| Lasiurus intermedius | 43 | Pipistrellus hesperus | 170 | |
| Lasiurus xanthinus | 14 | Pipistrellus subflavus | 9 | |
| Myotis auriculus | 21 | Rhogeessa aeneus | 5 | |
| Myotis californicus | 127 | Rhogeessa bickhami | 5 | |
| Myotis elegans | 11 | Rhogeessa parvula | 78 | |
| Myotis evotis | 10 | Rhogeessa tumida | 59 | |
| Myotis fortidens | 60 | |||
Study area. The area of continental Mexico (32° 43’ 06’’ N, -114° 45’ W; 14° 32’ 27’’ N, -92° 13’ 0’’ W), which covers an area of 1,964,375 km², was considered in the analysis. The Comisión Nacional para el Conocimiento y Uso de la Biodiversidad (CONABIO), based on Rzedowski (1990), has proposed nine main vegetation types for Mexico, of which eight were used in our analysis, because the aquatic and sub-aquatic vegetation type was excluded. Also, we employed the 13 main climatic types recognized by García (1998). For the biogeographic regionalization we used the map of Morrone (2005) which depicted 14 biotic provinces according to their ecology and ecological history, and supported by the overlapping distributions of different groups of species.
Determination of richness patterns. A map was created for Mexico (INEGI, scale 1:1,000,000) using the WGS 84 (World Geodetic System 84) datum and was divided into quadrants of 1°x1°, resulting in 253 cells with their respective identification according to Hansen (1997). Bat records were assigned to a cell based on their georeferenced coordinates, and this was also performed independently for each family of bats, regardless of the number of specimens or the date of collection. These records were overlapped with the following data layers: vegetation types, scale1:250,000; climate types, scale1:1,000,000; and biotic provinces, scale1:4,000,000. The layer of biotic provinces was built by digitizing the map of Morrone (2005); the vegetation and climate layers were obtained from the CONABIO portal (http://www.conabio.gob.mx/informacion/gis/).
Geostatistical interpolations of the spatial data were performed with Surfer 11 (Golden Software, Golden, CO, USA) and exported into QGIS software v. 2.12.2 (http://www.qgis.org) to obtain bat richness values and to generate the corresponding maps for the 96 species and independently for members of the families Emballonuridae, Molossidae, Mormoopidae, Phyllostomidae and Vespertilionidae. The families Natalidae, Noctilionidae and Thyropteridae were included only in the overall richness assessment because each is represented by only one species in Mexico.
To determine the best model to apply for each family and for the group as a whole, a cross-validation analysis was performed for each semivariogram model generated by the OK tool. Because the best model is that whose error measure is closest to zero (Díaz 2002), the selected model for the Order Chiroptera (all species together) was circular (error = 0.0001), while a spherical model was selected for the family Mormoopidae (error = 0.037) and an exponential model for the families Emballonuridae, Molossidae, Phyllostomidae and Vespertilionidae (error = 0.034; 0.038; 0.000 and 0.006 respectively; Figure 1).
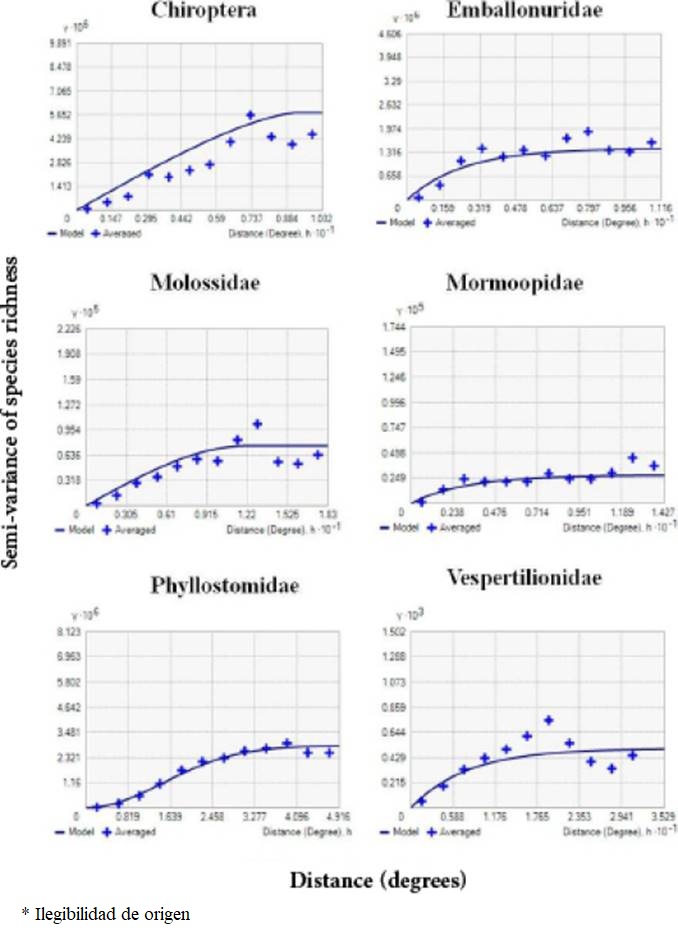
Figure 1 Cross-validation for selecting each semivariogram model generated by ordinary kriging. A circular model was selected for the Chiroptera order (error = 0.000), spherical for the family Mormoopidae (error = 0.037) and exponential for the families Emballonuridae, Molossidae, Phyllostomidae and Vespertilionidae (error = 0.034; 0.038; 10 0.000 and 0.006, respectively).
We selected the OK method because it is mainly based on the geographical distance of points to those in neighboring cells, more than the size of cells, which enables geographical units that are not necessarily adjacent or that are spaced at regular intervals to be compared. The spatial structure of the data is usually described in an experimental variogram, which is basically a graph of the semivariance between observation pairs (in this case cells) with respect to distance in a geographic space; descriptions of the requirements for the use of OK can be found in Díaz (2002), Hengl (2009) and Cruz-Cárdenas et al. (2013). Based on the quantitative results, areas with a richness greater than 50 % of species were considered to be high in richness, or ‘rich’, while areas with less than 10 % of species were considered low in richness, or ‘poor’.
Results
The distribution of presence records for the 97 species and eight families considered in the present study is shown in Figure 2. When all species of the order Chiroptera are considered the sample localities are dispersed throughout the country. However, at the family level, the distributions follow distinct patterns. Only the families Vespertilionidae and Molossidae are widely distributed. Meanwhile, records for the families Phyllostomidae, Mormoopidae and Natalidae are concentrated in the Pacific and Gulf of Mexico coastal plains, as well as in the central and southern portions, and are scarce or absent in the Central Mexican Plateau and in the northern-central areas of the country. Records for the families Emballonuridae, Noctilionidae and Thyropteridae were found along the Pacific Coastal Plains and in the south and south-eastern areas of the country, and notably missing in the central, northern and eastern areas of the territory.
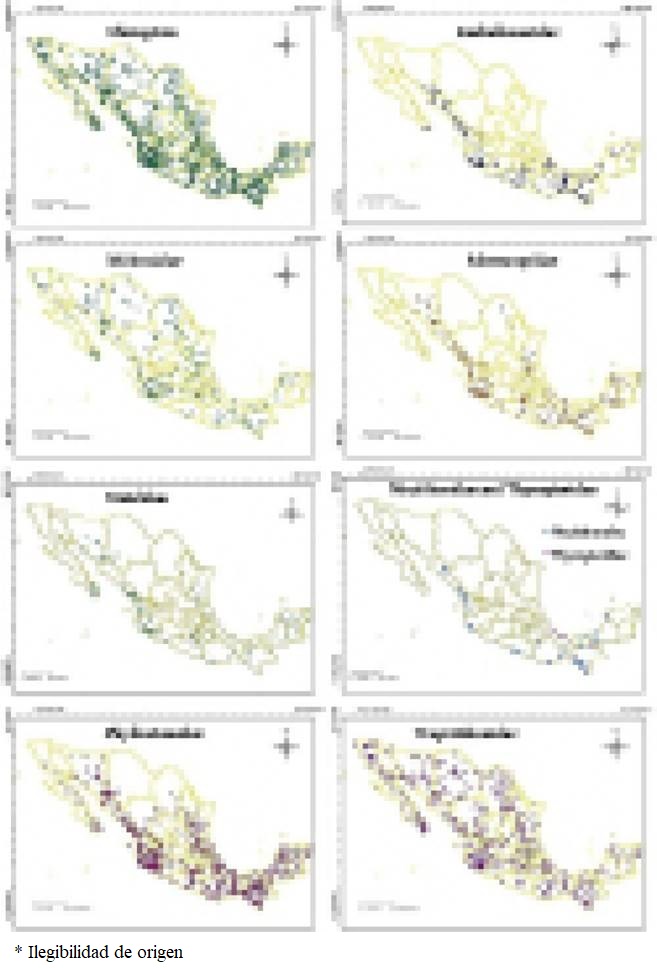
Figure 2 Maps showing the distribution of the 6,979 localities with presence records for the 97 species considered in this study and also their distribution at the family level.
Species richness per cell. Of the 253 cells into which Mexico was divided, 48 cells did not have bat records (19%). These mostly are located in the north of the country. Thus, bat records were found in the remaining 205 cells. The cells had an average of 12 species per cell, with a minimum of one species and a maximum of 52 species (Table 2). Overall, 75 % of cells presented richness values ranging from one to 17 species, 20 % from 18 to 25 species and the remaining 5 % from 36 to 51 species. The highest richness value was encountered in only one cell with 52 species, which was located in western Mexico on the border between the states of Colima and Jalisco.
Table 2 Clades of Mexican bats with their species number, localities with bats records, number of cells with collecting records and average and maximum values of bat species richness recorded by cell.
| Taxonomic group | Species | Localities | Cells with records | Bat richness by cell | |
|---|---|---|---|---|---|
| average | maximum | ||||
| Chiroptera | 97 | 6,979 | 205 | 12 | 52 |
| Phyllostomidae | 38 | 3,960 | 149 | 8 | 25 |
| Vespertilionidae | 33 | 1,623 | 184 | 3 | 18 |
| Molossidae | 12 | 27 | 133 | 2 | 9 |
| Emballonuridae | 7 | 373 | 64 | 2 | 6 |
| Mormoopidae | 4 | 778 | 87 | 3 | 4 |
| Natalidae | 1 | 172 | 56 | 1 | 1 |
| Noctilionidae | 1 | 41 | 21 | 1 | 1 |
| Thyropteridae | 1 | 5 | 3 | 1 | 1 |
The number of cells with collecting records, and the average and maximum values of bat species richness recorded by cell for each bat family is show in Table 2.
Analysis of the spatial distribution of species richness
Order and families. Considering the 97 bat species together, the greatest richness was found in the Mexican Pacific Coast biotic province, the deciduous tropical forest vegetation type and the temperate sub-humid climate. For the family Emballonuridae the greatest richness was found in the Gulf of Mexico biotic province, the evergreen tropical forest vegetation type and the warm-humid climate. The family Molossidae presented the greatest richness in the Mexican Pacific Coast biotic province, the deciduous tropical forest vegetation type and the warm-humid climate. For each bat family the highest richness values in the biotic provinces, vegetation types as well as climates are presented in Tables 3 to 5.
Table 3 Percentages of richness for each bat taxonomic group in Mexico’s different biotic provinces proposed by Morrone (2005): Baja California (BC), Balsas Basin (BB), California (CAL), Chiapas (CHI), Gulf of Mexico (GM), Mexican Pacific Coast (MPC), Mexican Plateau (MP), Sierra Madre del Sur (SMS), Sierra Madre Occidental (SMW), Sierra Madre Oriental (SME), Sonora (SON), Tamaulipas (TAM), Transmexican Volcanic Belt (TVB), Yucatán Peninsula (YP). Province/Group (P/G), Chiroptera (CH), Emballonuridae (EM), Molossidae (ML), Mormoopidae (MR), Phyllostomidae (PH), and Vespertilionidae (VE).
| P/G | CH | EM | ML | MR | PH | VE |
|---|---|---|---|---|---|---|
| MPC | 87 | 71 | 93 | 100 | 95 | 63 |
| GM | 74 | 86 | 43 | 100 | 87 | 53 |
| TBV | 59 | 14 | 57 | 75 | 59 | 53 |
| BB | 54 | 43 | 36 | 75 | 56 | 45 |
| SMS | 52 | 29 | 36 | 75 | 69 | 32 |
| SMW | 52 | 14 | 36 | 75 | 51 | 50 |
| SME | 51 | 0 | 50 | 75 | 44 | 55 |
| YP | 45 | 29 | 50 | 75 | 54 | 26 |
| CHI | 43 | 43 | 14 | 75 | 59 | 26 |
| SON | 43 | 14 | 43 | 75 | 33 | 45 |
| MP | 41 | 14 | 29 | 25 | 31 | 58 |
| BC | 33 | 14 | 29 | 25 | 15 | 47 |
| TAM | 14 | 0 | 7 | 25 | 13 | 13 |
| CAL | 7 | 0 | 0 | 0 | 0 | 18 |
Table 4 Percentages of richness for each bat taxonomic group in Mexico’s different vegetation types proposed by Rzedowski (1990): Deciduous tropical forest (DTF), Evergreen tropical forest (ETF), Grassland (G), Pine-Oak forest (POF), Thorn forest (TF), Tropical sub-deciduous forest (TSDF), Xerophile shrubland (XS). Vegetation Type (VT), Chiroptera (CH), Emballonuridae (EM), Molossidae (ML), Mormoopidae (MR), Phyllostomidae (PH), and Vespertilionidae (VE).
| VT | CH | EM | ML | MR | PH | VE |
|---|---|---|---|---|---|---|
| DTF | 94 | 50 | 100 | 100 | 95 | 79 |
| POF | 85 | 38 | 64 | 75 | 90 | 79 |
| ETF | 82 | 88 | 50 | 100 | 92 | 63 |
| XS | 65 | 13 | 64 | 75 | 49 | 82 |
| TSDF | 48 | 50 | 50 | 75 | 59 | 21 |
| TF | 45 | 13 | 43 | 75 | 41 | 45 |
| G | 28 | 0 | 7 | 0 | 26 | 42 |
Table 5 Percentages of richness for each bat taxonomic group in Mexico’s climate types proposed by García (1998): Temperate sub-humid (Tsh), Warm sub-humid (Wsh), Warm-humid (Wh), Semi-dry very warm (Sdvw), Semi-cold sub-humid (Scsh), Semi-calid subhumid (Scs), Warm-dry (Wd), Very dry semi-warm (Vdsw), Dry very warm (Dvw), Semi-dry temperate (Sdt), Semi-warm dry (Swd), Semi-dry warm (Sdw), Semi-dry semi-warm (Sdsw), Dry temperate (Dt), Very dry temperate (Vdt), Very dry-warm (Vdw), and Very dry-very warm (Vdvw). Climate/Group (C/G), Chiroptera (CH), Emballonuridae (EM), Molossidae (ML), Mormoopidae (MR), Phyllostomidae (PH), and Vespertilionidae (VE).
| C/G | CH | EM | ML | MR | PH | VE |
|---|---|---|---|---|---|---|
| Tsh | 94 | 38 | 86 | 100 | 87 | 79 |
| Wsh | 69 | 75 | 100 | 100 | 100 | 63 |
| Wh | 34 | 88 | 50 | 75 | 85 | 45 |
| Sdvw | 34 | 38 | 21 | 75 | 36 | 16 |
| Scsh | 32 | 0 | 14 | 0 | 0 | 34 |
| Scs | 32 | 0 | 0 | 0 | 18 | 0 |
| Wd | 29 | 13 | 7 | 75 | 33 | 34 |
| Vdsw | 28 | 0 | 29 | 25 | 10 | 47 |
| Dvw | 25 | 0 | 0 | 50 | 18 | 8 |
| Sdt | 20 | 13 | 21 | 25 | 31 | 34 |
| Swd | 20 | 0 | 7 | 0 | 8 | 5 |
| Sdw | 16 | 0 | 29 | 50 | 13 | 39 |
| Sdsw | 13 | 0 | 14 | 50 | 10 | 37 |
| Dt | 8 | 0 | 14 | 0 | 5 | 42 |
| Vdt | 7 | 0 | 21 | 0 | 5 | 37 |
| Vdw | 3 | 13 | 36 | 75 | 18 | 39 |
| Vdvw | 0 | 13 | 7 | 0 | 0 | 3 |
Biotic provinces. The results obtained for the interpolation of the distribution of the species richness and the biotic provinces are shown in Table 3 and Figure 3. The Mexican Pacific Coast and Gulf of Mexico provinces have the greatest richness of bats and the provinces of California and Tamaulipas contain the lowest numbers of species. All provinces contain vespertilionid bats, with generally high percentages of richness, wherein the Mexican Pacific Coast, Sierra Madre Oriental, Gulf of Mexico, and Transmexican Volcanic Belt provinces have high values. The majority of provinces have the presence of phyllostomids but the Mexican Pacific Coast and Gulf of Mexico provinces have notable richness value for this family, and only the California province was lacking in species for this family. With respect to mormoopids, 10 provinces can be highlighted for their high richness values, and the California province is the only one without mormoopids. The greatest molossid and emballonurid richness occurred in the Mexican Pacific Coast and Gulf of Mexico provinces. Bat records are absent in some portions of the following biotic provinces: Mexican Plateau (23 cells), Tamaulipas (9 cells), Sonora (8 cells), Baja California (4 cells), California (2 cells) and Yucatán Peninsula (2 cells).
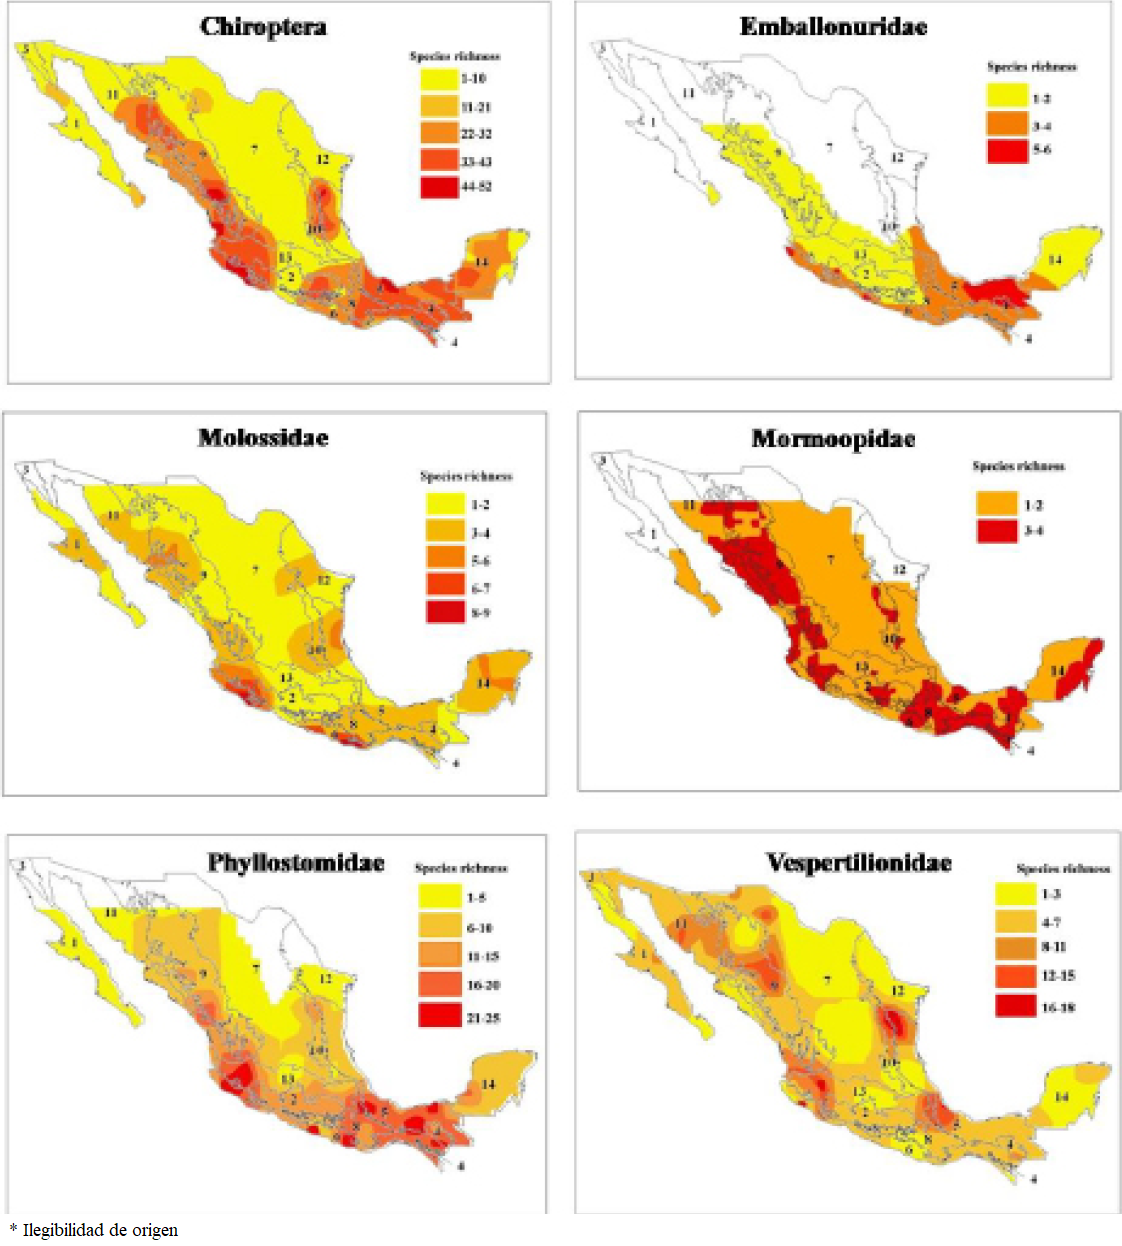
Figure 3 Maps showing the bat richness patterns for different taxonomic groups in the biotic provinces proposed for Mexico following Morrone (2005). Baja California (1), Balsas Basin (2), California (3), Chiapas (4), Gulf of Mexico (5), Mexican Pacific Coast (6), Mexican Plateau (7), Sierra Madre del Sur (8), Sierra Madre Occidental (9), Sierra Madre Oriental (10), Sonora (11), Tamaulipas (12), Trasmexican Volcanic Belt (13), Yucatán Peninsula (14).
Vegetation types. Chiropteran richness is notable in the deciduous tropical forest, followed by pine and oak forest and evergreen tropical forest (Table 4). The vegetation type with poorest bat richness is grassland where only a few records for molossid, phyllostomid and vespertilionid bats are found. At the family level, Mormoopidae exhibits high richness values in six vegetation types: deciduous tropical forest, evergreen tropical forest, pine and oak forest, xerophile shrubland, tropical sub-deciduous and thorn forest. Phyllostomidae presents high richness values in pine and oak forest, evergreen tropical forest and deciduous tropical forest vegetation types. The maximum richness of Molossidae is in deciduous tropical forest, of Emballonuridae in evergreen tropical forest and of Vespertilionidae in xerophile shrubland. Bats were not present in 44 cells located in xerophile shrubland and in four cells of thorn forest.
Climate. The richness values for the Order Chiroptera are broadly distributed across diverse climate types (Table 5). The temperate sub-humid, warm sub-humid and warm-humid climate types presented the highest values for bat richness for both order and family levels. Emballonuridae presented high richness values in the warm-humid and warm sub-humid but in nine climate types their richness is zero. For the Molossidae and Phyllostomidae the climates warm sub-humid and temperate sub-humid have high richness values. Meanwhile, the richness values for the family Mormoopidae are high in nine climate types but were zero in another six climates, while the majority of climates have the presence of vespertilionids but not in high numbers. No bat records were found in 35 cells of semi-dry temperate climate, in six of semi-cold sub-humid, in five of very dry-very warm and in two of temperate-humid. For the climates cold, semi-warm humid, semi-dry semi-cold and temperate-humid, an estimated richness value was not obtained.
Modelling overlapping richness values (Maps)
The maps resulting from the use of ordinary kriging do not show richness patterns that are concordant for the biotic provinces. There is not a biotic province in which there is a predominance or a clear concentration of the bat richness (Figure 3). Maps highlight different patterns of bat richness for each family, not concordant with biotic provinces. For the family Emballonuridae the richness is concentrated towards the coastal plains of the Pacific and Gulf of Mexico and generally in the southeast of the country. Bats of the family Molossidae are present throughout the country, but richness is especially concentered in five hotspots, three in the western regions of Sonora-Sinaloa, Jalisco-Colima and Oaxaca, one in the south of Chiapas and other in the Yucatan peninsula. In Mormoopidae richness is broadly distributed over the country, but decreases in the center, north and east. For Phyllostomidae richness is high over the country, more concentrated in the coastal plains of the Pacific and Gulf of Mexico and towards the southern portion but decreasing in the center and in the north. For the Vespertilionidae family, bat richness extends throughout the country, with several areas of high species richness located in the northwest and northeast, the central plateau, the isthmus of Tehuantepec and the Yucatan Peninsula (Figure 3).
Discussion
The collecting localities for bats are not uniformly distributed over the country, with most of them concentrated in the west, east and south, while there are a very few records in the north and central plateau. This reflects that there are fewer species in those parts of the country and also a bias in the efforts for collecting (Figure 2 Chiroptera map).
The use of GBIF has limitations due that there are only 97 species (70.3 %) of the 138 species registered for the country. The families Natalidae, Noctilionidae and Thyropteridae are poorly represented, have few records, and because they are monospecific families they cannot be included in the kriging analysis.
In our maps the comparisons among the richness patterns of bats demonstrate that the pattern of the order level can differ from the patterns of the constitutive families, as well as the richness patterns differing to a substantial extent among families.
Biogeographical approaches are used to examine the cause of the bat distribution patterns, as well as to trace the circumstances of the past that may have influenced to generate such patterns. Various environmental factors such as latitude, temperature, precipitation and topography have been proposed to explain the richness and diversity of bats in the New World. One of the most considered is the effect of the latitudinal gradient for which several studies have proposed that the number of species increases as the latitude decreases (Wilson 1974; Willig and Lyons 1998; McCoy and Connor 1980; Fa and Morales 1991; Kaufman 1995; Arita and Ortega 1998; Willig et al. 2003), even at the local level (Stevens and Willig 2002). But according to Patten (2004) annual precipitation, temperature, and topography are better predictors of species richness in Chiroptera than vegetative cover, which explained little variation, and latitude which explained an insignificant amount of residual variation in species richness. Also, Stevens (2004) stated that ecological and evolutionary differences among higher taxonomic units, those involving life-history traits, predispose taxa to exhibit different patterns of diversity along environmental gradients. Our results are more in agreement with Patten (2004) and Stevens (2004), but we only include a part of the area analyzed by these authors, which does not allow us to appreciate the extremes on the distribution of the bat families in North America or the Neotropics.
Some authors considered that climatic factors have a profound effect on bat distribution and richness (Patten 2004; Stevens 2004; Pereira and Palmeirim 2013; Peixoto et al. 2017) because higher richness accumulates in environments resembling the ancestral niche, thus supporting phylogenetic niche conservatism as the mechanism driving the bat diversity gradient; but because niches are phylogenetically conserved within clades, and clades differ in climatic origin in general, the relationship between climate and species richness of mammalian clades is not positive (Buckley et al. 2010). In our analyses the species richness patterns do not respond to environmental gradients (climate). In addition, vegetation types can be an indicator of the productivity and availability of food in a specific area and the richness patterns of a given group, but in our analyses of the bat richness patterns they also do not respond to vegetation types (Tables 4 and 5). For both climate and vegetation, at the familial level richness is distributed throughout the country, but the greatest richness is concentrated in areas where there is high climatic diversity and the confluence of diverse vegetation types (Figures 3 and 4).
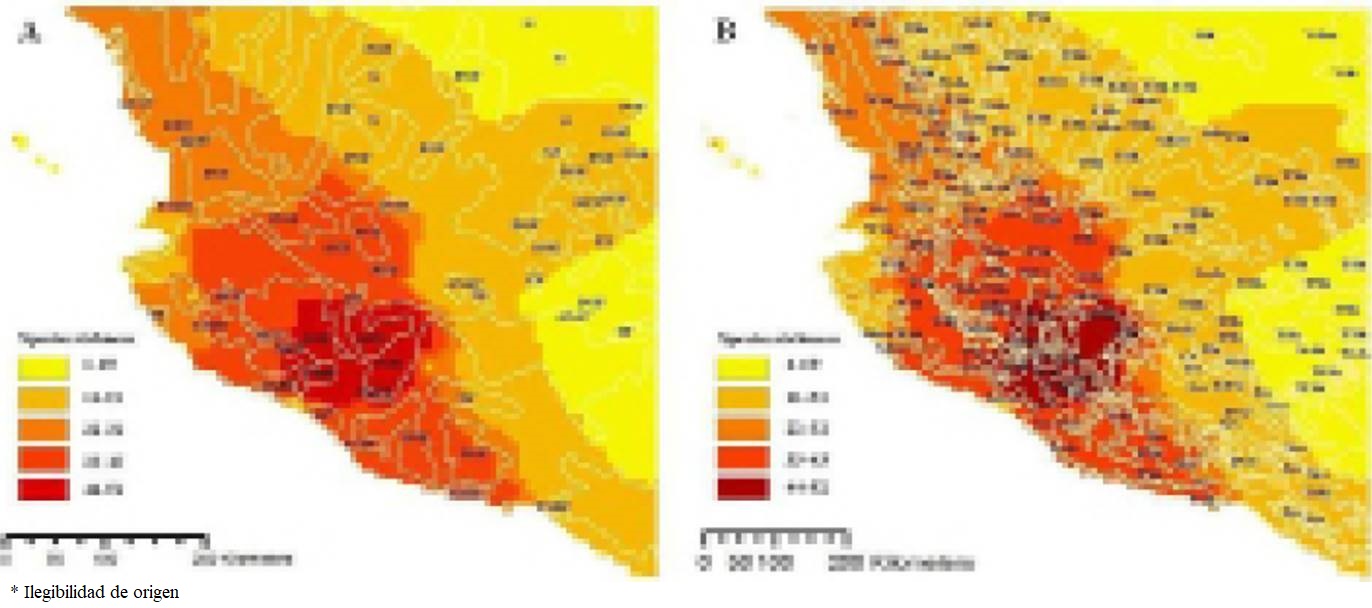
Figure 4 Maps showing the bat richness patterns in western Mexico and its complex relationship with vegetation (A) and climate types (B). Vegetation types: Deciduous tropical forest (DTF), Grassland (G), Mountain cloud forest (MCF), Pine-Oak forest (POF), Thorn forest (TF), Tropical sub-deciduous forest (TSDF) and Xerophile shrubland (XS). Climates: Cold (Co), Dry-very warm (Dvw), Semi-calid sub-humid (Scs), Semi-cold sub-humid (Scsh), Semi-dry semi-warm (Sdsw), Semi-dry temperate (Sdt), Semi-dry very warm (Sdvw), Semi-dry warm (Sdw), Semi-warm humid (Swh), Temperate sub-humid (Tsh), Temperate-humid (Th), Very dry semi-warm (Vdsw), Very dry-temperate (Vdt), Warm sub-humid (Wsh), and Warm-humid (Wh).
Great differences exist between the richness patterns displayed for the bat families within the biotic provinces proposed for the country (Table 3). Willig et al. (2003) point out that for North American mammals the larger biotic provinces contain more taxa (species, genera and families) than their smaller counterparts, but in our study this is not observed for Mexican bats. These differences are associated with the criteria used for the establishment of the biotic provinces, in which priority is given to ecosystems, their functioning and only the presence or absence of some organisms, rather than put the priorities at the origin, radiation processes, phylogeny and habitats of such organisms that are sharing a certain area. For this reason the biotic provinces cannot explain the richness patterns followed by the Mexican bats either as a whole or the taxonomic level of the family.
For the 97 bat species as a whole, the modelled distributions maps show a greater concentration of species richness in three areas of the country: 1) The area in western Mexico where the biotic provinces of the Trans-Mexican Volcanic Belt and the Mexican Pacific Coast converge. 2) Northeastern Mexico, where the biotic provinces of Tamaulipas, the Sierra Madre Oriental and the Coastal Plains of the Gulf of Mexican unite. 3) The Isthmus of Tehuantepec area, where the provinces of the Sierra Madre del Sur, the Coastal Plains of Gulf of Mexico and the Highlands of Chiapas converge (see Chiroptera in Figure 3). The maps also show that each family has a particular pattern of species richness across the country (Figure 3) and the points where it is concentrated are scattered. This suggests that the bat richness concentration in some areas is probably due to the environmental heterogeneity, areas with a complex topography that give rise to a wide diversity of climates and vegetation types that promote the formation of several habitats within a relatively small territorial extension; this is in accord with Willig and Presley (2018) who postulate that the variation in species composition among local assemblages is typically associated with habitat heterogeneity and contributes to the disparity between biodiversity at local and regional scales.
Arita et al. (2014) proposed that bat richness in Mesoamerica is determined at the generic level by the distinct tendencies of diverse clades and is tightly linked with the origin and the processes of diversification at the family level. For instance, the families Vespertilionidae and Natalidae have a North American origin, while the family Molossidae underwent an early diversification in South America. Meanwhile, the diversification processes for Mormoopidae and Phyllostomidae and probably for Emballonuridae were complex. In the maps obtained by us only the richness pattern observed in Vespertilionidae may be viewed as a reflection of the family’s origin.
The richness of bats among biotic provinces is very complex to attribute only to the conjugation of some environmental factors and the types of vegetation existing in them. López-González et al. (2012) proposed that the structure of Mexican bat meta-communities is associated with multiple environmental gradients at different spatial scales and that the distribution of bats along environmental gradients is determined by characteristics of the species group and not the defined study areas that arbitrarily confine them. Our results show a similar behavior for concentrated bat richness.
Bat families differ in their richness patterns, so studies of bat biogeography in Mexico may be misleading if they are examined only at the ordinal level; beside this the results of this study also show that the species richness of bats and their relationship with environmental parameters are more complex than previously reported and that the distribution patterns can differ depending on the taxonomic level or the parameters considered. Likewise, the bat richness is similar for the vegetation and climate types; but due to the complex orography of the country representation of these two factors on a map is very complex (Figures 4a, 4b).
Vegetation and climate, either independently or together, do not completely explain the observed richness patterns, thereby demonstrating the need to examine different dimensions of richness as well as the biological richness of bats in megadiverse ecosystems using new approaches that consider phylogenetic aspects and the evolutionary history of each taxon.
Other authors have already mentioned some of the areas in this study with the greatest species richness. For example, Chamela, Jalisco (western Mexico); Los Tuxtlas, Veracruz (to the west of the Isthmus of Tehuantepec); and El Triunfo, Chiapas (to the east of the Isthmus of Tehuantepec), are mentioned in the study of Arita and Ortega (1998) as localities with high species richness. In the maps generated in this study, these localities each represent one point within much wider areas of high species richness, wherein the species richness decreases with respect to increasing distance from these points.
Various authors have highlighted the importance of the ‘Mexican transition zone’, an area where the Nearctic and Neotropical regions converge, for understanding the diversity patterns of mammals (Ortega and Arita 1998; Fa and Morales 1991; Escalante et al. 2005; Morrone and Escalante 2002). The generated maps also demonstrate the importance of this zone for bat species as a whole and particularly for Phyllostomidae. In addition, the maps show the significance of the Río Balsas Basin and the Trans-Mexican Volcanic Belt, especially for the families Mormoopidae and Vespertilionidae.
Our results highlight that for Mexican bats, patterns may be dependent on characteristics of spatial scale and taxonomic hierarchy and also point out the need to consider, beside the origin and diversification process, the potential differences in the macroecology and biogeography among families. Additional analyses that consider the patterns of richness presented in this study and that incorporate at the same time other variables (productivity, environmental structure, and landscape heterogeneity) and processes (phylogenetic and functional diversity) could reveal new information about the factors that influence and shape the distribution of bat species richness, both overall and for distinct clades.
Bats are related to the upkeep of ecosystem services that are very important for the maintenance of humid tropical forests, dry forests, cactus plants, xerophilous thickets and cave environments, in which they perform as pollinators, seed dispersers and regulators of insect populations (Kunz et al. 2011). The application of conservation plans for bats will make it possible to preserve these ecoservices and others relevant to human beings, such as the control of various insect pests in plants of agricultural interest (Maine and Boyles 2015), the pollination of plants with commercial interest (Rocha et al 2006; Valenzuela 2011) as well as in the field of human health, because bats are also controllers of insect populations that can be vectors of important diseases such as malaria, dengue, zika and chikungunya, among others (Plowright et al. 2015).
The protection of areas with high concentration of bat richness, especially the rich hotspot diversity areas showed in this paper, should be a priority during the development of conservation strategies. The analysis of geographical concentrations of endemic taxa are frequently used to determine priorities for conservation actions; preserving areas with a broader taxonomic focus, such as the one proposed in this study at the family level, would consider phylogenetic relationships (evolutionary history) among taxa. It may therefore provide a better currency for conservation evaluation than only species richness.
Decision makers should consider the richness patterns presented in this study in order to design appropriate strategies for the conservation of bats in Mexico. Their conservation is especially important considering their high ecological value, furthermore, their richness patterns result from the interaction of multiple variables and processes that affect other faunistic groups in addition to bats.
The results presented here enable a general understanding of the species richness patterns of bats and of the areas where this richness is concentrated and its relationship with diverse biogeographic regions and environmental parameters. Even so, these results are not completely satisfactory, due to methodology problems.
Novel techniques for identifying insectivorous bats have been developed (ultrasonic detectors) do not necessarily involve the capture of individuals, so species records can change, causing possible variations in the maps presented here. The utilized scale of 1:1,000,000 and the use of a 1° X 1° grid functioned well for the biogeographical regions (biotic provinces) but not for environmental factors considered (vegetation and climate). Along the country some climates types had a limited or very fragmented geographical distribution with the utilized scale these climates occupied the same cells dominated by other climate types with a wider geographical distribution; therefore, in the analyses, the relationships of the cold, semi-warm humid, semi-dry semi-cold, and temperate-humid climate types with species richness were excluded from the results. This same phenomenon occurs also with vegetation types and for the Mountain cloud forest the analysis either did not generate results. This highlights the need to investigate the interactions with environmental parameters at different scales in order to have a better understanding of the richness patterns in Mexican bats.

