


Services on Demand
Journal
Article
 text in
  English (pdf)
 Article in xml format
 Article references
 Send this article by e-mail
Indicators
-
 Cited by SciELO
 -
 Access statistics
Related links
-
 Similars in
SciELO
Similars in
SciELO
Share

 Permalink
Tecnología y ciencias del agua
On-line version ISSN 2007-2422
Tecnol. cienc. agua vol.11 n.1 Jiutepec Jan./Feb. 2020 Epub May 30, 2020
https://doi.org/10.24850/j-tyca-2020-01-06
Articles
Characterization of hydrological drought in the Cauca river high valley

1Universidad del Valle, Cali Colombia, nathalia.gonzalez.lopez@correounivalle.edu.co
2Universidad del Valle, Cali Colombia, yesid.carvajal@correounivalle.edu.co
Droughts are one of the most complex natural phenomena and can have devastating effects on social and ecological systems. As a consequence of the Climate Change (CC), the increasing pressure of water demand caused by population growth and the expansion of the agricultural, energy and industrial sectors have intensified, so it is necessary to identify and characterize droughts. In this work, the Streamflow Drought Index (SDI) was calculated for four stations located in the Cauca River in its high valley, with the purpose of detect the occurrence and intensity of hydrological droughts. The results showed that the most intense and major events occurred during the years 1991-1992 and 2015-2016, during which the El Niño phenomenon occurred in Colombia.
Keywords Streamflow; Streamflow Drought Index (SDI); El Niño
Las sequías son uno de los fenómenos naturales más complejos y pueden generar efectos devastadores para los sistemas sociales y ecológicos. Como consecuencia del cambio climático (CC); de la creciente presión de la demanda de agua causada por el crecimiento de la población; y la expansión de los sectores agrícola, energético e industrial, las sequías se han intensificado; por tanto, es necesario identificarlas y caracterizarlas. En este trabajo se calculó el índice de sequía de caudales (SDI) para cuatro estaciones ubicadas en el río Cauca en su valle alto, con el fin de detectar la ocurrencia e intensidad de las sequías hidrológicas. Los resultados mostraron que los eventos más intensos y de mayor magnitud ocurrieron en los años 1991-1992 y 2015-2016, durante los cuales se presentó el fenómeno El Niño en Colombia.
Palabras clave caudales; El Niño; índice de sequía de caudales (SDI)
Introduction
Since the second half of the twentieth century, alterations in the space-time patterns of meteorological phenomena such as storms, hailstorms and frosts, and weather variables such as temperature, humidity and precipitation have been reported at global, regional and local levels; mainly associated with the occurrence and intensity of phenomena of Climate Variability (VC), Climate Change (CC) and the El Niño - Southern Oscillation (ENSO) (Forero, Hernández, & Zafra, 2014; Pinilla, Rueda, Pinzón, & Sánchez, 2012; Poveda & Álvarez, 2012; Ulloa, 2014). Accelerated CC is generating relevant and indirect effects of great complexity, which are accentuated by the interaction with other controllers of global change (land-use changes, pollution, biotic exchange).
Water resources and coastal ecosystems, marine and terrestrial, present the most obvious impacts, which in turn affect the livelihoods and health of urban populations ( Moreno, 2006; IPCC, 2014). The scheme of consequences affecting water resources is diverse with alterations to the water cycle, mainly in the rainfall regime. While certain sites experience abundant rainfall in a short interval of time, causing flooding, other sites experience extended periods of drought (Crossman et al., 2013; Cantú, 2014; Schewe et al., 2014). In both cases, water availability and quality are affected, consequently impacting upon agricultural activities, putting the livelihoods and food security of populations, particularly in developing countries, at risk; a situation which if not addressed, could worsen over time leading to an increase in global malnutrition (Wheeler & Braun, 2013). Additionally, the predicted average increase in annual temperatures of 2.5 ° C for the year 2050 and the 2.5% increase in annual precipitation, are likely to lead to soil degradation and a loss of organic matter on the slopes of the Andes ((Lau, Jarvis, & Ramírez, 2013.
Droughts are one of the most damaging natural hazards, and can have devastating effects on social and ecological systems. Unlike other natural hazards (floods, landslides) that are normally limited to relatively small regions and occur at well-defined time intervals, droughts are probably the most expensive and least predictable, since they develop gradually and are only identified once well established (Hao & Aghakouchak, 2014; Hao & Singh, 2015; Hong, Guo, Zhou, & Xiong, 2015; Ravelo, Sanz, & Douriet, 2014). Given the wide variety of sectors affected and their diverse geographical and temporal distribution, it is difficult to establish a unique and precise definition of drought Rajsekhar, Singh, & Mishra, 2015), however in general terms, drought occurs when the availability of water fails to meet the demands of human and environmental activities for a significant period and over a large area.
Considering the number of victims and losses in disasters of hydrometeorological origin, social, economic and environmental sustainability can and should be improved, with approaches to disaster risk management and adaptation (Quintero-Angel, Carvajal-Escobar, & Aldunce, 2012). It is therefore essential to carry out studies aimed at understanding and characterizing drought and modeling its components, especially in those areas where much of the economic activity depends on water use (Wagner, Rossi, Stahl, Bonal, & Herault, 2012. For this, statistical tools can be used to identify the probability of occurrence, duration and intensity of a drought event (Vicario et al., 2015).
Different indices exist that serve as inputs in disaster prevention programs and generate scientific bases which can be used in risk management and impact mitigation. Some require complex calculations and robust information, making them difficult to apply in areas where the latter is deficient, however, others require only one variable, such as the calculation of precipitation or flow. This work seeks to identify the minimum hydrological extremes that have occurred in the Cauca River in its high valley, using the Streamflow Drought Index (SDI). Through this index, hydrological drought events were characterized, based on their intensity, duration and magnitude; information of vital importance for the formulation of adaptation measures to these events, in one of the most important hydrographic basins of Colombia, where the agricultural sector is highlighted as one of the main economic activities, which can be seriously affected by the occurrence of extreme weather events.
Methodology
Study area
The Cauca River is the second most important surface water source in Colombia, after the Magdalena River. It is born in the Colombian Andean Massif between the Western and Central mountain ranges in the department of Cauca and flows into the Magdalena River. Its elevation varies between 900 to 4 000 masl and it has 39 tributaries, influencing mean flow, which increases up to three times as water is transported along the river from the Salvajina dam (approximately 152 m3 / s) until it exits the department of Valle del Cauca (approx. 568 m3 / s) (Enciso, Carvajal, & Sandoval, 2016). Along its route, the Cauca River passes through more than 180 municipalities.
The Cauca River Basin of approximately 63,300 km² presents various productive activities, principally involved in the sugar industry, coffee cultivation, electricity generation, mining and agricultural exploitation (Pérez-Valbuena, Arrieta-Arrieta, & Contreras-Anaya, 2015). In particular, the Upper Cauca River Basin, is of special strategic importance, since it includes almost all the production chains prioritized by the Colombian Ministry of Agriculture, as well as a diversity of agricultural systems that range from small operations to industrial farms. Additionally, it is the basis of much of the technical and high-value agriculture in the country ((Peterson et al., 2012). The area evaluated for this study was the Upper Cauca River Basin between La Balsa station, located at the entrance of Valle del Cauca, to the Anacaro station located at the exit of the river from the department (Figure 1).

Method: SDI
Droughts have intensified as a result of CC, the increasing pressure of water demand caused by population growth, and expansion of the agricultural, energy and industrial sectors, among others. This makes it essential to monitor drought conditions. One of the ways to do this is through indices, which provide a quantitative method to determine the beginning and end of a drought event Tabari, Nikbakht, & Hosseinzadeh-Talaee, 2013), as well as the intensity, magnitude and frequency. There are different indices to analyze hydrological drought, among which the following stand out: the Palmer Drought Severity Index (PDSI), the Surface Water Supply Index (SWSI), the regional Runoff Deficiency Index (RDI), the Standardized Runoff Index (SRI) and the Streamflow Drought Index (SDI) (Hao & Aghakouchak, 2014; Hao & Singh, 2015; Hong et al., 2015; Rajsekhar et al., 2015; Ravelo et al., 2014; Tabari et al., 2013). In general, the indices used to characterize hydrological drought require a lot of information and intensive calculations, however the SDI is one of the simplest and most effective indexes to have been recently proposed (Esquivel-Arriaga, Bueno, Sánchez-Cohen, Velásquez-Valle, & Esquivel-Arriaga, 2014), requiring only flow values. Furthermore, its methodology, characteristics and advantages are analogous to the Standardized Precipitation Index (SPI), one of the indices most widely used worldwide to characterize meteorological droughts.
Although, hydrological drought is defined as a significant decrease in water availability in all forms that appears in the hydrological cycle, it is the flow which allows us to understand the behavior of surface water resources, and from the point of view of water quantity, it is the most important variable (Nalbantis & Tsakiris, 2009). It also indirectly includes other climatic variables such as precipitation and evapotranspiration, therefore providing holistic information. Also, almost all the effects of the drought are related to soil water drought or hydrological drought, since both the ecosystem and society depend on the water in reservoirs (soils, aquifers, lakes and rivers). Therefore, it was decided to use the SDI, which is an integrative index for using flow information, which is also especially useful in areas for which there is little information. According to the methodology of Nalbantis (2008), from standardized series of accumulated flows it is possible to identify a hydrological drought event based on its standard deviation. To normalize the data, the author used the log-normal distribution of two parameters and calculated the index according to Equation (1), the result of which indicates the intensity of the drought; the ranges are shown in Table 1.
Where
Table 1 SDI Classification.
| SDI | Category |
|---|---|
| Greater than 0.0 | No Drought |
| 0.0 to -1.0 | Light Drought |
| -1.0 to -1.5 | Moderate Drought |
| -1.5 to -2.0 | Severe Drought |
| Less than -2.0 | Extreme Drought |
Different methods exist to select the most appropriate distribution for normalization, which typically include graphical and statistical methods. For this work, Q-Q graphs were plotted and the Kolmogorov- Sminov (KS) and Anderson-Darling (AD) tests were used to select the appropriate distribution to normalize the 6 and 12 month accumulated flow series. These two periods were selected, since as with SPI, the monthly and quarterly series show high sensitivity. According to Núñez-López, Muñoz-Robles, Reyes-Gómez, Velasco-Velasco amd Gadsden-Esparza (2007), each monthly record has a significant effect on the total accumulated since it represents 100% of monthly accumulation, and on average, 33.3% of the quarterly, whilst the semiannual series index stabilizes and more clearly defines water deficit, since each monthly record represents only 16.6% of that accumulated in six months and 8.33% in twelve months. Furthermore, in regions where dry conditions normally occur during a specific period, such as is the case in the study area, using the index for one or three months could lead to misunderstandings (OMM, 2012).
Results
The hydrometeorology of the Upper Cauca River Basin is strongly influenced by the ENSO phenomenon, and as a result of the double passage of the Intertropical Convergence Zone (ITCZ), it has a bimodal rainfall regime. The two periods with the highest rainfall are March-April-May and September-October-November and the two with the lowest rainfall are December-January-February and June-July-August. In response to the bimodality of precipitation, the Cauca river flow in its high valley also has periods of greater and lesser flow, with the July, August and September quarter characterized as by being the driest, while the quarter November, December and January has the highest mean flow.
Four stations were considered for this study: La Balsa, Juanchito, La Victoria and Anacaro, as can be seen in Figure 2, which also shows the behavior of the multi-annual mean flow. The input flow registered at La Balsa station, i.e. at the point where the river enters the department, is lower than the outflow. At Anacaro, maximum monthly values of up to 1 242 m3 / s have been registered, while at La Balsa the maximum was 838 m3 / s - a result which shows the influence of the water contributions to river effluents.

For the characterization of hydrological drought events through SDI, statistical tests were initially carried out to select the most appropriate distribution for normalization of the flow series, since these did not present a normal distribution. With the Q-Q graphs, the distribution of the data was compared with the normal, log-normal, exponential and gamma distributions. The results obtained for the six-month accumulated flow series at the Anacaro station are shown in Figure 3, from which data it was identified that the distribution that presents the best fit is log-normal. Similar results were obtained in the other three stations. In addition to graphical adjustment, the KS and DA tests were performed. As an example, Table 2 shows the results obtained for the six-month accumulated flow series from Anacaro station, the results indicated for all cases that log-normal was the appropriate distribution to normalize the data.
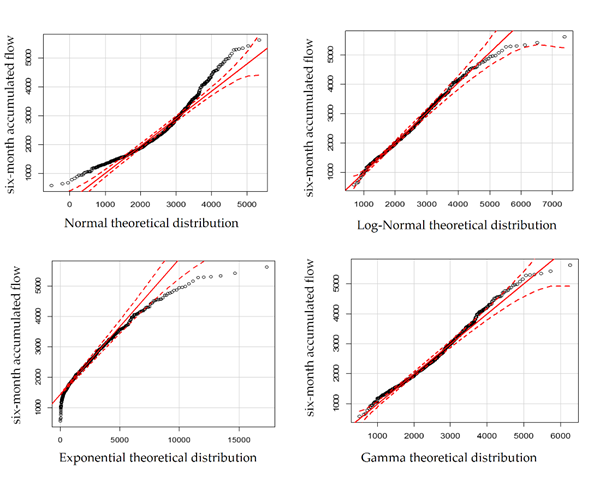
Table 2 Results of the KS and AD tests for the Anacaro station.
| Normal | Log-Normal | Exponential | Gamma | |||
|---|---|---|---|---|---|---|
| Semestral | Parameters | Mean | 2417.2340 | 7.7207 | - | - |
| sd | 923.5320 | 0.3743 | - | - | ||
| Rate | - | - | 4.14E-04 | 0.0030 | ||
| Shape | - | - | - | 7.3403 | ||
| Kolmogorov Smirnov | D | 0.0988 | 0.0255 | 0.3644 | 0.0506 | |
| P-Value | 0.00001 | 0.7892 | 0.0000 | 0.0702 | ||
| Anderson Darling | An | 12.0100 | 0.8140 | 123.3600 | 2.8220 | |
| P-Value | 0.0000 | 0.4710 | 0.0000 | 0.0337 |
Note: The p-value > 0.05 indicates that the observed data conforms to the evaluated distribution, with a 95% confidence level.
The 6 and 12 month accumulated flow data was normalized using the log-normal distribution function, therefore the methodology used by Nalbantis (2008) was followed and the index was calculated using Equation 1. Regardless of the system analyzed (hydrological, agricultural or ecological), the drought indices SWSI, SPI and SDI have been proven to have greater capacity for calculations over different time scales, since they are better correlated with temporal variability of the different variables ((Vicente-Serrano et al., 2012). The SDI (by means of standard deviations) allowed the identification of the periods in which the 6 and 12 month accumulated flow was below average. The series were constructed from a mobile sum of monthly flow, therefore to facilitate the handling of the information, the month to which reference is made to describe each event, corresponds to the last month of each period. Table 3 shows the registration period for each station and the number of events calculated.
Table 3 Period for each station and number of drought events.
| Station | Record Period | Number of drought events | |
|---|---|---|---|
| Semestral | Annual | ||
| Anacaro | 1962 - 2016 | 21 | 13 |
| La Victoria | 1959 - 2016 | 19 | 20 |
| Juanchito | 1946 - 2016 | 29 | 20 |
| La Balsa | 1946 - 2016 | 35 | 14 |
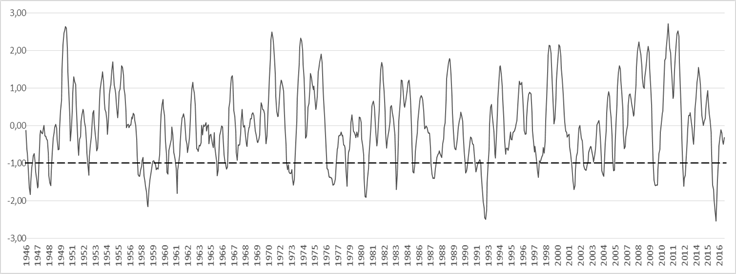
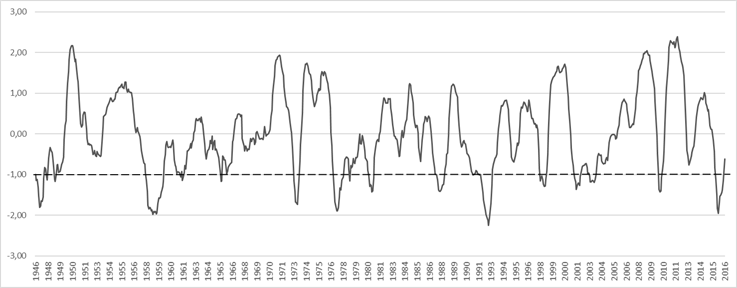
Figure 4 shows the course of the SDI calculated with the six-month accumulated flow series, and Figure 5 shows the twelve-month flow of the Juanchito station. When comparing the graphs, it was found that increasing the grouping reduced the number of events, but resulted in longer events. Additionally, a relationship was observed between hydrological droughts events and the years which experienced the warm phase of the ENSO phenomenon, El Niño, such as 1958, 1977, 1992 and 2016. The effects of the ENSO phenomenon on river flow rates in the country are not negligible; in percentage terms, the main effects on the El Niño phenomenon occur in the Magdalena-Cauca river basin, with an mean reduction of 26% inflow, a mean of 38% in the Cauca river basin, in the Sogamoso and Suarez up to 30%, whilst in the Sumapaz reductions can reach up to 40% and in the Urabá of Antioquia between 30% and 40% (García, Piñeros, Bernal, & Ardila, 2012).
Events of longer duration are associated with greater magnitudes, however occasionally, events of short duration with large magnitudes occur. Table 4 summarizes the five semiannual events of the greatest magnitude for each season, the start and end date, the duration and magnitude, and Table 5 gives the annual grouping. The highest figures were presented at La Victoria and Anacaro stations, located downstream. In addition to reflecting possible changes in climatic factors, this finding may also be due to anthropic factors, caused by water intake from the river.
Table 4 Summary of the five major drought events for the SDIS.
| Station | Event | Start date | End date | Duration | Magnitude | ||
|---|---|---|---|---|---|---|---|
| Year | Month | Year | Month | ||||
| Anacaro | 1 | 2015 | 9 | 2016 | 12 | 16 | 33.61 |
| 2 | 1992 | 5 | 1993 | 2 | 10 | 17.76 | |
| 3 | 2009 | 11 | 2010 | 5 | 7 | 12.60 | |
| 4 | 1977 | 1 | 1977 | 9 | 9 | 12.31 | |
| 5 | 1980 | 8 | 1981 | 1 | 6 | 8.58 | |
| La Victoria | 1 | 2015 | 9 | 2016 | 12 | 16 | 23.13 |
| 2 | 1992 | 6 | 1993 | 2 | 9 | 12.68 | |
| 3 | 1977 | 1 | 1977 | 9 | 9 | 10.52 | |
| 4 | 2009 | 11 | 2010 | 5 | 7 | 9.58 | |
| 5 | 1980 | 8 | 1981 | 1 | 6 | 7.15 | |
| Juanchito | 1 | 1958 | 5 | 1959 | 3 | 11 | 17.14 |
| 2 | 1992 | 6 | 1993 | 2 | 9 | 16.91 | |
| 3 | 1976 | 11 | 1977 | 9 | 11 | 15.28 | |
| 4 | 2015 | 10 | 2016 | 4 | 7 | 13.65 | |
| 5 | 1972 | 11 | 1973 | 8 | 10 | 12.54 | |
| La Balsa | 1 | 2015 | 9 | 2016 | 7 | 11 | 23.73 |
| 2 | 2001 | 5 | 2002 | 2 | 10 | 15.35 | |
| 3 | 2009 | 10 | 2010 | 6 | 9 | 14.57 | |
| 4 | 1992 | 7 | 1993 | 1 | 7 | 12.65 | |
| 5 | 2002 | 7 | 2003 | 4 | 10 | 12.10 | |
Table 10 Summary of the five major drought events for SDIA.
| Station | Event | Start date | End date | Duration | Magnitude | ||
|---|---|---|---|---|---|---|---|
| Year | Month | Year | Month | ||||
| Anacaro | 1 | 2015 | 10 | 2016 | 12 | 15 | 35.32 |
| 2 | 1992 | 3 | 1993 | 4 | 14 | 24.27 | |
| 3 | 1977 | 4 | 1978 | 1 | 10 | 14.21 | |
| 4 | 2003 | 1 | 2003 | 10 | 10 | 10.75 | |
| 5 | 1987 | 10 | 1988 | 6 | 10 | 10.70 | |
| La Victoria | 1 | 2015 | 9 | 2016 | 12 | 16 | 23.21 |
| 2 | 1992 | 6 | 1993 | 2 | 9 | 12.72 | |
| 3 | 1977 | 1 | 1977 | 9 | 9 | 10.57 | |
| 4 | 2009 | 11 | 2010 | 5 | 7 | 9.61 | |
| 5 | 1980 | 8 | 1981 | 1 | 6 | 7.18 | |
| Juanchito | 1 | 1958 | 3 | 1959 | 12 | 22 | 36.87 |
| 2 | 1992 | 3 | 1993 | 4 | 14 | 24.44 | |
| 3 | 1977 | 3 | 1978 | 3 | 13 | 19.14 | |
| 4 | 2016 | 1 | 2016 | 10 | 10 | 15.09 | |
| 5 | 1947 | 1 | 1947 | 10 | 10 | 14.65 | |
| La Balsa | 1 | 2001 | 7 | 2005 | 2 | 44 | 68.22 |
| 2 | 2015 | 10 | 2016 | 12 | 15 | 30.58 | |
| 3 | 1958 | 5 | 1959 | 9 | 17 | 20.12 | |
| 4 | 1992 | 6 | 1993 | 4 | 11 | 16.18 | |
| 5 | 2010 | 2 | 2010 | 10 | 9 | 14.41 | |
Hydrological drought is determined by the propagation of meteorological drought through the terrestrial hydrological cycle, and therefore, is influenced by the latter's properties (Van Loon & Laaha, 2015). According to the results, the largest hydrological droughts occurred during 2015 and early 2016, during which time occurred one of the strongest El Niño events in history. According to the newspaper (El Tiempo, 2016), this phenomenon triggered an average of 14 fires, and during the 15 months it lasted, Colombia lost 188 650 hectares due to forest fires, rainfall was on average reduced between 30 and 40%, and 80% of the areas affected by the influence of El Niño exhibited a temperature increase of up to 2.5 ° C. This drought historically produced the lowest levels of the Magdalena River and left more than 200 municipalities in calamity due to water shortages. The cost to the country in terms of prevention and emergency care was 1, 6 billion pesos. The above reflects the influence of the ENSO in Colombia, which during the El Niño warm phase, mainly generates a decrease in precipitation, and consequently, reduces river flow, soil moisture and plant activity (Rojo, 2011).
Although these results provide an approximation for the characterization of hydrological droughts, it is important to consider that calculating the SDI with flow values, which in turn are estimated from Level-Flow curves, a high percentage of error may be implied. The calibration curves used to estimate flow are associated with high uncertainty and can be simple or complex, depending on the flow regime and the channel characteristics (Carvajal-Escobar, 2010). Furthermore, it is important to remember that during dry periods there is an increase in temperature, and this can lead to an increase in evapotranspiration of crops, potentially increasing irrigation needs, putting greater pressure on rivers, and consequently decreasing river levels in a manner similar to flow, not only due to natural factors but also as society's demand for water increases. In small rivers, these changes significantly affect flow and calculation uncertainty is higher, which is why we worked with the flow of the Cauca River, which has larger and more constant flows concerning other smaller rivers.
Conclusions
River flow is one of the elements of the hydrological cycle with the greatest consequences for the life of human beings, therefore, the identification and characterization of temporally and spatially extreme hydrological events which allow the assessment of regional and local water availability is an essential component of water planning. Although, hydrological drought is defined as a significant decrease in water availability in all forms that appears in the hydrological cycle, the flow rate is the main variable and allows us to understand the general behavior of surface water resources. The SDI is therefore an important tool for the characterization of hydrological droughts, especially in areas with little information.
The Cauca River is the second most important source of surface water in the country and although studies on this river have typically focused on maximum events - since over the years the river has registered significant rainfall increases leading to flooding - the results of this study indicate that it has also been affected by hydrological drought, which has caused significant reductions to flow, mainly during periods coinciding with the occurrence of El Niño, with the events of 1958, 1977, 1992 and 2016 showing the largest magnitudes and/or intensities of hydrological drought.
In Colombia, most of the rivers in small basins have no records, and in many cases, the stations are located downstream of the main extractions, making it difficult to extrapolate these studies to other rivers, however, it is recommended to apply them to other rivers which are of importance to the country.
Acknowledgements
To the young researchers and innovators of the program - Colciencias 2015, to the Research Group in Water Resources and Soil Engineering (IREHISA), to Universidad del Valle, the CVC and IDEAM, and to all the entities that provided the information and people who in one form or another, contributed to this work.
REFERENCES
Cantú, P. C. (2014). Cambio climático: sus repercusiones para la sustentabilidad. Sustentabilidad Ecológica , 17(67), 31-36. [ Links ]
Carvajal-Escobar, Y. (2010). Dimensiones para usar metodologías en la estimación de caudales ambientales en Colombia. Respuestas, 15(2), 34-46. [ Links ]
Crossman, J., Futter, M. N., Oni, S. K., Whitehead, P. G., Jin, L., Butterfield, D., Baulch, P. J., & Dillon, P. J. (2013). Impacts of climate change on hydrology and water quality: Future proofing management strategies in the Lake Simcoe watershed, Canada. Journal of Great Lakes Research, 39(1), 19-32. Recuperado de https://doi.org/10.1016/j.jglr.2012.11.003 [ Links ]
El Tiempo. (3 de junio, 2016). El Niño devastó por incendios área equivalente a tres veces Cali. Esta sequía dejó en los niveles históricos más bajos al río. Recuperado de http://www.eltiempo.com/estilo-de- vida/ciencia/efectos-del-fenomeno-de-el- nino-en-colombia-2015-2016/16610226 [ Links ]
Enciso, A., Carvajal, Y., & Sandoval, M. C. (2016). Análisis hidrológico de las crecientes históricas del río Cauca en su valle alto. Revista Ingeniería y Competitividad, 18(1), 46-57. [ Links ]
Esquivel-Arriaga, G., Bueno, P., Sánchez-Cohen, I., Velásquez-Valle, M., & Esquivel-Arriaga, O. (2014). Evaluación del índice de sequía de caudales en cuencas del norte-centro de México. Agrofaz, 14(2), 53-60. [ Links ]
Forero, E., Hernández, Y., & Zafra, C. (2014). Percepción latinoamericana de cambio climático: metodologías, herramientas y estrategias de adaptación en comunidades locales. Una revisión. Revista UDCA Actualidad y Divulgación Científica, 17(1), 73-85. [ Links ]
García, M. C., Piñeros, A., Bernal, F. A., & Ardila, E. (2012). Variabilidad climática, cambio climático y el recurso hídrico en Colombia. Revista de Ingeniería, 0(36), 60-64. Recuperado de https://doi.org/10.16924/riua.v0i36.136 [ Links ]
Hao, Z., & Aghakouchak, A. (2014). A nonparametric multivariate multi-index drought monitoring framework. Journal of Hydrometeorology, 15(1), 89-101. Recuperado de https://doi.org/10.1175/JHM-D-12-0160.1 [ Links ]
Hao, Z., & Singh, V. P. (2015). Drought characterization from a multivariate perspective: A review. Journal of Hydrology, 527, 668-678. Recuperado de https://doi.org/10.1016/j.jhydrol.2015.05.031 [ Links ]
Hong, X., Guo, S., Zhou, Y., & Xiong, L. (2015). Uncertainties in assessing hydrological drought using streamflow drought index for the upper Yangtze River basin. Stochastic Environmental Research and Risk Assessment, 29(4), 1235-1247. Recuperado de https://doi.org/10.1007/s00477-014-0949-5 [ Links ]
IPCC, Panel Intergubernamental del Cambio Climático. (2014). Cambio climático 2014. Impactos, adaptación y vulnerabilidad. Madrid, España: Panel Intergubernamental del Cambio Climático. [ Links ]
Lau, C., Jarvis, A., & Ramírez, J. (2013). Agricultura colombiana: adaptación al cambio climático. Cali, Colombia. CIAT Políticas en Síntesis no. 1. Cali, Colombia: Centro Internacional de Agricultura Tropical (CIAT) [ Links ]
Moreno, J. M. (2006). Evaluación preliminar de los impactos en España por efecto del cambio climático. Boletin CF + S, 38/39, 37-56. Recuperado de https://doi.org/March 2006 [ Links ]
Nalbantis, I. (2008). Evaluation of a Hydrological Drought Index. European Water, 2324, 67-77. [ Links ]
Nalbantis, I., & Tsakiris, G. (March, 2009). Assessment of Hydrological Drought Revisited. Water Resources Management: An International Journal, Published for the European Water Resources Association (EWRA), Springer, European Water Resources Association (EWRA), 23(5), 881-897. [ Links ]
Núñez-López, D., Muñoz-Robles, C., Reyes-Gómez, V., Velasco-Velasco, I., & Gadsden-Esparza, H. (2007). Caracterización de la sequía a diversas escalas de tiempo en Chihuahua, México. Agrociencia, 41(3), 253-262. [ Links ]
OMM, Organización Meteorológica Mundial. (2012). Índice normalizado de precipitación Guía del usuario. Ginebra, Suiza: Organización Meteorológica Mundial. [ Links ]
Pérez-Valbuena, G. J., Arrieta-Arrieta, A. M., y Contreras-Anaya, J. G. (2015). Río Cauca: la geografía económica de su área de influencia. Economía Regional, (225), 17-52 [ Links ]
Peterson, C., Nowak, A., Jarvis, A., Navarrete, C., Figueroa, A., Riaño, N., & Vargas, E. (2012). Un enfoque multi-dimensional de la cuenca alta del río Cauca de Colombia, con énfasis en la vulnerabilidad. Cenicafé, 63(2), 116-123. [ Links ]
Pinilla, M. C., Rueda, A., Pinzón, C., & Sánchez, J. (2012). Percepciones sobre los fenómenos de variabilidad climática y cambio climático entre campesinos del centro de Santander, Colombia. Ambiente y Desarrollo, 16(31), 25-37. [ Links ]
Poveda, G., & Álvarez, D. (2012). El colapso de la hipótesis de estacionariedad por cambio y variabilidad climática: implicaciones para el diseño hidrológico en ingeniería. Revista de Ingeniería , 36, 65-76. [ Links ]
Quintero-Angel, M., Carvajal-Escobar, Y., & Aldunce, P. (2012). Adaptación a la variabilidad y el cambio climático: intersecciones con la gestión del riesgo. Revista Luna Azul, (34), 257-271. Recuperado de https://www.redalyc.org/articulo.oa?id=321727348015 [ Links ]
Rajsekhar, D., Singh, V. P., & Mishra, A. K. (2015). Multivariate drought index: An information theory based approach for integrated drought assessment. Journal of Hydrology, 526, 164-182. Recuperado de https://doi.org/10.1016/j.jhydrol.2014.11.031 [ Links ]
Ravelo, A., Sanz, R., & Douriet, J. C. (2014). Detección, evaluación y pronóstico de las sequías en la región del Organismo de Cuenca Pacífico Norte, México. Agriscientia, 31(1), 11-24. [ Links ]
Rojo, J. (2011). Desarrollo de un sistema experto para la predicción de caudales medios mensuales en Colombia. Recuperado de http://www.bdigital.unal.edu.co/5493/ [ Links ]
Schewe, J., Heinke, J., Gerten, D., Haddeland, I., Arnell, N. W., Clark, D. B., Dankers, R., Eisner, S., Fekete, B. M., Colón-González, F. J., Gosling, S. N., Kim, H., Liu, X., Masaki, Y., Portmann, F. T., Satoh, T., Stacke, T., Tang, Q., Wada, Y., Wisser, D., Albrecht, T., Frieler, K., Piontek, F., Warszawski, L., & Kabat, P. (2014). Multimodel assessment of water scarcity under climate change. Proceedings of the National Academy of Sciences of the United States of America, 111(9), 3245-50. Recuperado de https://doi.org/10.1073/pnas.1222460110 [ Links ]
Tabari, H., Nikbakht, J., & Hosseinzadeh-Talaee, P. (2013). Hydrological drought assessment in Northwestern Iran Based on Streamflow Drought Index (SDI). Water Resources Management, 27(1), 137-151. Recuperado de https://doi.org/10.1007/s11269-012-0173-3 [ Links ]
Ulloa, A. (2014). Dimensiones culturales del clima: indicadores y predicciones entre pobladores locales en Colombia. Batey: Revista Cubana de Antropología Sociocultural, 6, 17-33. [ Links ]
Van Loon, A. F., & Laaha, G. (2015). Hydrological drought severity explained by climate and catchment characteristics. Journal of Hydrology , 526, 3-14. [ Links ]
Vicario, L., García, C. M., Teich, I., Bertoni, J. C., Ravelo, A., & Rofríguez, A. (2015). Caracterización de las sequías meteorológicas en la región central de la Argentina. Tecnología y ciencias del agua, 6(1), 153-165. [ Links ]
Vicente-Serrano, S., Beguería, S., Lorenzo-Lacruz, J., Camarero, J., López-Moreno, J., Azorín-Molina, C., Revuelto, J., Morán-Tejeda, E., & Sánchez-Lorenzo, A. (2012). Análisis comparativo de diferentes índices de sequía para aplicaciones ecológicas, agrícolas e hidrológicas. In Asociación Española de Climatología (ed.). 8o Congreso Internacional de la Asociación Española de Climatología (pp. 679-689). Salamanca. [ Links ]
Wagner, F., Rossi, V., Stahl, C., Bonal, D., & Hérault, B. (2012). Water availability is the main climate driver of neotropical tree growth. Plos One, 7, DOI: 10.1371/journal.pone.0034074 [ Links ]
Wheeler, T., & Braun, J. V. (2013). Climate change impacts on global food security. Science, 341(2012), 508-513. Recuperado de http://science.sciencemag.org/content/341/6145/508 [ Links ]
Received: August 13, 2017; Accepted: April 02, 2019
 Este es un artículo publicado en acceso abierto bajo una licencia Creative Commons
