




Servicios Personalizados
Revista
Articulo
 texto en
 Inglés (pdf)
 Artículo en XML
 Referencias del artículo

 Traducción automática
 Enviar artículo por email
Indicadores
-
 Citado por SciELO
-
 Accesos
Links relacionados
-
 Similares en
SciELO
Compartir

 Permalink

Revista mexicana de ciencias agrícolas
versión impresa ISSN 2007-0934
Rev. Mex. Cienc. Agríc vol.17 no.1 Texcoco ene./feb. 2026 Epub 24-Abr-2026
https://doi.org/10.29312/remexca.v17i1.3941
Articles
Fluctuations and risks of staple crops in Mexico
1Universidad Autónoma Chapingo. Carretera México-Texcoco km 38.5, Chapingo, Estado de México. CP. 56230.
2Campo Experimental Valle de México-INIFAP. Carretera los Reyes-Texcoco km 13.5, Texcoco, Estado de México. CP. 56250.
3Colegio de Posgraduados. Carretera México-Texcoco km 36.5. Montecillo, Texcoco, Estado de México. CP. 56264.
Agricultural production is highly volatile, due to climatic, economic, and political factors, generating risk and uncertainty for producers and institutions. Such volatility has high economic costs and, in extreme events, can mean considerable losses. This research aimed to identify fluctuations in the production of staple crops in Mexico (corn, beans, wheat, and rice) during the 1993-2022 period, as well as their cyclical patterns and empirical regularities. Econometric time series models, the Hodrick-Prescott dynamic filter, and stationarity and cointegration tests were applied. The production cycles of staple crops are of medium length and exhibit a weakly negative correlation with total GDP. Corn and wheat have less variability, whereas beans and rice have greater variability. Such fluctuations increase risks and production costs. In order to strengthen food security, it is recommended to implement risk insurance and coverage policies, as well as strategies that mitigate production volatility.
Keywords: Hodrick-Prescott dynamic filter; staple crop production cycles; stationarity and cointegration
La producción agrícola es muy volátil, debido a factores climáticos, económicos y políticos, lo que genera riesgo e incertidumbre en los productores y en las instituciones. Esa volatilidad tiene costos económicos significativos y en los eventos extremos, puede significar pérdidas considerables. Los objetivos de esta investigación fueron identificar las fluctuaciones de la producción de los cultivos básicos en México (maíz, frijol, trigo y arroz), durante el periodo 1993-2022, así como sus patrones cíclicos y regularidades empíricas. Se aplicaron modelos econométricos de series de tiempo, el filtro dinámico Hodrick-Prescott y las pruebas de estacionariedad y de cointegración. Los ciclos de producción de los cultivos básicos son de duración media y exhiben una correlación débilmente negativa con el producto interno bruto total. El maíz y el trigo presentan menor variabilidad, mientras que el frijol y el arroz, una mayor. Esas fluctuaciones aumentan los riesgos y los costos de producción. Con el fin de fortalecer la seguridad alimentaria, se recomienda instrumentar políticas de aseguramiento y cobertura contra el riesgo, así como estrategias que mitiguen la volatilidad en la producción.
Palabras clave: ciclos de la producción de cultivos básicos; estacionariedad y cointegración; filtro dinámico Hodrick-Prescott
Introduction
Staple crops are very important not only because they are essential in the diet of Mexicans but also because they are the most important group of crops in Mexican agriculture. They are also the most significant in agricultural imports; in 2024, 46.7 million tons of staple grains and oilseeds were imported, with a value of 17 700 million dollars. A total of 23.6 million tons of corn were imported, along with 5.3 million tons of wheat, 1.03 million tons of rice, and 0.23 million tons of beans, according to Grupo Consultor de Mercados Agrícolas (GCMA, 2025).
All of the above factors affect the income, costs and risk faced by farmers, which has important implications for the national economy, particularly for Mexico’s trade balance and food security: ‘a situation in which all people have physical and economic access to sufficient safe and nutritious food to meet their dietary needs and develop a healthy life’ (FAO, 2015).
Research on cycles, both at the macroeconomic and sectoral levels and by crop group, is vital in the process of defining appropriate and efficient economic policies. According to González-Estrada (2025), research on business cycles is essential for understanding the dynamics of Mexico’s agricultural sector and their impact on the economy and food security. In particular, research into cyclical fluctuations in staple crops will allow us to understand the internal and external factors influencing agricultural stability and its risks.
According to González-Estrada et al. (2007); Almendra-Arao et al. (2008), variations in the production of staple crops are closely related to extreme climate events, volatility in international prices, and changes in production conditions and public policies, especially those that are inconsistent or erroneous.
Studies by authors such as Obstfeld and Rogoff (1996) indicate that external sector activities are riskier. Crops linked to foreign trade have a higher exposure to risk (Komarek et al., 2020). Díaz-Carreño et al. (2007) show that production fluctuations follow structured cyclical patterns and show autocorrelation, especially in crops integrated into global markets.
The objectives of this research were: a) to identify the fluctuations in the production of staples crops in Mexico, during the 1993-2022 period, a period corresponding to the liberalization of the country’s foreign trade; b) to analyze cyclical patterns and assess the relationship between the cycles of total gross domestic product (GDP), agricultural GDP, and staple crops, using econometric time series models; and c) to study the underlying risks. The hypotheses were: 1) the production of staple crops has greater volatility than total GDP and agricultural GDP; and 2) the risk of staple crops is greater than the average risk faced by other economic activities.
Materials and methods
Annual data on total GDP, agricultural GDP, and the total production value of the four staple crops in Mexico: corn, beans, rice, and wheat, as well as annual production data, were collected based on SIAP (2022); INEGI (2022). Statistical analyses were performed in Econometric Views, version 12.
The extraction of the cyclical and growth components was carried out using the method by Hodrick and Prescott (1997), widely used in the analysis of macroeconomic time series. According to González-Estrada et al. (2007), the method decomposes a time series into two parts: a) the secular or growth trend
The corresponding nonlinear mathematical programming problem expressed through the Lagrange function is:
s.t:
If
The first-order condition is:
According to Hodrick and Prescott (1997), if the cyclical component and the second difference of the trend were independently distributed, normal variables with zero mean and variance,
An economic cycle is defined as the period between two troughs, including peaks, troughs, expansions, contractions, recoveries and slowdowns (Sánchez-Juárez, 2019). An expansion occurs when GDP increases consecutively for at least two consecutive quarters and exceeds the corresponding value in the secular component of growth. A contraction occurs when GDP declines steadily for at least two consecutive quarters, below its secular trend. The recovery phase is when GDP begins to approach its trend level gradually. In contrast, the slowdown phase occurs when GDP falls below its trend (Sánchez-Juárez, 2019; Schumpeter, 2002).
According to Harding and Pagan (2002), if
The New Classical School (NCS) addresses economic fluctuations with the theory of general stochastic dynamic equilibrium of the economy and the theory of real business cycles, unifying the analysis of growth and business cycles (González-Estrada, 2018). Cyclical fluctuations are understood as the co-movements of deviations from the trend in various macroeconomic series. Prescott (1998); Kydland and Prescott (1990, 1982) highlight the importance of analyzing these co-movements with respect to GDP and its trend. This allows us to identify episodes of volatility and phase change in the economic cycle.
According to Almendra-Arao (2007), to obtain the secular trend and its cyclical component, given a time series V: a) the logarithm LV is calculated; b) the Hodrick-Prescott (1997) filter is applied to LV to obtain the growth component TV; c) the cyclical component is calculated as:
The volatility of a variable
There is a phase change if the cyclical component of a variable
Unit root tests are important tools for time series analysis and for determining the stationarity of the series. According to Almendra-Arao et al. (2008), a time series is stationary if the mean and autocovariance of the series are not time-dependent; it is integrated of order
The superior autocorrelation test was the Breusch-Godfrey test, which detected autocorrelation in the residuals of an AR(p) regression model from an ARMA(p, q) (Gujarati, 2010). Let the model be: AR(p):
Results and discussion
The cyclical components and the growth of agricultural GDP for the 1993-2022 period were calculated with the method by Hodrick and Prescott (1997), with the parameter
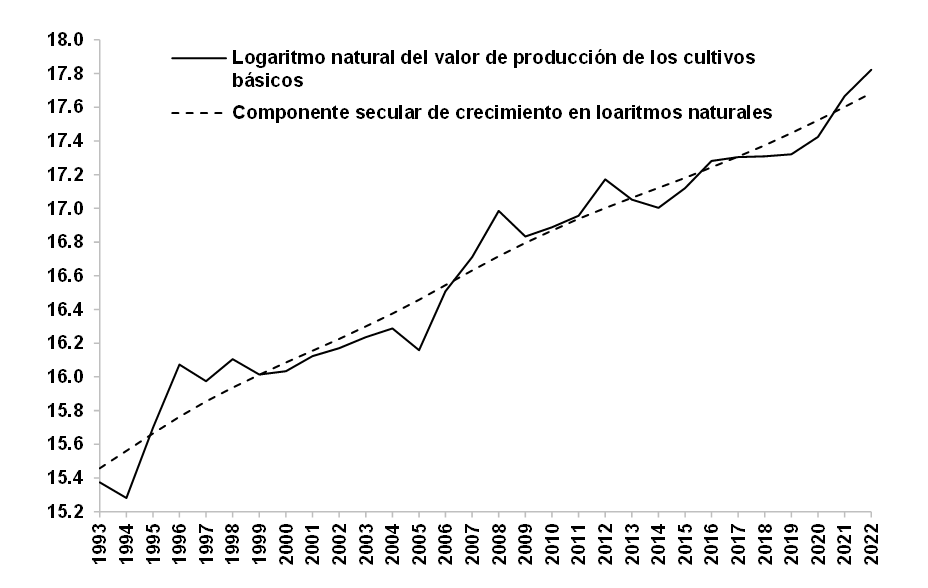
Total GDP exhibited relatively stable growth, whereas agricultural GDP and the production value of staple crops were more volatile, but with a positive long-term trend. The fluctuations in each staple crop are not uniform: corn and wheat have more structured patterns, whereas beans are characterized by high volatility.
In the 1993-2022 period, agricultural GDP showed five trough-to-trough (TT) cycles and five peak-to-peak (PP) cycles. It was in expansion during 70.37% of the time and in contraction during 29.62% of the time. These fluctuations, with average lengths of 4.75 and 5.4 years, respectively, indicate that agricultural GDP gave rise to short cycles. Similarly, morphology tests on the production value of corn, beans, wheat, and rice also identified this type of short cycle.
For the production value of staple crops from 1993 to 2022, three (TT) cycles and five (PP) cycles were identified. It was expanding during 62.96% of the time and contracting during 37.03% of the time. These fluctuations with mean lengths of 7.6 and 7.66 years indicate that the cycles were medium-term or Juglar-type, as can be seen in Figure 2.
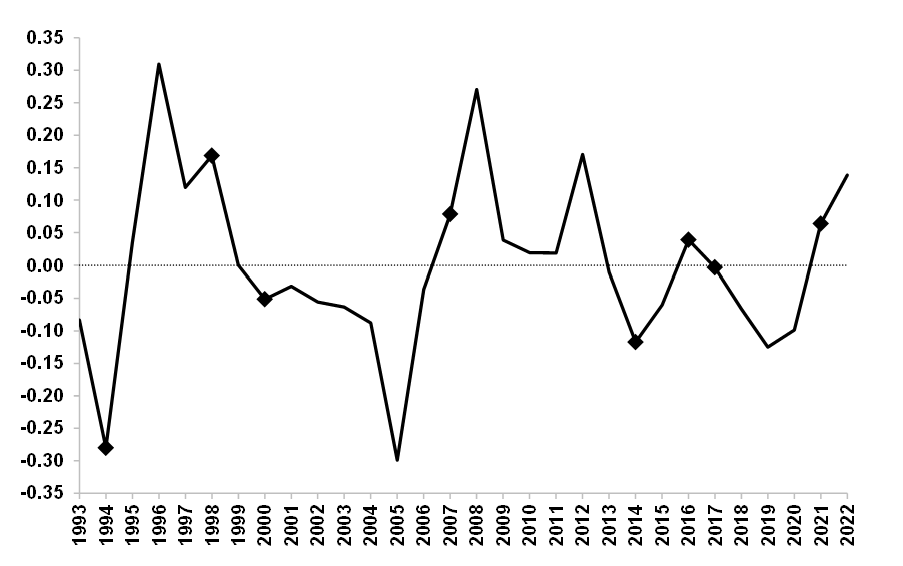
Figure 2 Depressions and peaks, contractions and recoveries in the production value of staple crops in Mexico, 1993-2022.
Table 1 and 2 show that fluctuations in the production value of staple crops are irregular, have different magnitudes, amplitudes and lengths, but are neither periodic nor symmetrical; this also holds for fluctuations in agricultural GDP and in the production value of crops independently (corn, beans, wheat and rice).
Table 1 Basic statistics of the trough-to-trough cycle of the production value of staple crops in Mexico, 1994-2022.
| Trough-to-trough cycle | Mean | Standard deviation | Minimum | Median | Maximum | Kurtosis | Coef. of skewness |
|---|---|---|---|---|---|---|---|
| 1994-2000 | 0.0431 | 0.1861 | -0.28 | 0.035 | 0.3094 | 0.9414 | -0.4827 |
| 2000-2014 | -0.0106 | 0.1287 | -0.299 | -0.0319 | 0.2703 | 2.02 | 0.1131 |
| 2014-2017 | -0.0354 | 0.0683 | -0.1174 | -0.0317 | 0.0393 | -1.552 | -0.2449 |
Table 2 Basic statistics of the peak-to-peak cycle of the production value of staple crops in Mexico, 1994-2022.
| Peak-to-peak cycle | Mean | Standard deviation | Minimum | Median | Maximum | Kurtosis | Coef. of skewness |
|---|---|---|---|---|---|---|---|
| 1998-2007 | -0.0379 | 0.1199 | -0.299 | -0.044 | 0.1683 | 2.6746 | -0.6079 |
| 2007-2016 | 0.0447 | 0.1104 | -0.1174 | 0.029 | 0.2703 | 1.0563 | 0.8148 |
| 2016-2021 | -0.0316 | 0.0767 | -0.1249 | -0.0346 | 0.064 | -2.0576 | 0.0637 |
Cycles represent the regularity of fluctuations. The phases of the agricultural cycles and the production value of staple grains in Mexico are irregular: they are neither periodic nor symmetrical. According to González-Estrada and Almendra-Arao (2007); Almendra-Arao et al. (2008), the same characteristics are observed in the Mexican economy’s economic cycles (Figure 3).
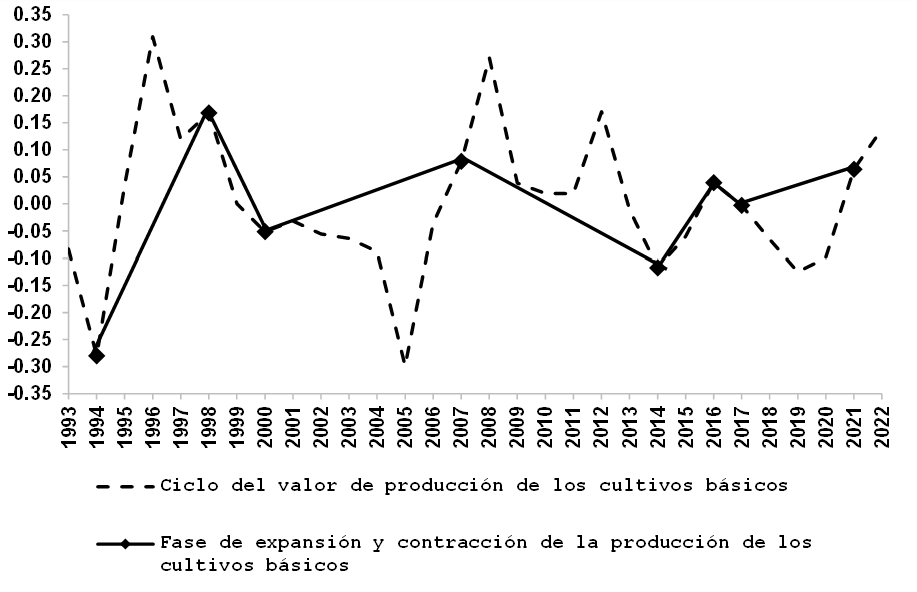
Figure 3 Recoveries, peaks, recessions and depressions in the production value of staple crops in Mexico, 1993-2022.
The standard deviation of the value of staple crops is 0.1335, and that of agricultural GDP is 0.03, so the production value of staple crops is four times more volatile than agricultural GDP. The standard deviation of corn, beans, wheat, and rice was evaluated in relation to the total production value and contrary to expectations, it was observed that: a) corn is less volatile (0.9844), which makes it the most stable of the staple crops, and b) rice is the most unstable, with a volatility of (1.7909).
Agricultural GDP shows a procyclical relationship with GDP (correlation coefficient (cc)= 0.353). That for the production value of staple crops and agricultural GDP is also procyclical (cc= 0.2572). Nevertheless, the production value of staple crops and GDP have an acyclic relationship (cc= -0.1048). The correlation coefficient between the cycles of the production value of staple crops and of each component: corn, beans, wheat, rice, present positive values and are therefore procyclical. The phase change in the cyclical component of GDP and the production value of staple crops is negative, indicating opposite trends. The agricultural GDP cycle and the production value of staple grains have a positive phase change and move in the same direction (Table 3).
Table 3 Correlation matrix of the cyclical component (Cc) of agricultural GDP and the cyclical component of the production value of staple crops (PVSC).
| X(t-5) | X(t-4) | X(t-3) | X(t-2) | X(t-1) | X(t) | X(t+1) | X(t+2) | X(t+3) | X(t+4) | X(t+5) | |
|---|---|---|---|---|---|---|---|---|---|---|---|
| Cc of PVSC | 0.183 | -0.222 | -0.414 | -0.271 | -0.049 | 0.257 | -0.129 | -0.122 | -0.071 | 0.138 | 0.184 |
The analyses of the stationarity test of the production value of staple crops and of each crop: corn, beans, wheat and rice, indicate that most of the series are stationary at different confidence levels and that they are integrated variables of order
To analyze the long-term relationship between GDP and agricultural GDP cycles, an ordinary least squares regression was performed, residuals were obtained, an autoregressive process of order four was performed, and the Breusch-Godfrey test was applied. The cointegration vector of the economic GDP and agricultural GDP cycles, calculated based on Engle and Granger (1987), is: (1, 0.35757), and the cointegration equation is: cycle of GDP = 0.35757 × cycle of agricultural GDP (Table 4).
Table 4 Breusch-Godfrey test for contrasts.
| F statistic | 3.65204 | Prob. F(2,26) | 0.0400 |
| R2 | 6.57945 | Prob. Chi-R2(2) | 0.0373 |
Since the value
Conclusions
The production value of staple crops is fluctuating and four times more volatile than agricultural GDP, so the risk costs are higher. There were medium-length cycles in the aggregated production value of staple crops. Fluctuations in the production value of staple crops have a procyclical relationship with agricultural GDP and an acyclical relationship with GDP.
Beans and rice show greater volatility than corn and wheat because they are relatively more influenced by agricultural policies, foreign trade, and climatic conditions. In addition, producers of different staple crops do not face the risk in a homogeneous way, reinforcing the need to design differentiated coverage policies in order to contribute to the country’s food security and economic development.
It was not possible to discuss the above results in the light of other research on the subject, because the present study is unique to Mexico. In addition, another ongoing study is investigating the causes of the fluctuations and cycles investigated here.
Bibliografía
Agénor, P. R.; McDermott, C. J. and Prasad, E. S. 2000. Macroeconomic fluctuations in developing countries: Some stylized facts. The World Bank Economic Review. 14(2):251-285. [ Links ]
Almendra-Arao, G. 2007. Las fluctuaciones cíclicas de la economía mexicana. Tesis de doctorado. Colegio de Posgraduados en Ciencias Agrícolas. Montecillos, Estado de México. 147 p. [ Links ]
Almendra-Arao, G. y González-Estrada, A. 2008. Soluciones explícitas para el filtro estadístico Hodrick-Prescott. Rev. Mex. Econ. Agríc. Rec. Nat. 1(1):105-115. [ Links ]
Almendra-Arao, G.; González-Estrada, A. y Mora-Flores, J. S. 2008. Los ciclos económicos de México y sus regularidades empíricas. Agrociencia. 42(3):3-299. [ Links ]
Díaz-Carreño, M. Á.; Juárez-Toledo, R. y Gómez-Chagoya, M. D. C. 2007. Conformación de una cartera de inversión óptima de cultivos agrícolas para México. Economía, Sociedad y Territorio. 7(25):49-63. [ Links ]
Engle, R. F. and Granger, C. W. J. 1987. Co-integration and error correction: representation, estimation, and testing. Econometrica. 55(2):251-276. [ Links ]
FAO. 2015. Food and Agricultural Organization. The state of food insecurity in the world, 2015. Rome. 61 p. [ Links ]
González-Estrada, A. 2025. Programación dinámica con aplicaciones a la economía. Ed. Mix Ba'al. Chapingo, Estado de México. 612 p. [ Links ]
González-Estrada, A. 2018. Teorías macroeconómicas Actuales. Ed. Mix Ba'al. Chapingo, Estado de México. 192 p. [ Links ]
González-Estrada, A. y Almendra-Arao, G. 2007. Nuevo método para la identificación de los ciclos económicos. Investigación Económica. 261(66):13-33. [ Links ]
GCMA. 2025. Grupo consultor de mercados agrícolas. Compras de granos y oleaginosas. Entrevista Juan Carbajal. Jornada, Sección Economía, 16 de enero. Ciudad de México. [ Links ]
Gujarati, D. N. 2010. Essentials of econometrics. SAGE Publications. Thousand Oaks, CA. 412-466 pp. [ Links ]
Hamilton, J. D. 2020. Time Series Analysis. Princeton University Press. New Jersey. 475-543 pp. [ Links ]
Hamilton, J. D. 1989. A new approach to the economic analysis of nonstationary time series and the business cycle. Econometrica. 57(2):357-384. [ Links ]
Harding, D. and Pagan, A. R. 2002. Dissecting the cycle: a methodological investigation. Journal of Monetary Economics. 49(2):365-381. [ Links ]
Hodrick, R. J. and Prescott, E. C. 1997. Postwar U.S. Business cycles: an empirical investigation. Journal of Money, Credit and Banking. 29(1):1-16. [ Links ]
INEGI. 2022. Instituto Nacional de Estadística y Geografía e Informatica. Economía y Sectores Productivos. https://www.inegi.org.mx/temas/pib/#tabulados. [ Links ]
Kydland, F. E. and Prescott, E. C. 1990. Business cycles: real facts and a monetary myth. Quarterly Review, Federal Reseve Bank of Mineapolis. 14(2):3-18. [ Links ]
Kydland, F. E. and Prescott, E. C. 1982. Time to build and aggregate fluctuations. Econometrica. 50(6):1345-1370. [ Links ]
Komarek, A. M.; De Pinto, A. and Smith, V. H. 2020. A review of types of risks in agriculture: what we know and what we need to know. Agricultural Systems. 178(102738):1-12. [ Links ]
Obstfeld, M. and Rogoff, K. S. 1999. Foundations of International macroeconomics. The MIT Press. Boston, M. A. 830 p. [ Links ]
Prescott, E. C. 1998. Business cycle research: methods and problems. Working paper 590. Federal Reserve Bank of Minneapolisis. Minneapolis. [ Links ]
Sánchez-Juárez, I. 2019. Ciclos económicos en México: identificación, profundidad y duración. Universidad Nacional Autónoma de México (UNAM). Revista de Economía. 16(47):93-108. [ Links ]
Schumpeter, J. A. 2002. Ciclos económicos: análisis teórico, histórico y estadístico del proceso capitalista. Prensas Universitarias. Zaragoza, España. 459-477 pp. [ Links ]
SIAP. 2022. Servicio de Información Agroalimentaria y Pesquera. Secretaría de Agricultura y Desarrollo Rural. Ciudad de México, México. [ Links ]
Received: November 01, 2025; Accepted: January 01, 2026
 Este es un artículo publicado en acceso abierto bajo una licencia Creative Commons
