


Serviços Personalizados
Journal
Artigo
 texto em
  Inglês (pdf)
 Artigo em XML
 Referências do artigo
 Enviar este artigo por email
Indicadores
-
 Citado por SciELO
 -
 Acessos
Links relacionados
-
 Similares em
SciELO
Similares em
SciELO
Compartilhar

 Permalink
Revista mexicana de ciencias agrícolas
versão impressa ISSN 2007-0934
Rev. Mex. Cienc. Agríc vol.9 no.6 Texcoco Ago./Set. 2018
https://doi.org/10.29312/remexca.v9i6.1583
Articles
Temporal analysis of the organic carbon content of the soil in an arid region of Mexico
1 Antonio Narro Agrarian Autonomous University-Postgraduate Program in Agricultural Sciences. Laguna Unit. Peripheric and road Santa Fe, s/n. Torreón, Coahuila. (pyescas-68@hotmail.com; vdpar-190754@hotmail.com; mgc570118@hotmail.com; vhernandezhernandez@yahoo.com.mx).
2Technological Institute of Torreón-DEPI. Road Torreón-San Pedro km 7.5, ejido Anna, Torreón, Coahuila, Mexico. CP. 27170. Tel. 01 (871) 7507198. (dmilys5@hotmail.com).
3National Center for Disciplinary Research in Relation to Water Soil Atmosphere Plant (CENID-RASPA). Development km 6.5 right margin channel Sacramento, Gómez Palacio, Durango, Mexico.
The content and behavior of soil organic carbon (COS) in arid regions; through time, they are unknown, even though bovine manure amendments in these soils have become important in the extensive agricultural systems of those regions, there is no information that reveals the changes in the status of the COS. For this reason, the objectives of this research were to establish the distribution of the COS content of the municipality of Matamoros, Coahuila, and to determine the changes in its concentration over time. Soil samples from the surface layer (0-30 cm) in 2015, were collected, to estimate the COS content. These data and their georeferences were used to perform an interpolation with the Ordinary Krigin geostatistical method and obtain a thematic map of COS distribution. Likewise, COS base data for 2002, acquired from previous work, were used to obtain another thematic map of the municipality. The maps were compared with a cross-referenced table and with the Kappa concordance index (ICK). The results showed that the maps are not the same, as confirmed by the ICK= 0.1, in such a way that in thirteen years the COS increased 65 511.88 Mg. The determination of the COS content and the establishment of its spatial distribution, as well as its comparison with data and base maps of existing COS, allowed to determine the changes in the COS contents over time.
Keywords: cartography; COS; Kappa
El contenido y comportamiento del carbono orgánico del suelo (COS) en regiones áridas; a través, del tiempo son desconocidos, aun cuando las enmiendas de estiércol bovino en estos suelos han tomado importancia en los sistemas agrícolas extensivos de esas regiones, no existe información que revele los cambios en el estatus del COS. Por tal motivo, los objetivos de esta investigación fueron establecer la distribución del contenido de COS del municipio de Matamoros, Coahuila y determinar los cambios en su concentración, través del tiempo. Muestras de suelo de la capa superficial (0-30 cm) en el año 2015, se colectaron, para estimar el contenido de COS. Estos datos y sus georreferencias se utilizaron para realizar una interpolación con el método geoestadístico Krigin Ordinario y obtener un mapa temático de distribución de COS. Asimismo, datos base de COS del año 2002, adquiridos de un trabajo previo, se emplearon para obtener otro mapa temático del municipio. Los mapas fueron comparados con una tabla de referencias cruzadas y con el índice de concordancia Kappa (ICK). Los resultados mostraron que los mapas no son iguales, como lo confirmo el ICK= 0.1, de tal manera que en trece años el COS se incrementó 65 511.88 Mg. La determinación del contenido de COS y el establecimiento de su distribución espacial, así como su comparación con datos y mapas base de COS existentes, permitieron determinar los cambios en los contenidos de COS a través del tiempo.
Palabras clave: cartografía; COS; Kappa
Introduction
The soil-vegetation system plays an important role in the increase or reduction of CO2 concentrations in the atmosphere, since it depends on the rate of formation and decomposition of organic carbon in the soil (Singh et al., 2007), reason whereby the soil resource is one of the largest carbon (C) terrestrial reservoirs on the planet (Steffen et al., 2007). However, given the increase in the amount of CO2 in the atmosphere and the recommendation that was made in the Kyoto Protocol of the Intergovernmental Panel on Climate Change, interest in the dynamics of soil organic carbon (COS) in the world, seeking alternatives for their capture (IPCC, 2006). In this sense, to estimate the C capture potential in the soil under different scenarios, it is necessary to distinguish two questions: a) what is the original existence of carbon in the soil? and b) what are the changes in the existence of it? (Batjes, 1999).
The base data of a specific place, serve for the evaluation of the COS content in arid and semi-arid regions (Luo et al., 2011). The element C plays an important role, directly or indirectly in the behavior of the soil (Lal et al., 2004) since it constitutes an essential part of crop residues or of vegetables, besides it is part of mineral compounds such as carbonates, which they influence the stability of aggregates in the soil (Holland, 2004). The method that is commonly applied to know the content of C is the determination of the COS at different depths or globally, for one or more horizons and later, the data are transformed taking into account the apparent density (Da) and soil stoniness (Eller et al., 2006). One of the alternatives that have been used to know the COS, is the analysis of data of soil profiles with the use of geographic information systems (SIG), to generalize the information; through, of statistical or geostatistical interpolation methods; however, well-referenced data have been lacking (FAO, 2002).
In this regard, the soils of Mexico have an average of 1.8% CO, which represents a total content of 10.5 Pg of COS in the surface layer (from 0 to 20 cm deep), where the lowest contributions are found in arid regions, while, by land use, irrigated agriculture showed the lowest COS content (Segura-Castruita et al., 2005). Also, in recent works, a total of COS of 8.46, 8.54 and 8.578 Pg, respectively, have been reported, after analyzing data of soil profiles of Mexico (21 196 profiles) in order to assign COS to polygons of the vector charts of land use and vegetation (USV) of series II, III and IV of INEGI (Paz-Pellat et al., 2012). Although, Cruz and Paz (2013) when assigning COS values to USV series IV polygons, reported a global amount of C for Mexico of 9.14 Pg. However, even when national information is available, and mainly from temperate regions and tropical (Segura-Castruita et al., 2005), the arid and semi-arid regions have been less studied; although, Montaño et al. (2016) revealed generalities about how their high spatio-temporal heterogeneity affects the warehouses and flows of C.
However, information related to changes in organic carbon content after years of application of organic amendments to agricultural soils in these regions is scarce. For example, some soils in the agricultural area of irrigation district 017, which is located in the Comarca Lagunera between the states of Coahuila and Durango, receive year after year depending on the production system, organic amendments that vary from 80 to 120 t ha-1 (Fortis-Hernández et al., 2009). However, there is no information about the status of COS concentration in soils, since the only existing source of information has been generated more than ten years (Segura-Castruita et al., 2005). When considering the above, it is likely that upon knowing the status of the COS, as well as its spatial distribution and comparing them with existing base information, the changes in COS contents will be determined; through, of the time in the Lagunera Region. For this reason, the objectives of this research were to establish the distribution of the COS content of the municipality of Matamoros, Coahuila, and to determine the changes in its concentration over time.
Study area
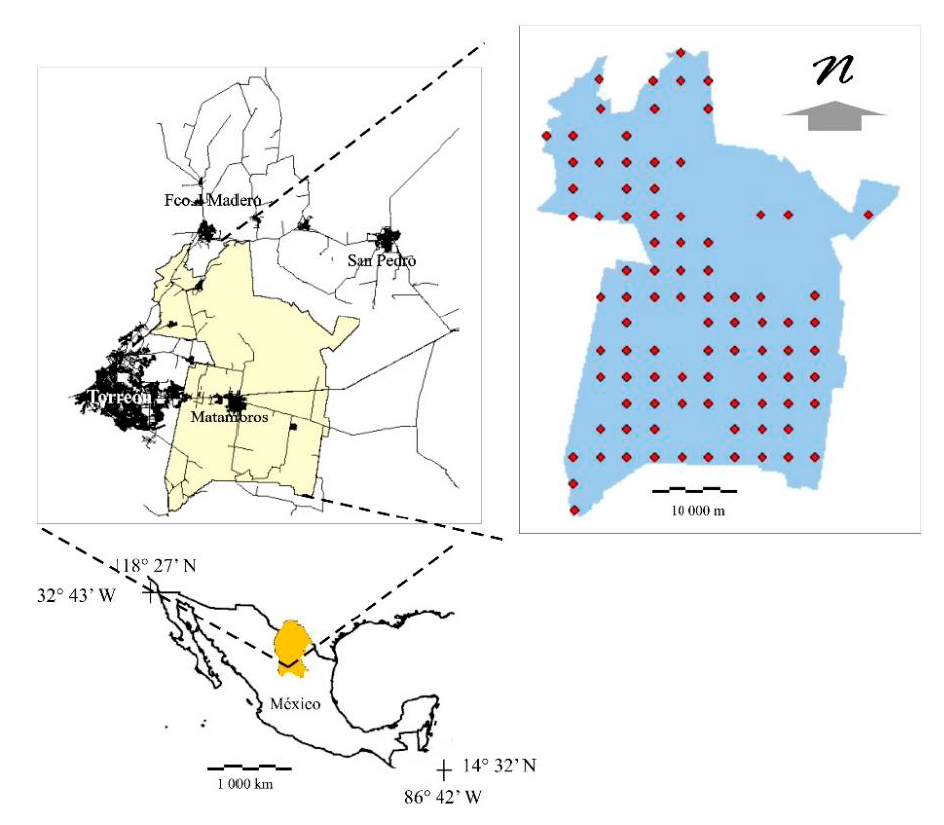
The work was carried out in the municipality of Matamoros (area of 80 799.21 ha), Coahuila; between the parallels 25° 23’ and 25° 48’ north and the meridians 103° 03’ and 103° 23’ west (Figure 1), at an altitude of 1 120 m. The zone is characterized by a very dry or desert climate, semi warm with summer rains and cool winter with extreme oscillation, whose annual total precipitation is 250 mm and average annual total evaporations that reach 2 500 mm (García, 2004). The geological elements belong to the Quaternary and Cretaceous periods, composed of alluvial and aeolian sediments, gypsum limestone and conglomerates. On the other hand, according to INEGI (2016), six groups of soils (Regosols, Cambisols, Calcisols, Leptosols, Fluvisols and Vertisols) have been identified, being their use mainly agricultural, with shrub vegetation, pastures and urban areas (INEGI, 2010).
The work was divided into four stages as described below:
Site selection and soil sampling. Samples of the surface layer (0-30 cm) of different soils (two kilograms approximately) were collected in the municipality of Matamoros, Coahuila. The soils corresponded to sites that were selected by superimposing a 2.5 x 2.5 km grid in the polygon of the study area (Figure 1), where the vertices of the grid corresponded to potential sampling sites, whose geographic coordinates were recorded to later go to the field, as indicated by Segura-Castruita et al. (2005). However, in the final choice of the sites, the accessibility of the places (paved roads, dirt roads and gaps) was taken as criteria, using the topographic charts of the INEGI (2016). Each site was georeferenced with a Garmin Etrex GPS. Subsequently, with the location data and different characteristics of the soils, a database was generated. Likewise, an interview was conducted with the producers who owned the plots or places where the sampling sites were located.
Obtaining organic carbon and apparent density. The bulk density (Da) was obtained by the paraffin method; while the percentage of organic carbon (CO) in the soil was determined by the wet combustion method of Walkley and Black (1934), as established in Mexican Standard NOM-021-RECNAT-2000 (SEMARNAT, 2002).
The COS calculation and its variation in the region was obtained with the equivalent mass method (COS calculation stored in a reference soil mass), taking into account the effect of the change in Da on the carbon of the stored soil, with equation (1) proposed by (Eller et al., 2006).
Where: SCDi represents the COS store in layer i (COSDi in Mg ha-1 of C); SCi represents the COSi content (g kg-1) in layer i; BDi is the apparent density (g cm-3) in layer i; and Hi is the thickness (cm) of layer i. The term ηi represents the percentage of particles with a size >2 mm in layer i. It will be reported for the surface layer (0-30 cm).
Spatial distribution of COS and comparison. The spatial distribution of the COS concentrations was obtained by performing an interpolation with the Ordinary Kriging geostatistical method (Cruz-Cardenas et al., 2010) in the ArcGIS 10.3 © software, where equation (2) was applied.
Where: Z(s) is the variable of interest (COS); μ(s) is the determinant and random trend in which the variable of interest (COS) is found; ε(s) is the autocorrelated error; and s indicates the location. This interpolation was useful for obtaining the thematic map of organic carbon from the surface layer of Matamoros soils, for the year 2015.
Besides, to analyze the COS contents of the map obtained in this work and its behavior over time, the data of percentage of CO and Da of the points obtained by Segura-Castruita et al. (2005) and the COS was calculated again with equation 1, it is important to clarify that the map values that these authors reported were not used, since the interpolation was done with the inverse distance interpolator (IDW), reason why which, to bring about a level playing field, the interpolation of the COS content of 2002 with the Ordinary Kriging method was carried out again as was done for the 2015 data.
The comparison of the two thematic maps was carried out with a cross-validation table, for which the CROSSTAB module of the Idrisi Selva software was used; also, the Kappa concordance index (ICK) was obtained between the two maps (Landis and Koch, 1977).
Results and discussion
Characteristics of the floors
The soil samples of the superficial layer that were collected in the municipality of Matamoros were 92, since some places were not allowed access or were paved. The Da of these soils varied from 1.03 to 1.57 g cm-3 (Table 1). The soils are used for agricultural purposes, urban and without apparent use. The agricultural soils have crops of alfalfa, cotton, beans, fodder maize, walnut and vegetables, some of intensive use with two annual crops (monocultures or intercrops), others with an annual crop (spring-summer cycle) and semi-perennial or perennial crops. These areas are irrigated, which can be irrigated with a gravity system or with deep well water. Also, some soils receive organic manure amendments and others do not. In such a way, that the percentages of organic carbon of the soils varied from 0.15 to 2.16% (Table 1).
Table 1 Descriptive statistics of carbon content, bulk density and pH.
| Variable | N* |
|
|
|
CV | Minimum | Maximum |
|---|---|---|---|---|---|---|---|
| CO (%) | 92 | 1.15 | 0.57 | (0.58 - 1.72) | 46.63 | 0.15 | 2.16 |
| Da (g cm-3) | 92 | 1.25 | 0.09 | (1.16 - 1.34) | 7.43 | 1.03 | 1.57 |
| COS (Mg ha-1) | 92 | 4.27 | 2.01 | (2.26 - 6.28) | 47.66 | 0.58 | 7.98 |
*N= number of samples;
The Da that was found in the study area, corresponded to soils with clay-to-sand textures, not compacted (Porta et al., 2010) that according to Heuscher et al. (2005), generally occur in soils with low percentages of CO. Situation that could be related to the type of vegetation that supports the soils, which is composed of xerophilous and rosethophilous scrub (INEGI, 2010). Montaño et al. (2016), indicated that this type of vegetation is common in the climates that prevail in the arid and semi-arid zones, and influence the contribution of carbon to the soil, as well as the intensive agricultural activities that influence the CO content (Becerra et al., 2014).
Organic carbon from soils in 2015
The superficial layer (0-30 cm) of the soils of the municipality of Matamoros in 2015 presented COS with a variation of 2.48 to 5.63 Mg ha-1, where the highest contents were found in the northwest and central part in a northwest-southeast direction of the municipality, which were grouped into classes >4.5 and 3.5-4.5 Mg ha-1, respectively; while the lower contents are to the northeast between the hills that are in Matamoros and in the southern part of the municipality (Figure 2).
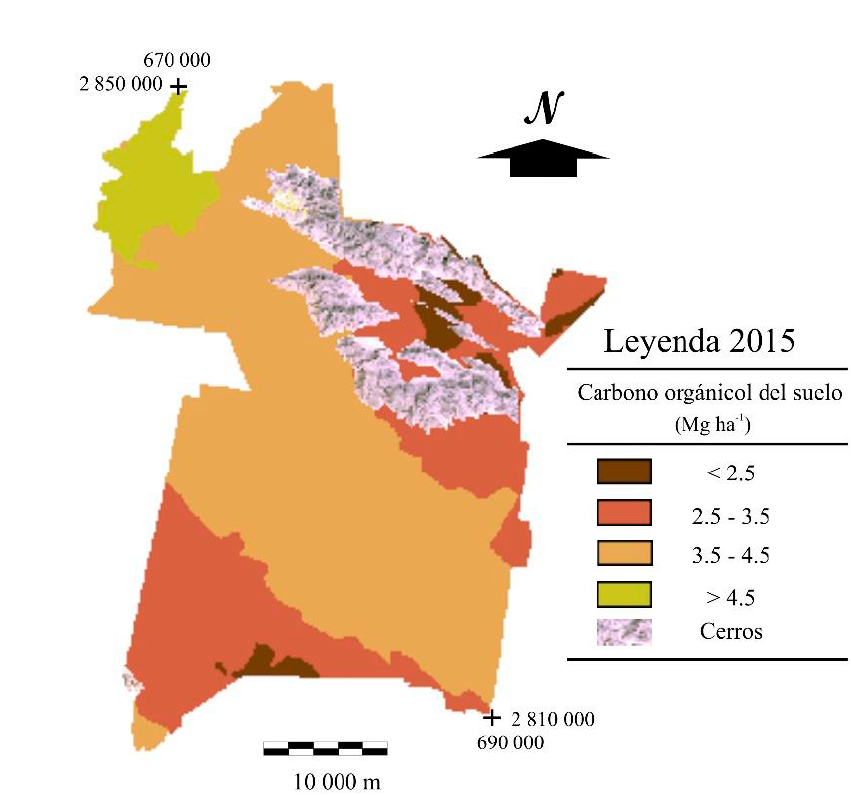
Figure 2 Spatial distribution of the organic carbon contents of the soils of the municipality of Matamoros, Coahuila.
On the other hand, class 3.5-4.5 Mg ha-1 occupied the largest area (46 266.66 ha) while the smallest area was occupied by soils with <2.5 Mg ha-1 with 4 493. 45 ha (Table 2). The contents of COS in the municipality are low compared to the range of COS contents (2.1 to 72 Mg ha-1) that have been reported for other arid regions of Mexico and the world (Díaz-Hernández et al., 2003; Elbasiouny et al., 2014; Montaño et al., 2016). In this sense, the accumulation of COS is related to the type of vegetation and climatic characteristics such as the annual precipitation index (Bui et al., 2009) and even soil management (Lents and Lersch, 2014). However, up to this point it is not possible to establish the magnitude of change in relation to the past of these soils.
Table 2 Modifications in organic carbon contents from 2002 to 2015 in Matamoros, Coahuila.
| Class | COS 2015 | |
|---|---|---|
| Area | Content | |
| (Mg ha-1) | (ha) | (Mg) |
| < 2.5 | 4 128.84 | 10 322.1 |
| 2.5 -3.5 | 25 920.38 | 77 761.14 |
| 3.5 - 4.5 | 46 257.55 | 185 030.2 |
| > 4.5 | 4 492.44 | 20 215.98 |
| Total | 80 799.21 | 293 329.42 |
The thematic map that was obtained from the 2002 of COS data and the georeferences reported by Segura-Castruita et al. (2005), it is different (Figure 3) that was obtained for 2015, since for 2002 only two classes of contents were established. The class 3.5 - 4.5 Mg ha-1, had the largest area (51 639.49 ha) which represented around 154 919.54 Mg, while the class 2.5 - 3.5 Mg ha-1 occupied an area of 29 159.22 ha, which had a content of 72 898.05 Mg, approximately; making a total of 227 817.54 Mg for the surface layer of Matamoros soils. The spatial distribution of the largest contents was found in the central part of the municipality. This content is lower than that obtained in our research (293 329.42 Mg), which means that in thirteen years the COS increased 65 511.88 Mg.
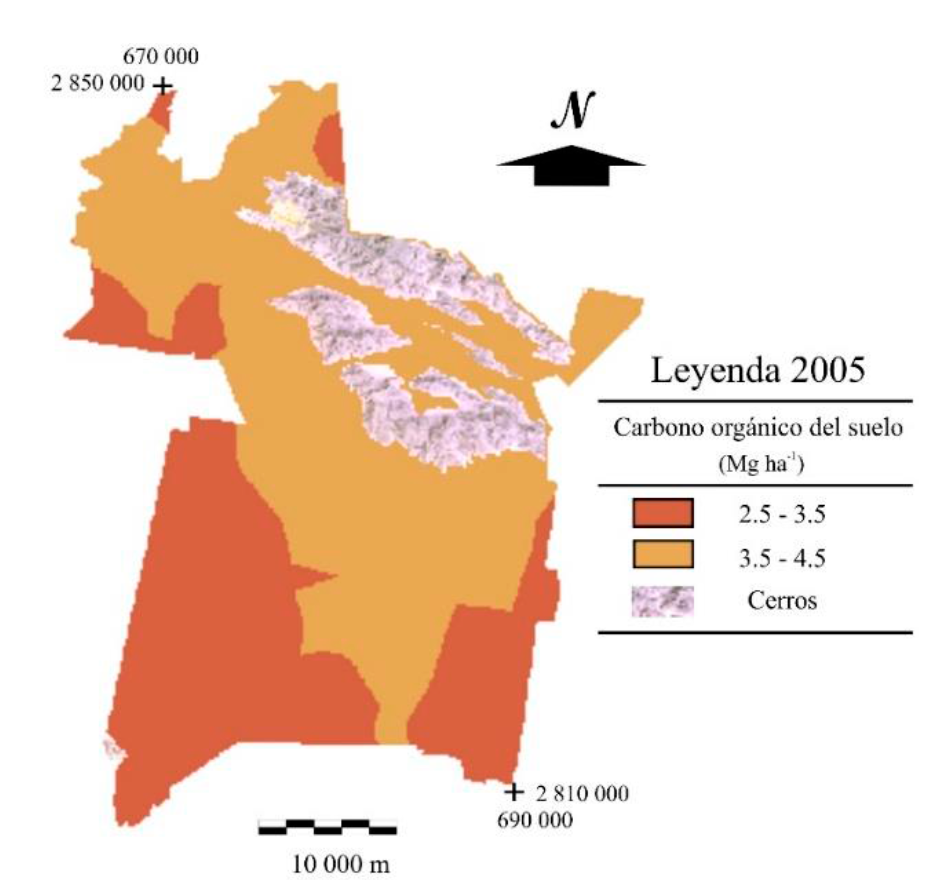
Figure 3 Distribution of the organic carbon contents of the soil of the superficial layer of Matamoros, Coahuila (adapted from Segura et al., 2005).
When comparing the COS content maps of the year 2002 and 2015, graphically it can be seen that they are different, as was confirmed by the ICK (0.10) which indicates that the maps have a very low concordance. Thus, in the 2002 map, two kinds of content appear, while in 2015, four were detected. The differences reflected changes between the COS of the two maps, which could be established when the cross-tabulation was carried out, where some areas increased and others decreased (Figure 4).
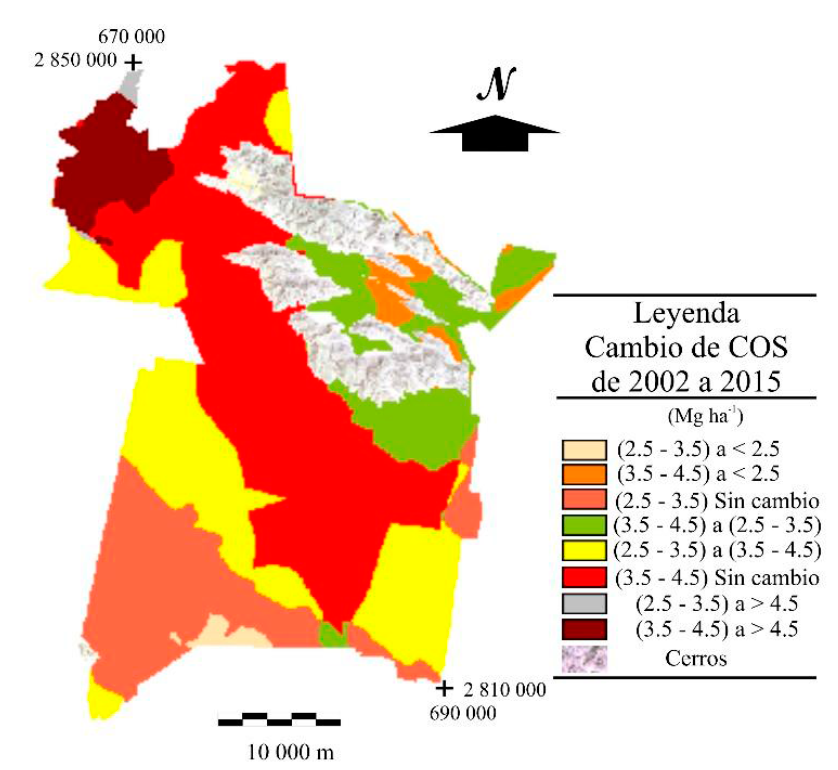
Figure 4 Map of changes in the organic carbon contents of the soil between the years 2002 and 2015, in the municipality of Matamoros, Coahuila.
The magnitude of the changes in surface of the COS classes was different in the whole study area in such a way that, the COS contents in the surface occupied by class 2.5 to 3.5 Mg ha-1 in 2002 decreased by 2015, both negatively and positively; that is, in part of this surface the contents were reduced to <2.5 Mg ha-1, appearing an area of 662.55 ha that in 2002 did not exist (Table 3).
Table 3 Areas of change of the organic carbon contents of 2002 and 2015 in the municipality of Matamoros, Coahuila.
| Class (Mg ha-1) | Map COS 2002 (ha) | Total (ha) | ||
|---|---|---|---|---|
| 2.5 - 3.5 | 3.5 - 4.5 | |||
| Map COS 2015 (ha) | < 2.5 | 662.55 | 3 466.29 | 4 128.84 |
| 2.5 - 3.5 | 12 580.43 | 13 339.95 | 25 920.38 | |
| 3.5 - 4.5 | 15 650.81 | 30 606.74 | 46 257.55 | |
| > 4.5 | 258.56 | 4 233.88 | 4 492.44 | |
| Total (ha) | 29 152.35 | 51 646.86 | 80 799.21 | |
In contrast, part of the surface occupied by class 2.5 to 3.5 Mg ha-1, also contracted because the contents increased, both to the next higher class (3.5 to 4.5 Mg ha-1) and to the >4.5 Mg ha-1 (15 650.81 and 258.56 ha, respectively). Situation that also occurred in class 3.5 - 4.5 Mg ha-1 of the map 2002, although the changes were larger. It gives such form that, in 2015, an area of 4 128.84 ha with COS contents <2.5 Mg ha-1 was detected, which did not exist in 2002, in general the COS increased in the surface layer of the municipality’s soils.
These results are related to what was observed during the field trips for sampling. The agricultural areas were divided into two, areas that corresponded to the common and small property areas. Some small-property soils received manure amendments and others did not. They also had different management when supporting various crops, although the main one was forage maize. On the other hand, the vegetation that was observed in the non-cultivated areas, consisted of scrubland as governor, mesquite and huizache trees, grasses and organs. In this sense, Fortis-Hernández et al. (2009) indicated that the contribution of manure to agricultural land in the Lagunera Region is a common practice in some small properties, reaching up to 120 t ha-1 of manure.
In this regard, the addition of manure increases short-term carbon storage (Lents and Lersch, 2014). However, Flores-Sánchez et al. (2015) indicated that the traditional management of soils causes a minimum accumulation of CO in soils; since tillage can cause the loss of COS reserves (Olson, 2013). Likewise, the arid climate and the vegetation of the region also influence the COS contents in those areas that are not cropland (Montaño et al., 2016).
The previous thing, allows to deduce that the applications of organic amendments would be increasing the reserves of COS in the floors of Matamoros, but at the same time the conventional tillage systems would not allow the accumulation of a greater amount; also, in those places where these organic practices are not carried out, the carbon reserves could be lost quickly due to the effect of tillage and the opening of new areas to the crop.
Conclusions
The highest SOC contents of the surface layer (>4.5 Mg ha-1) of the Matamoros, Coahuila soils were located northeast of the municipality, and were related to manure amendments that apply to agricultural soils of small properties, while that the lower contents (<2.5 Mg ha-1) were located to the south of the municipality, where the agricultural soils did not have applications of organic materials and were common. Likewise, when considering COS base information for the year 2002, it was determined that COS contents for 2015 increased 65 511.88 Mg. Therefore, the determination of the COS content, and the establishment of its spatial distribution, as well as its comparison with data and base maps of existing COS, allow to determine the changes in the COS contents over time. The changes found in this work were positive and negative, due to the effect of climate and vegetation in natural areas, as well as traditional farming and the management of agricultural soils, where some receive organic amendments and others do not. However, even though this could be observed, more research is required in relation to the changes caused by tillage in those places where manure is applied, in order to make this type of management efficient.
Literatura citada
Batjes, N. H. 1999. Management options for reducing CO2 concentrations in the atmosphere by increasing carbon sequestration in the soil. International Soil Reference and Information Centre. Wageningen, The Netherlands. 200 p. [ Links ]
Becerril, P. R.; González, S. E.; Mastachi, L. C. A.; Díaz, D. C. y Ramos, S. N. M. 2014. Contenido de carbono en un ecosistema semiárido del centro de México. Ecosist. Rec. Agropec. 1(1):9-18. [ Links ]
Bui, E.; Henderson, B.; and Viergever, K. 2009. Using knowledge discovery with data mining from the Australian Soil Resource Information System database to inform soil carbon mapping in Australia. Global Biogeochem. Cycles. 23(4):1-15. [ Links ]
Cruz, C. y Paz, F. 2013. Mapa de carbono orgánico de los suelos de la República Mexicana. In: Paz, F.; Bazan, M. y Saynes, V. (Eds.). Dinámica del carbono en el suelo 2012. Serie Avances Temáticos del Ciclo del Carbono y sus Interacciones. Programa mexicano del carbono en colaboración con la Sociedad Mexicana de Ciencias del Suelo. Texcoco, Estado de México, México. 187-191 pp. [ Links ]
Cruz, C. G.; Ortiz, S. C. A.; Ojeda, T. E.; Martínez, M. J. F.; Sotelo, R. E. D. and Licona, V. A. L. 2010. Evaluation of four digital classifiers for automated cartography of local soil classes based on reflectance and elevation in Mexico. Inter. J. Remote Sensing. 31(3): 665-679. [ Links ]
Díaz, H. J. L.; Barahona, F. E. and Linares, G. J. 2003. Organic and inorganic carbon in soils of semiarid regions: a case study from the Guadix-Baza basin (Southeast Spain). Geoderma. 114(1):65-80. [ Links ]
Elbasiouny, H.; Abowaly, M.; Alkheirb, A. A. and Gad, A. A. 2014. Spatial variation of soil carbon and nitrogen pools by using ordinary Kriging method in an area of north Nile Delta, Egypt. Catena. 113:70-78. [ Links ]
Ellert, B. H.; Janzen, H. H.; VandenBygaart, A. J. and Bremer, E. 2006. Measuring change in soil organic carbon storage. In: Carter, M. R. and Gregorich, E. G. (Eds.). Soil Sampling and Methods of Analysis. CRC Press, Boca Raton, FL. 25-38 pp. [ Links ]
FAO. 2002. Food and Agricultural Organization. Captura de carbono en los suelos para un mejor manejo de la tierra. Informes sobre recursos mundiales de suelos. Reporte 96. Roma, Italia. 9-15 pp. [ Links ]
Flores, S. B.; Segura, C. M. A.; Fortis, H. M.; Martínez, C. L.; Aldaco, N. R. A. y Orozco, V. J. A. 2015. Enmiendas de estiércol solarizado en la estabilidad de agregados de un Aridisol cultivado de México. Rev. Mex. Cienc. Agríc. 6(7):1543-1555. [ Links ]
Fortis, H. M.; Leos, R. J. A.; Orona, C. I.; García, H. J. L.; Salazar, S. E.; Preciado, R. P.; Orozco, V. J. A.; Segura, C. M. A. 2009. Uso de estiércol en la Comarca Lagunera. In: Orona, C. I; Salazar, S. E.; Fortis, H. M.; Trejo, E. H. I. and Vázquez, V. C. (Eds.). Libro de agricultura orgánica. FAZ-UJED. Gómez Palacio, Durango. México, 104-127 pp. [ Links ]
García, E. 2004. Modificaciones al sistema de clasificación climática de Köppen. Quinta edición. Instituto de Geografía-Universidad Nacional Autónoma de México (UNAM). México, DF. 98 p. [ Links ]
Heuscher, S. A.; Brandt, C. C. and Philip, M. J. 2005. Using soil physical and chemical properties to estimate bulk density. Soil Sci. Soc. Am. J. 69(1):51-56. [ Links ]
Holland, J. M. 2004. The environmental consequences of adopting conservation tillage in Europe: reviewing the evidence. Agric. Ecosyst. Environ. 103(1):1-25. [ Links ]
IPCC. 2006. Intergovernmental Panel on Climate Change. IPCC Guidelines for National Greenhouse Gas Inventories. Institute for Global Environmental Strategies (IGES) for the IPCC, Kanagawa, Japan. [ Links ]
INEGI. 2016a. Instituto Nacional de Estadística, Geografía e Informática. Sistema de descarga de productos digitales. http://www.beta.inegi.org.mx/temas/mapas/edafologia/. [ Links ]
INEGI. 2016b. Instituto Nacional de Estadística, Geografía e Informática. Sistema de descarga de productos digitales. http://www.beta.inegi.org.mx/temas/mapas/topografico/. [ Links ]
INEGI. 2010. Instituto Nacional de Estadística, Geografía e informática. Conjunto Nacional de Uso de Suelo y Vegetación a escala 1:250,000. Serie IV. DGG-INEGI, México. [ Links ]
Lal, R. 2004. Soil carbon sequestration impactson global climate change and food security. Science. 304(5677):1623-1627. [ Links ]
Landis, J. R. and Koch, G. G. 1977. An application of hierarchical kappa-type statistics in the assessment of majority agreement among multiple observers. Biometrics. 33(2):363-374. [ Links ]
Lentz, R. D. and Lehrsch, G. A. 2014. Manure and fertilizer effects on carbon balance and organic and inorganic carbon losses for an irrigated cornfield. Soil Sci. Soc. Am. J. 78(3):987-1002. [ Links ]
Luo, Y.; Durenkamp, M.; De Nobili, M.; Lin, Q. and Brookes, P. C. 2011. Short term soil priming effects and the mineralisation of biochar following its incorporation to soils of different pH. Soil Biol. Biochem. 43(11):2304-2314. [ Links ]
Montaño, N. M.; Ayala, F.; Bullock, S. H.; Briones, O.; García O., F.; García S., R.; Maya, Y.; Perroni, Y.; Siebe, C.; Tapia T., Y.; Troyo, E. y Yépez, E. 2016. Almacenes y flujos de carbono en ecosistemas áridos y semiáridos de México: síntesis y perspectivas. Terra Latinoam. 34(1):39-59. [ Links ]
Olson, K. R. 2013. Soil organic carbon sequestration, storage, retention and loss in US croplands: issues paper for protocol development. Geoderma . 201-206 pp. [ Links ]
Paz, P. F.; Hidalgo, M. C. y Etchever, B. J. 2012. Análisis y modelación de las energías de dispersión en la distribución del carbono orgánico en los suelos por fracciones físicas. In: Paz, F. y Cuevas, R. (Eds.). Estado actual del conocimiento del ciclo del carbono y sus interacciones en México. Síntesis a 2011. Serie síntesis nacionales. Programa mexicano del carbono en colaboración con la Universidad Autónoma del Estado de México y el Instituto Nacional de Ecología. Texcoco, Estado de México, México. 240-247 pp. [ Links ]
Porta, C. J.; López, A. M. y Poch, C. R. M.; 2014. Introducción a la edafología: uso y protección del suelo. 3ª (Ed.). Mundi- Prensa. México, DF. 607 p. [ Links ]
Segura, C. M. A.; Sánchez, G. P.; Ortiz, S. C. A. y Gutiérrez, C. M. C. 2005. Carbono orgánico de los suelos de México. Terra Latinoam. 23(1):21-28. [ Links ]
SEMARNAT. 2000. Secretaría de Medio Ambiente y Recursos Naturales. Proyecto de Norma Oficial Mexicana PROY-NOM-021-RECNAT-2000, que establece las especificaciones de fertilidad, salinidad y clasificación de suelos. estudios, muestreos y análisis. Órgano del Gobierno Constitucional de los Estados Unidos Mexicanos. Talleres Gráficos de México. México, DF. Tomo DLXV-12: 6-74 pp. [ Links ]
Singh, S. K.; Singh, A. K.; Sharma, B. K. and Tarafdar, J. C. 2007. Carbon stock and organic carbon dynamics in soils of Rajasthan, India. J. Arid Environ. 68(3):408-421. [ Links ]
Steffen, W.; Crutzen, P. J. and McNeill, J. R. 2007. The Anthropocene: are humans now overwhelming the great forces of nature. AMBIO. A. J. Human Environ. 36(8):614-621. [ Links ]
Walkley, A. and Black, C. A. 1934. An examination of the Degtjareff method for determining soil organic matter and a proposed modification of chromic acid titration method. Soil Sci. 37(1):29-38. [ Links ]
Received: April 2018; Accepted: July 2018
 Este es un artículo publicado en acceso abierto bajo una licencia Creative Commons
