


 nueva página del texto (beta)
 Inglés (pdf)
 Artículo en XML
 Referencias del artículo
 Enviar artículo por email
 Citado por SciELO
  Similares en
SciELO
Similares en
SciELO 
 Permalink
1. Introduction
Enzymatic degradation of azo compounds has been recently proposed as an eco-friendly treatment alternative to conventional industrial wastewater treatments. In this sense, horseradish peroxidase (HRP) has been widely used to catalyze the oxidation of several organic compounds (Alemzadeh & Nejati, 2009; Morales Urrea et al., 2018a; 2018b). The use of free enzymes involves high processing costs due to their instability in aqueous media. Also, their reutilization is essential to reduce the process cost. In this sense, several authors report that the immobilization of enzymes increases their stability in aqueous media, and also allows their reusability, favoring the development of economically viable bioprocesses (Wang et al., 2016; Bilal et al., 2018).
One of the main costs associated with the industrial use of immobilized enzymes is the one related to the support. HRP has been effectively immobilized onto several organic (Niu et al., 2013; Xu et al., 2013, 2015; Zhang et al., 2014) and inorganic materials (Chouyyok et al., 2009; Gomez et al., 2006). As a general rule, inert, high surface area, and low-cost materials, such as diatomites, are preferred. Diatomites are sedimentary accumulations of fossilized skeletons of diatoms. These materials provide an inexpensive source of silica with a high surface area (Cabrera et al., 2017). Moreover, the presence of surface silanol groups (-SiOH) turns diatomites into a suitable candidate for the immobilization of enzymes (Inchaurrondo et al., 2016). Diatomites have been used as catalyst support and as an adsorbent in several processes (Caliskan et al., 2011; Deng et al., 2019; Inchaurrondo et al., 2016, 2017). However, the use of diatomites as enzyme support has not been extensively studied (Cabrera et al., 2017, 2018).
As a general rule, enzymatic activity can be affected during the immobilization process and depend on several factors, such as enzyme and support features, and tested immobilization technique (Huang et al., 2008). Typically, silica-based materials have hydrophilic sites on the surface that allow the immobilization of enzymes by adsorption. Additionally, these supports can be chemically modified to promote the covalent bonding of the enzyme, increasing the enzyme loading of the support, and reducing enzyme leaching during the oxidation of the target compound (Zdarta et al., 2018; Zucca & Sanjust, 2014).
Peroxidases can catalyze the oxidation by hydrogen peroxide of a broad range of organic compounds (Veitch, 2004), including phenol (Gomez et al., 2006; Morales Urrea et al., 2018b), pyrogallol (Fernandes et al., 2003), bisphenol A (Morales Urrea et al., 2018b), ABTS (Niu et al., 2013), and the azo-dye Orange II (Morales Urrea et al., 2018a, b; Rache et al., 2014). For this reason, peroxidases are good candidates for the treatment of industrial wastewaters.
Azo-dyes account for about 70% of world dyes manufacturing. Unfortunately, nearly 10% of the production is present in industrial wastewater. Without proper treatment, these wastewaters have deleterious effects on the environment (Córdoba et al., 2012; Rache et al., 2014). Orange II (OII) is a synthetic dye considered a model compound representative of many azo dyes due mainly to the presence of an azo structure (-N=N-). Additionally, it also has two aromatic rings and a sulfonated group (Gil et al., 2011). This dye is widely used in many industries (e.g., textiles, food, and cosmetics) due to the easiness and cost-effectiveness procedure of synthesis and its long term stability under mild conditions (Heydari et al., 2016; Rache et al., 2014). Unfortunately, OII is resistant to many degradation processes such as conventional biologic treatments, light degradation, oxidation with O2 and common acids or bases (Heydari et al., 2016). For this reason, the objectives of the present work were: a) to develop an immobilization procedure of HRP onto diatomites, b) to characterize the developed materials by different techniques (SEM/EDX, XRD, DRIFT, TGA), and c) to study the removal of OII by the developed materials under the absence (adsorption) and the presence (oxidation) of hydrogen peroxide.
2. Materials and methods
2.1. Chemicals and reagents
Natural diatomite was from Minera Comirna SRL (Ingeniero Jacobacci, Río Negro, Argentina). Orange II (OII) sodium salt (CAS Number 633-96-5), (3-Aminopropyl)triethoxysilane (APTES) (CAS Number 919-30-2), glutaraldehyde (GA) solution (CAS Number: 111-30-8), and horseradish peroxidase (HRP) Type I (CAS Number 9003-99-0) were purchased from Sigma Aldrich. The enzyme was supplied as a lyophilized powder. According to the manufacturer, the specific activity was 146 units/mg of the solid powder (one unit corresponds to the amount of enzyme that forms 1 mg of purpurogallin from pyrogallol in 20 sec at pH 6 and 20 °C). All other salts used in this work were reagent grade from Anedra (San Fernando, Argentina).
2.2. Conditioning and chemical modification of diatomites
Natural diatomites were sieved using a U.S. standard sieve #30 to obtain particles with a diameter of less than 0.6 mm. Then, samples were calcined at 550 °C for 4 h to remove all possible organic material, and to increase the mechanical resistance (Inchaurrondo et al., 2016). Calcined diatomites (D) were functionalized and activated according to the method described by Gomez et al. (2006). Briefly, the procedure was as follows:
2.2.1. Silanization
1 g of D and 18 mL of distilled water and 2 mL of APTES (10%v/v) were mixed. The pH was adjusted to 3 with a few drops of HCl (6 N) and then, the mixture was gently stirred for 2 h at 75 °C. Finally, the silanized diatomites (DS) were washed three times with distilled water and dried overnight at 110 °C.
2.2.2. Activation
1 g of DS and 25 mL of a glutaraldehyde solution (2.5%v/v) dissolved in phosphate buffer (100 mM, pH 7) were mixed and gently stirred at room temperature (20 ± 2 °C) for 1 h. Then, the material (diatomites modified with APTES and glutaraldehyde, DSG) was washed three times with the same phosphate buffer.
2.3. HRP immobilization technique
HRP was immobilized onto DSG as follows. 1 g of DSG was mixed with 25 mL of different HRP solutions in 100 mM phosphate buffer pH 7 for 24 h at room temperature (20 ± 2 °C). Tested HRP concentrations ranged between 125 and 1000 mg/L. At predefined intervals, samples were taken to evaluate the remaining protein concentration. Finally, the solids (DSG with chemically bonded HRP, named DSGE) were washed three times with phosphate buffer, vacuum-dried, and stored at 4 °C. Parallel assays were performed to evaluate the contribution of the adsorption of HRP onto calcined diatomites (D). In this case, 1 g of D was mixed with 25 mL of HRP (1000 mg/L, in 100 mM phosphate buffer pH 7) for 24 h at room temperature (20 ± 2 oC). The resulting solids (diatomites with the adsorbed enzyme, named DE) were washed three times with phosphate buffer. Finally, the biocatalyst was vacuum-dried and stored at 4 °C. In all cases, the enzyme loading (Q, mgHRP/g of support) was calculated using eq.1:
Where m (g) is the amount of support mixed with a volume V (L) of enzyme solution, and HRP0 and HRPt are the initial enzyme concentration (mg/L), and the enzyme concentration at a time t, respectively. Enzyme concentration was evaluated by the Bradford method, using bovine serum albumin as the standard (Bradford, 1976).
2.4.1. Scanning electron microscopy (SEM-EDX).
The morphological characterization was performed using a scanning electron microscope (SEM, Carl Zeiss EVO MA10) operated with a voltage of 20 kV. The identification of several elements was achieved by energy dispersive X-ray spectrometry (EDX, Oxford x-act).
2.4.2. BET surface area and pore size distribution
Specific surface area and pore volume of the obtained materials were measured by N2 adsorption/desorption using a surface analyzer ASAP 2020 (Micromeritics). Samples were outgassed overnight at 120 °C. For the BET surface area, the relative pressure range was 0.02 - 0.30 and the assumed N2 molecular cross-sectional area was 0.162 nm2. Pore size distribution and pore volume were calculated from the desorption branch of the nitrogen isotherms using the Barrett-Joyner-Halenda (BJH) method.
2.4.3. X-ray diffraction (XRD)
XRD analysis was carried out using a PANalytical X´Pert PRO PW3040 diffractometer operated at 40 kV and 40 mA, with CuKα radiation (λ = 1.54 Å) at a scanning speed of 0.02° (2θ)/seg. The diffractograms were recorded over 5 < 2θ < 70 angles.
2.4.4. Fourier transform infrared spectroscopy (FTIR)
Infrared spectra were recorded in the range 4000 - 700 cm-1 in a Nicolet 6700 spectrophotometer with 32 scans and a resolution of 4 cm-1.
2.4.5. Thermogravimetric analysis (TGA)
TGA was carried out in a thermal analyser Q500 V20.13 Build 39. The heating rate was 10 °C/min from room temperature to 900 °C under airflow.
2.5. Orange II decolouration assays
The decolouration reaction of orange II (OII) by hydrogen peroxide (P) was used to evaluate the peroxidase activity of the developed materials (Morales Urrea et al., 2018a). In a typical assay, appropriate amounts of D or DSGE were mixed with OII (1 mM) and P (2 mM) stock solutions, both prepared in phosphate buffer (100 mM, pH 9). Decoloration assays were performed under constant stirring at room temperature (20 ± 2 oC). At appropriate intervals, liquid samples were withdrawn from the vials and the UV-vis spectrum was recorded using a spectrophotometer Shimadzu UV-1800. The absorbance value at 485 nm was used to measure the OII concentration of the sample using a molar attenuation coefficient at 485 nm (εOII) of 19.5 ± 0.3 a.u/cm/mM (Morales Urrea et al., 2018a).
To evaluate the adsorption of OII onto D, removal assays were performed without the addition of hydrogen peroxide. In these cases, different amounts of D (5 to 50 mg) were put in contact with 2 mL of phosphate buffer (100 mM, pH 9) and 0.1 mL of OII stock solution (1 or 2 mM) under a constant shaking for 24 hs at room temperature (20 ± 2 oC). Then, the adsorption capacity (qAds, mmol/g) was obtained as follows:
Where V(L) is the liquid volume, m (g) is tested the mass of D, and C0 and Ce (mM) are initial and equilibrium OII concentrations, respectively, and CD (g/L) is the mass of adsorbent per unit volume of the reaction mixture.
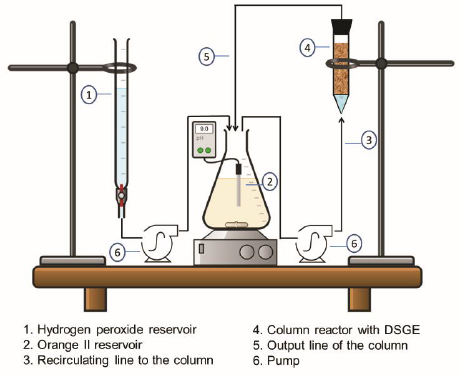
2.6. Removal of OII by HRP immobilized onto diatomites (DSGE) in a fixed-bed reactor
Fixed-bed reactor assays were performed in an up-flow column (15 mm inner diameter and 100 mm bed height) containing 5 g of DSGE. To improve the liquid distribution, a 20 mm bed of glass spheres of 2 mm diameter was included at the bottom of the column. A peristaltic pump (Apema model PC25-1-M6-S) was used to feed the bottom of the column with a solution of OII (0.09 mM) from a 250 mL reservoir. The column outlet was recirculated to the reservoir with a flow rate of 90 mL/h (Fig. 1). In a typical experiment, the OII solution was recirculated to the column under the absence of hydrogen peroxide to evaluate the contribution of the adsorption of OII to the overall removal. At predefined intervals, samples from the column outlet and the reservoir were withdrawn and absorbance at 485 nm was measured to evaluate the OII concentration. When a constant absorbance value was reached, the oxidation step was started by the continuous addition of hydrogen peroxide (2.6 mM) into the reservoir of OII. Hydrogen peroxide was feeding dropwise at a flow rate of 20 mL/h using a Longer Pump (BT100-2J) peristaltic pump. When a removal of OII of more than 95% was achieved, the column was washed with 100 mL of phosphate buffer (100 mM, pH 9) and then, reused under the above-mentioned conditions. During the experiments, the reservoir pH was continuously measured using a polymer body electrode (Broadley-James Corp., USA).
2.6.1. Evaluation of enzyme leaching
The leaching of HRP from the supports was evaluated by the peroxidase activity of the supernatant (Morales Urrea et al., 2018a). Briefly, 1 mL of supernatant and 0.05 mL of OII (1 mM) were poured into a 2 mL spectrophotometric cell. Then, the reaction was started with the addition of 0.05 mL of hydrogen peroxide (2 mM) and the absorbance at 485 nm as a function of time was recorded. All assays were performed at room temperature (20 ± 2 oC). The peroxidase activity of the supernatant (PA, mM/h) was defined as the amount of OII consumed (mmol) per hour (h) per litres (L) under the tested conditions.
3. Results and discussion
3.1. Immobilization of HRP onto calcined (D) and activated (DSG) diatomites
In a first set of experiments, HRP was immobilized onto chemically activated diatomites (DSG) to obtain DSGE. Figure 2 shows that a fast increase in the amount of immobilized HRP (Q) occurred during the first five hours. Then, from 6 to 24 h a gradual increase from 7.0 ± 1.0 to 8.5 ± 0.2 mg HRP/g of support was obtained. Figure 3 shows that for a constant contact time, the enzyme loading of DSGE increased as a function of the initial HRP concentration of the immobilization solution. In this case, a maximum Q value of 8.9 ± 0.4 mgHRP/g of DSGE was obtained after 24 h and using an initial enzyme concentration of 1000 mg/L. For comparison purposes, HRP was also immobilized onto calcined diatomites (D) by adsorption. Because diatomites were not activated by silanization and glutaraldehyde, immobilization of HRP could only occur by adsorption. This material was named DE. In this case, 25 mL of an enzyme solution (1000 mg/L) was put in contact with 1 g of D for 24 h. Under these conditions, the amount of immobilized HRP onto D by adsorption was 5.2 ± 0.1 mg/g of support. This value was about half the one obtained by covalent bonding under the same immobilization condition.
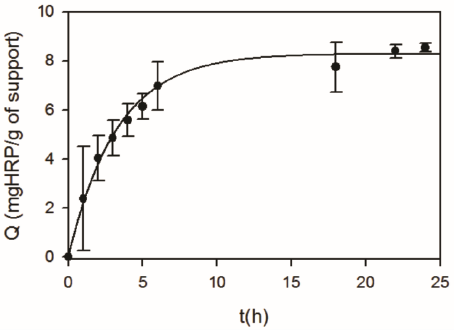
Figure 2 Effect of contact time on the amount of HRP immobilized onto DSG (Q). Immobilization conditions: 1g of DSG in 25 mL of HRP (1000 mg/L), 20 °C, pH 7.
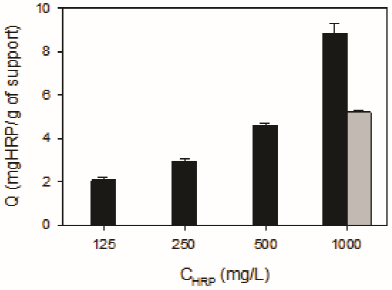
Figure 3 Effect of the HRP concentration of the immobilization solution (CHRP) on the enzyme loading obtained by covalent bonding (DSGE, black bars), or by adsorption (DE, grey bar). Immobilization conditions: 1g of DSG or D in 25 mL of solutions with different concentrations of HRP, 20 °C, pH 7, and a total contact time of 24 h.
Figures 2 and 3 demonstrated that the enzyme load (Q) depended on the immobilization procedure, contact time, and enzyme concentration of the immobilization solution, in accordance with results reported by other authors (Aber et al., 2016; Xu et al., 2013). Enzyme loadings obtained in the present work are within the range reported by other authors. Fernandes et al. (2003) studied the immobilization of HRP onto glutaraldehyde-activated polyaniline polymers, reporting an enzyme loading of 0.5 mg/g. Huang et al. (2009) reported the immobilization of a commercial lipase onto palygorskite modified by silanization with APTES followed by glutaraldehyde. Using this technique, those authors obtained an enzyme loading of 14 mg/g. Wan et al. (2012) reported enzyme loadings ranging from 9 to 14 mg/g for the immobilization of HRP onto SBA-15 mesoporous silica and periodic mesoporous organosilica. Jain et al. (2016) reported enzyme loadings between 5.4 and 8.3 mg/g for the covalent immobilization of HRP onto a mesoporous activated carbon.
3.2.1. Scanning electron microscopy (SEM/EDX)
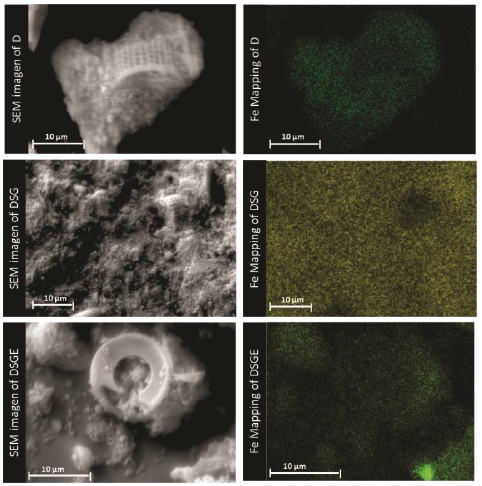
SEM micrographs corresponding to calcined (D) and chemically modified (DSG) diatomites, as well as diatomites with covalent bonded HRP (DSGE), are shown in Figures 4 and 5. As a general rule, diatomites present a porous structure with regular shapes, being their average diameter between 8 and 16 μm (Fig. 4). After the chemical modification and immobilization of the enzyme, the skeletal structure of diatoms was preserved but the formation of little agglomerates onto the surface was also observed (Fig. 5). The formation of agglomerates had also been reported by Gopinath and Sugunan (2007), and Cabrera et al. (2017) during the immobilization of invertase. Moreover, those authors associated these agglomerates with the presence of invertase onto the surface of the studied supports. The mapping of Fe corresponding to calcined (D) and chemically modified diatomite (DSG) shows that this metal is homogeneously dispersed in both samples. However, after the immobilization of HRP by covalent bonding (DSGE), samples showed noticeable green agglomerates due to the presence of Fe from the active site of the immobilized enzyme (Fig. 6).
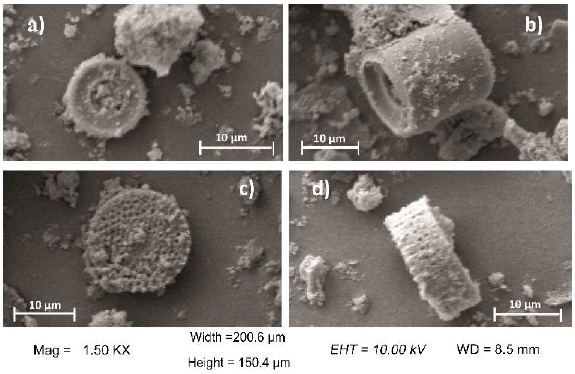
Figure 4 SEM images of the skeletal structure of the studied diatomites: a) Calcined (D), b,c) modified (DSG) diatomites, and d) the system diatomite/HRP (DSGE).
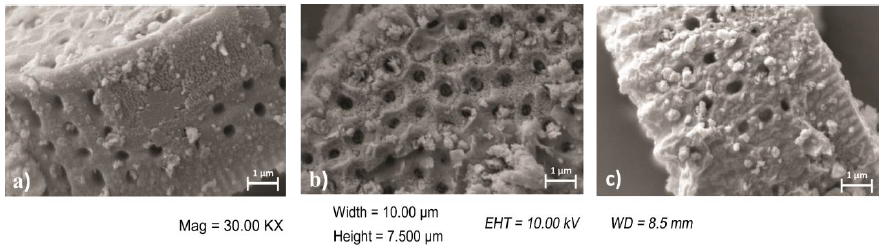
Figure 5 High magnification SEM images of a) calcined (D), and b) modified (DSG) diatomites and c) the system diatomite/HRP (DSGE).
3.2.2. BET surface area and pore size distribution
Figure 7 shows N2 adsorption-desorption isotherms corresponding to D, DE, DSG, and DSGE. According to IUPAC, all isotherms corresponded to Type IV, which are characteristic of mesoporous materials. In all cases, isotherms exhibit a quite visible hysteresis loop due to capillary condensation in mesopores (Alothman, 2012). Insets in Figure 7 show that pore size distribution exhibited a sharp maximum at 4 - 5 nm and then a wide band of pores with size ranged from 5 to 40 nm, typical of mesoporous solids (Thommes et al., 2015).
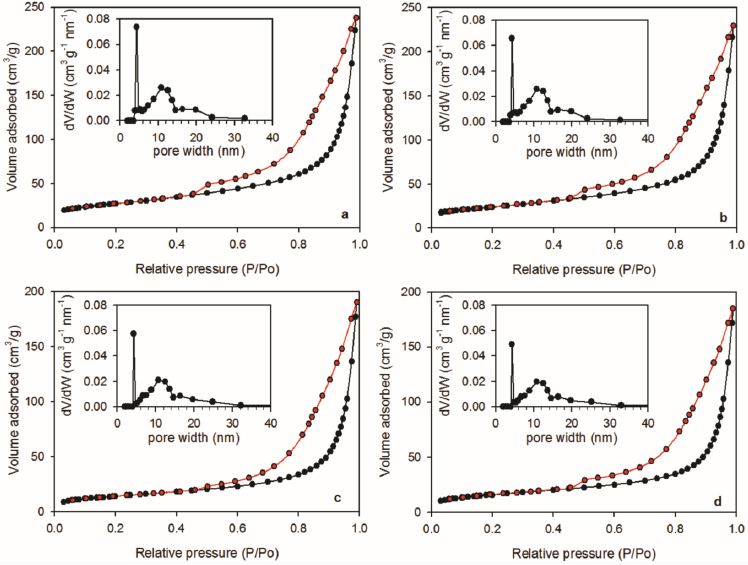
Figure 7 N2 adsorption (black) - desorption (red) isotherms corresponding to a) D, b) DE, c) DSG, d) DSGE. In each case, insets represent the corresponding pore size distribution.
BET surface area, pore volume, and mean pore size corresponding to D, DSG, DE, and DSGE obtained from the N2 adsorption-desorption isotherms are shown in Table 1. There is a broad range of reported values of BET surface area, pore volume, and mean pore size corresponding to diatomites. These differences can be attributed to several factors, such as the extraction site, as well as differences in the conditioning pre-treatments of the samples. For example, in a previous work Inchaurrondo et al. (2016) reported that the BET surface area of diatomites strongly depends on the calcination temperature. In the present work, the used calcination temperature was 550 oC, and the BET surface area corresponding to the calcined diatomites (D) was 95.4 m2/g, in accordance with BET values reported by Inchaurrondo et al. (2016). Table 1 shows that the BET surface area was slightly affected by the adsorption of HRP onto D (sample DE). Conversely, regardless of the presence of the enzyme, when the surface was modified by silanization and glutaraldehyde, BET values corresponding to DSG and DSGE decreased about 45% with respect to sample D. A similar trend was obtained for the pore volume; the chemical modification of D by silanization and glutaraldehyde caused a decrease of the total pore volume from 0.41 (D) to 0.32 cm3/g (DSGE). In this sense, Chouyyok et al. (2009) reported that the BET surface area of different mesoporous silica materials decreased between 18 and 40% due to the presence of HRP immobilized onto the surface of such materials. Gopinath and Sugunan (2007) reported that the modification of montmorillonite with APTES and glutaraldehyde caused a decrease of about 30% of the BET surface area.
Table 1 BET surface area, pore volume, and mean pore size of calcined (D), and modified (DSG) diatomite, and HRP immobilized by adsorption (DE) or by covalent bonding (DSGE).
| Sample | BET area (m2/g) | Pore volume (cm3/g) |
Mean pore size (nm) |
Reference |
|---|---|---|---|---|
| Raw diatomite | 33 | -- | -- | Al-Degs et al. (2001) |
| Raw diatomite | 17.9 | 0.031 | -- | Deng et al. (2019) |
| Raw diatomite | 121 | 0.29 | 4.1 | Inchaurrondo et al. (2016) |
| Calcined diatomite at 500 oC | 108 | -- | -- | Inchaurrondo et al. (2016) |
| Calcined diatomite at 700 oC | 76 | 0.26 | 3.7 | Inchaurrondo et al. (2016) |
| Calcined diatomite at 1000 oC | 5 | 0.015 | 7.0 | Inchaurrondo et al. (2016) |
| Raw diatomite | 54.4 | 0.0156 | -- | Khraisheh et al. (2005) |
| Calcined diatomite at 980 oC | 0.35 | 1x10⁻⁴ | -- | Khraisheh et al. (2005) |
| D | 95.4 ± 0.2 | 0.41 | 9.0 | This work |
| DE | 84.4 ± 0.3 | 0.39 | 9.3 | This work |
| DSG | 50.4 ± 0.2 | 0.33 | 11.0 | This work |
| DSGE | 57.0 ± 0.2 | 0.32 | 9.7 | This work |
3.2.3. X-ray powder diffraction (XRD)
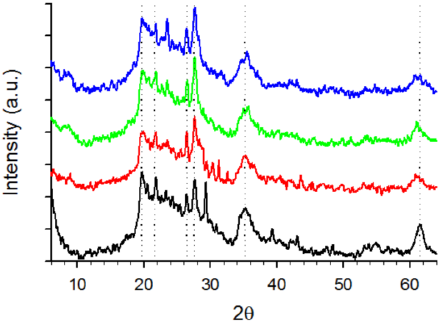
Figure 8 shows XRD patterns corresponding to D, DE, and DSGE. As a general rule, all samples exhibited a wide band between 19 and 30°, usually associated with the presence of amorphous silica (Caliskan et al., 2011; Deng et al., 2019; Zheng et al., 2018). Within this band, four peaks around 19.7°, 21.6°, 26.4°, and 27.6°, and two bands about 35.4°, and 61.4° can also be observed, compatible with the presence of montmorillonite, and albite (Cabrera et al., 2018; Inchaurrondo et al., 2016, 2017). Several authors also reported the presence of quartz in calcined diatomites (Inchaurrondo et al., 2016, 2017; Khraisheh et al., 2005; Šljivić et al., 2009). However, according to Deng et al. (2019), quartz could be an impurity rather than a characteristic of diatomites. Although quartz exhibits two sharp peaks at 20.8°, and 26.6° that are close to those obtained in the tested samples (19.7°, 21.6°, 26.4°), quartz also shows several peaks within the range 35° to 60° that are absent in the experimental data (Fig. 8).
3.2.4. Fourier transform infrared spectroscopy (FTIR)
FTIR spectra corresponding to natural (DN) and calcined (D) diatomite, as well as immobilized biocatalysts (DE, DSGE), and the enzyme alone (HRP) are shown in Figure 9. Natural diatomites exhibit a broad absorption band between 3700 and 3000 cm-1.
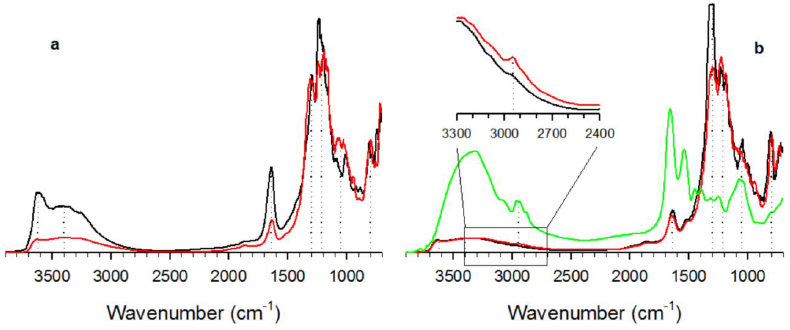
Figure 9 FTIR spectra corresponding to a) raw (black), and calcined (D, red) diatomites, and b) diatomite/HRP systems: DE (black), DSGE (red), and HRP alone (green). Dotted lines indicate the peaks that are present in all samples. Inset in b) represents a detail of DE and DSGE spectra showing the peak at 2930 cm-1 corresponding to HRP alkyl chains.
The peak around 3620 cm-1 is usually associated with the stretching of free surface silanol groups (Caliskan et al., 2011; Cabrera et al., 2017), while the band around 3400 cm-1 and the peak at 1640 cm-1 represent the O-H stretching and bending of the adsorbed water, respectively (Deng et al., 2019). Figure 9a shows that the calcination procedure caused a decrease in the intensity of peaks corresponding to the adsorbed water. The broad band within 1300 to 1200 cm-1 and the peak at 1050 cm-1 correspond to the in-plane siloxane (Si-O-Si) stretching.
Finally, the peak around 800 cm-1 is associated with the symmetric Si-O stretching (Cabrera et al., 2017; Deng et al., 2019).
HRP exhibits a broad band between 3700 and 2700 cm-1 (Fig. 9b). According to Barth (2007), this band represents the stretching vibration of non-hydrogen bonded water (3630 to 3760 cm-1), and bonded OH groups (3600 to 2900 cm-1). Within this band, the peak at 2930 cm-1 represents the alkyl (-CH2-) chains. This peak is also present in spectra corresponding to DE, and DSGE (inset in Fig. 9b), confirming the presence of HRP. The peak at 1660 cm-1 corresponds to the amide I vibration mode, and it arises mainly from the C=O stretching vibration. Finally, the peak at 1540 cm-1 represents the amide II mode, which is the out-of-phase combination of the N-H in-plane bend, and the C-N stretching vibration (Tavares et al., 2020).
3.2.5. Thermogravimetric analysis (TGA)
Figure 10 and Table 2 show the thermogravimetric results corresponding to HRP, D, DE, and DSGE. Within 20 to 120 oC, all diatomite samples show an initial mass loss of 3 to 7% due to the removal of adsorbed water (Mansilla et al., 2018; Zheng et al., 2018). Figure 10a shows that HRP has two phases of mass loss. While the first one is a quite noticeable peak centred at 320 oC with two shoulders at 205 and 270 oC, the second peak is around 510 oC. According to several authors, these peaks are attributed to enzyme decomposition (Chen & Gu, 2008; Mansilla et al., 2018). From 600 to 800 oC no further mass loss was observed. Table 2 shows that at 800 oCthe volatilization of the enzyme was almost complete.
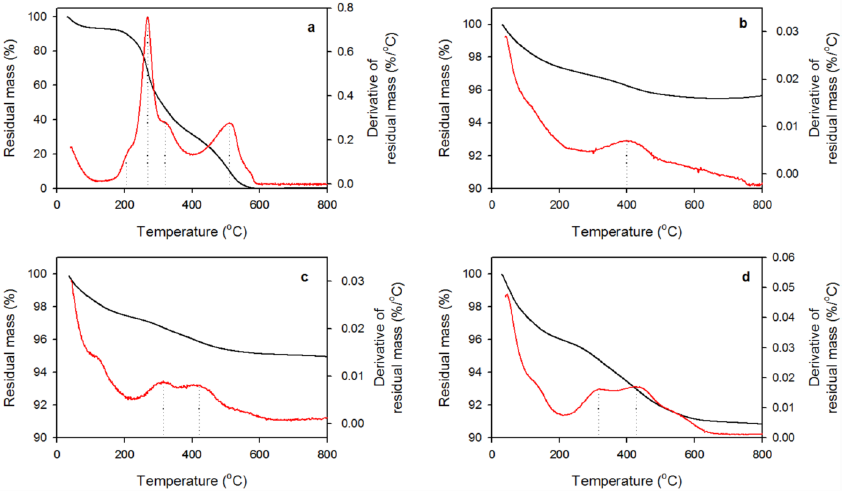
Figure 10 Thermogravimetric analysis (TGA) corresponding to a) HRP, b) D, c) DE, and d) DSGE. Black lines represent the residual mass, red lines are the derivative of the residual mass with respect to temperature.
Table 2 Weight loss and degradation temperatures (Tdeg) obtained from thermogravimetric analysis (TGA) corresponding to HRP, D, DE, and DSGE (Figure 10).
| Sample | Weight loss at 800 °C (%) |
Tdeg (°C) |
|---|---|---|
| HRP | 99.8 | 205, 268, 320, 511 |
| D | 4.5 | 125, 400 |
| DE | 5.0 | 125, 315, 420 |
| DSGE | 9.1 | 127, 315, 428 |
Calcined diatomite (Fig. 10b) exhibits a broad thermal decomposition band centred around 400 °C that represents the dehydroxylation of surface silanol groups (Caliskan et al., 2011; Inchaurrondo et al., 2016). Figure 10c, d shows that this band shifted towards higher temperatures in the case of DE (420 oC), and DSGE (428 oC). In both cases, a new peak at 315 oC due to the volatilization of the enzyme is also evident. Table 2 also shows that weight loss increased as follows: D < DE < DSGE. This result is in accordance with the higher content of organic matter in DSGE (enzyme plus APTES/glutaraldehyde) in comparison with DE (adsorbed enzyme) or D.
3.3. Decolourization of orange II (OII) with hydrogen peroxide catalyzed by DSGE
In a first set of experiments, the removal of OII by DSGE under the absence and the presence of hydrogen peroxide was evaluated in batch assays. Figure 11a shows that the presence of hydrogen peroxide enhances the removal rate of OII by DSGE in comparison with the absence of the oxidant. Considering that calcined diatomites under the presence of peroxide are unable to oxidize OII within the tested conditions, it can be concluded that in the first case, adsorption was the only removal process, while oxidation was the main process under the presence of peroxide. This conclusion is in accordance with the change of the UV/Vis spectrum of the reaction mixture obtained in each case (Fig. 11b). While the final spectrum in the absence of peroxide was similar to the one corresponding to OII, a quite noticeable change of the UV/Vis spectrum was obtained under the presence of hydrogen peroxide. This new spectrum was characterized by the reduction of the absorption band at 485 nm, and the appearance of a new band centred at 340 nm, demonstrating the formation of one or more enzymatic oxidation products (Morales Urrea et al., 2018a).
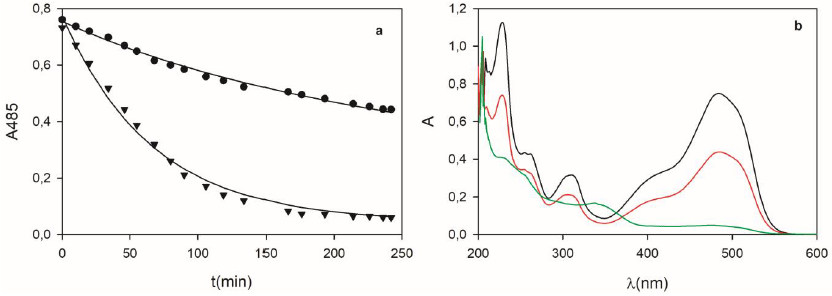
Figure 11 a) Removal of OII (0.04 mM) by DSGE (62 g/L) under the absence (circles) or the presence (triangles) of hydrogen peroxide (0.09 mM). In both cases, lines represent the adsorption-reaction model (Eqs. 9 to 13). b) UV/Vis spectra corresponding to the initial reaction mixture (black), and final spectra under the absence (red), or the presence (green) of hydrogen peroxide.
Under the presence of peroxide, Figure 11 demonstrates that adsorption and oxidation processes contribute to the overall removal of OII. In the example depicted in Figure 11a, adsorption and total initial removal rates were 1.98, and 6.28 a.u./min, respectively. Accordingly, the contribution of the adsorption process on the total removal rate was 31.5%. It is important to note that in many published works, the removal of contaminants by immobilized enzymes is typically reported as a global (or observable) value, without differentiating between enzymatic and adsorption processes, both responsible for the overall removal process.
Figure 12 shows some examples of the effect of the adsorbent concentration (Fig. 12a), the initial dye concentration (Fig. 12b), and the resulting equilibrium adsorption isotherm (Fig. 12c) of OII onto DSGE. Regardless of the tested condition, the equilibrium between adsorbed and aqueous dye was reached after about 17 h. For this reason, to ensure that the equilibrium was reached, all equilibrium adsorption data (Fig. 12c) were obtained after a contact time of 24 h. The analysis of UV/Vis spectra (Fig. A1, left panel in supporting information) revealed that the intensity but not the shape of the obtained spectra changes as a function of time, in accordance with the hypothesis that adsorption was the only removal process under the absence of peroxide.
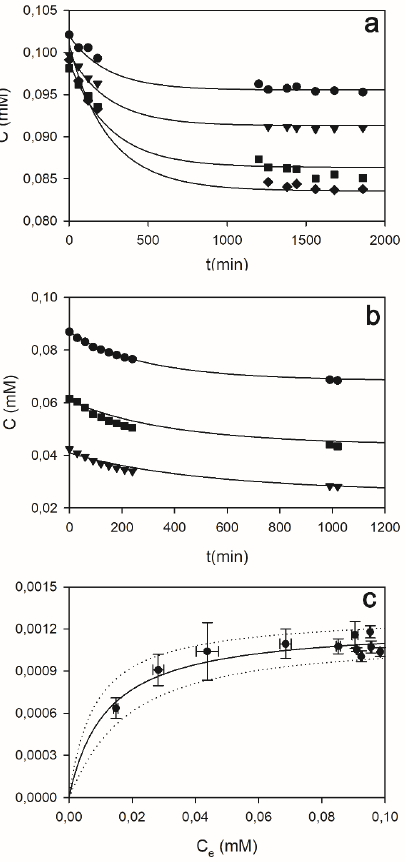
Figure 12 Adsorption kinetics (a, b), and adsorption isotherm (c) of OII onto DSGE. a) Effect of the adsorbent concentration (g/L): 5.8 (circles), 7.9 (triangles), 11.5 (squares), 15.9 (diamonds); in these cases the initial OII concentration was 0.1 mM. b) Effect of the initial dye concentration (in mM): 0.09 (circles), 0.06 (triangles), 0.04 (squares); in these cases, the mass of diatomites was 35 mg.In all cases, continuous lines represent the adsorption model (eq. 5). c) Adsorption capacity (qAds) as a function of the OII equilibrium concentration (Ce). Contact time: 24 hs. All assays were performed in phosphate buffer (100 mM, pH 9) at room temperature. Bars indicate the standard deviation. Lines in a) and b) represent the proposed adsorption model (Eqs. 9 to 13). Line in c) represents the Langmuir equation; dotted lines are ± 2 standard deviations. For details, see the supporting information, Item 1.
Knowing initial and equilibrium OII concentrations (C0, Ce, mM), and the mass of adsorbent per unit volume of the reaction mixture (CD, g/L), the adsorption capacity (qAds, mmol/g) was obtained using eq.2. Figure 12c shows that adsorption capacity (qAds) increased as a function of the OII equilibrium concentration (Ce). These results can be adequately represented by the Langmuir equation:
where qm (mmol/gD) is maximum adsorption capacity, and b (mM) the semisaturation constant. Eq. 3 was fitted to the data show in Figure 11c. Fitting results were as follows: qm = (1.23 ± 0.05)x10-3 mmol/gD, and b = 0.012 ± 0.003 mM.
The OII maximum adsorption capacity obtained in this work was much lower than the corresponding for other dyes. For example, Al-Ghouti et al. (2003, 2005, 2009) performed exhaustive studies concerning the adsorption of methylene blue (MB) onto diatomites. Those authors reported that several factors, such as the initial concentration, particle size, mass of the adsorbent, pH and agitation speed affect the adsorption behaviour of MB. Adsorption capacities of MB reported by those authors ranged from 0.23 to 0.62 mmol/g, which are more than two orders of magnitude higher than the maximum adsorption capacity obtained in this work. Conversely, Inchaurrondo et al. (2016) reported that the adsorption of OII onto calcined diatomites was negligible at pH higher than 3. However, while those authors performed their adsorption assays at 50 oC for 240 min, in the present work adsorption experiments lasted 24 h and were performed at room temperature (20 ± 2 oC).
As a general rule, pH is a key factor that affects the adsorption capacity of adsorbents. In the case of diatomites, surface hydroxyl groups can exchange protons from/to the aqueous phase. If pH is lower than the point of zero charge (PZC) of the adsorbent, surface hydroxyl groups are protonated. Conversely, at pH > PZC, surface hydroxyl moieties lose protons and the surface becomes anionic. Considering that in the present work adsorption assays were performed at pH = 9 and that PZC of diatomites ranged between 6 and 8 (Liang et al., 2010; Inchaurrondo et al., 2016), it can be concluded that under these conditions the diatomite surface was under its anionic form. Besides, OII is a diprotic acid with pKa1 = 1, and pKa2 = 11.4, corresponding to the deprotonation of -SO3H moiety and the -OH from the naphthalene ring, respectively (Oakes & Gratton, 1998). Using these constants, it is easy to demonstrate that at pH = 9 the monovalent anion species of OII represents 99.6% of the total dye in solution (see supporting information, Item 2 and Fig. A2). Accordingly, the low OII adsorption capacity of diatomites obtained in the present work can be explained taking into account that both adsorbate and adsorbent were negatively charged at the tested pH.
The Langmuir equation (eq. 3) represents the equilibrium between OII adsorption and desorption processes. Even though the equilibrium condition was achieved after more than 17 h, Figures 11 and 12 demonstrate that within the first 200 min the amount of adsorbed dye cannot be neglected. Thus, when both adsorption and enzymatic oxidation are responsible for the removal of a given compound, a kinetic approach of the adsorption process is necessary to represent the overall removal kinetics. A simple approach to represent the adsorption kinetics was proposed by Orozco et al. (2010). According to those authors, it can be assumed that the adsorbate contains a given amount of adsorption sites per unit mass (α, mmol/g). Free sites (FS) can be occupied by the adsorbate to give an occupied site (OS). As a counterpart, OS can release the adsorbate. This equilibrium can be represented as follows (Liu & Shen, 2008):
where C represents the adsorbate (e.g., OII), FS and OS are free and occupied adsorption sites, and kads (mM-1 min-1), and kdes (min-1) are second and first-order kinetic constants, respectively.
According to eq.4, rates corresponding to C, FS, and OS are coupled as follows:
Besides, assuming that the total adsorption sites concentration (TS) is proportional to the diatomites concentration (CD, g/L), the balance of adsorption sites is:
where α (mmol/g) is the proportionality constant.
By definition, the adsorption equilibrium is reached when adsorption and desorption rates are equal:
where Ce represents the adsorbate equilibrium concentration. Then, combining eqs.6 and 7, the following expression can be obtained:
The term
To take into account that under the presence of hydrogen peroxide simultaneous adsorption and oxidation of OII occurred, the HRP model developed by Morales Urrea et al. (2018a) was used to represent the enzymatic oxidation of OII by hydrogen peroxide (P). In this case, rates corresponding to FS, and OS are the following:
However, in the presence of peroxide, the observed OII removal rate (RC) is the combination of adsorption and enzymatic oxidation:
Additionally, due to the enzymatic oxidation of OII, an oxidation product (OP) is formed, and hydrogen peroxide is also consumed (Morales Urrea et al., 2018a):
where ROP represents the formation rate of the oxidation product (OP), and RP is the hydrogen peroxide consumption rate. Finally, OII and OP contribute to the absorbance at 485 (e.g., the wavelength at which the OII removal kinetics was measured):
where
Figure 13 shows some examples corresponding to the OII removal kinetics by DSGE. Experiments were performed in two steps. The first one comprised the adsorption of OII onto DSGE due to the absence of hydrogen peroxide. During this phase, a decrease of the absorbance at 485 nm (A485) was observed, reaching constant values after about 17 hs. Then, the addition of hydrogen peroxide started the oxidation phase, producing a noticeable further decrease of A485. The developed model (Eqs. 9 to 13) was used to represent these experiments. For simulation purposes, kinetic coefficients proposed by Morales Urrea et al. (2018a) were assumed (Table 3). Figure 13 shows a very good agreement between experimental data and the proposed model (Eqs. 9 to 13) using the coefficients showed in Table 3. According to the structure of the proposed model, only the expressions
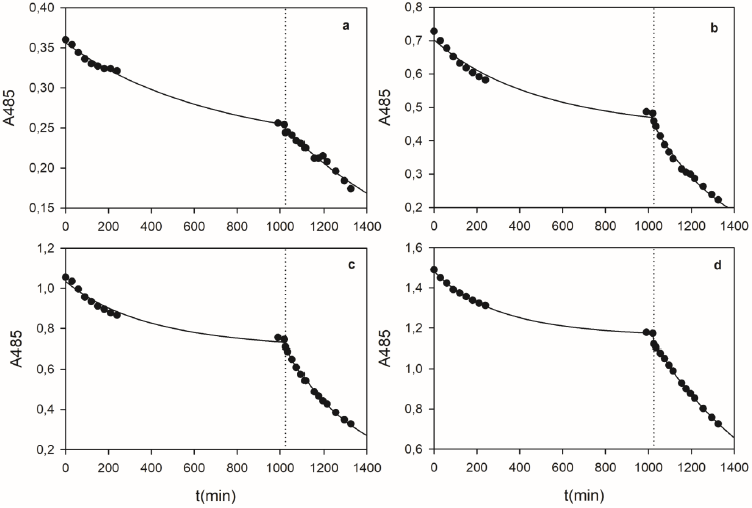
Figure 13 Examples of OII removal kinetics by DSGE. Dotted lines indicate the addition of 0.09 mM of hydrogen peroxide. Continuous lines represent the proposed kinetic model (eqs. 9 to 13). In each case, initial OII (mM), DSGE (g/L), and ET (mg/L) concentrations were: a) 0.018 mM, 12 g/L, 0.06 mg/L; b) 0.036 mM, 18 g/L, 0.15 mg/L; c) 0.054 mM, 19 g/L, 0.18 mg/L; d) 0.072 mM, 16 g/L, 0.10 mg/L.
Table 3 Kinetic coefficients corresponding to the proposed OII removal model by adsorption and enzymatic oxidation * This work; ** Morales Urrea et al. (2018a).
| Coefficient | Value | Units | Process | Reference |
|---|---|---|---|---|
|
|
0.037 ± 0.001 | mM-1 min-1 | Adsorption | * |
|
|
(4.4 ± 1.1) x 10-4 | min-1 | Adsorption | * |
|
|
3.3 x10⁻³ | mmolP mgE−1 min−1 | Oxidation | ** |
|
|
0.033 | L mgE−1 min−1 | Oxidation | ** |
|
|
3 | mM-1 | Oxidation | ** |
|
|
300 | mM-1 | Oxidation | ** |
|
|
0.05 | mM-1 | Oxidation | ** |
3.4. Fixed-bed column assays
A fixed-bed column reactor filled with DSGE was used for the decolourization of OII solutions at room temperature and pH 9. Figure 14 shows the OII removal during 3 consecutive assays. At the beginning of the first experiment (Exp 1), the absorbance decreased slowly due to OII adsorption onto DSGE. After 3 h of operation, OII removal was about 48%. At this time the peroxidase activity of the solution (PA, mM/h) was 72 mM/h, indicating the leaching of HRP from DSGE. At 3.2 hs began the addition of hydrogen peroxide, the oxidation reaction started, and a quite noticeable decrease of A485 was observed. Finally, at 4.5 h a removal of about 93% of OII was achieved. At this time the PA value (44 mM/h) was lower than that measured at the beginning of the oxidation reaction (72 mM/h), suggesting a partial inactivation of the released enzyme.
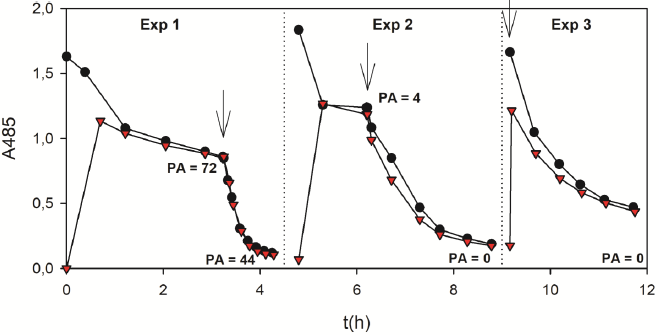
Figure 14 Decolourization of OII solutions (200 mL, 0.09 mM) by DSGE in a fixed-bed column reactor. Black circles and red triangles indicate the absorbance at 485 nm (A485) corresponding to recirculating and output lines, respectively. Arrows indicate the addition of hydrogen peroxide (2.6 mM) at a flow rate of 20 mL/h. PA (mM/h) is the peroxidase activity of the recirculating line. Dotted lines indicate the column washing steps with phosphate buffer (100 mM, pH 9).
At the end of Exp 1, the column was washed with phosphate buffer (100 mM) and reused. Experiment 2 (Exp 2) started at 4.8 hs. During the first hour of operation, the absorbance was almost constant, indicating that the adsorption of OII was negligible due to the saturation of DSGE with the adsorbed OII from Exp 1. Additionally, PA was 4 mM/h, suggesting that the column still leached enzyme, although much less than during Exp 1. The continuous addition of hydrogen peroxide started at 6.2 hs. Accordingly, A485 rapidly decreased, reaching a removal of 89% after 9 hs. It is important to note that PA in solution was not detected at the end of Exp 2, indicating that DSGE stopped leaching HRP. After the second assay, the column was washed again with phosphate buffer. The third experiment (Exp 3) started at 9.2 hs by the continuous addition of hydrogen peroxide. In this case, the OII adsorption stage was not performed because results obtained during Exp 2 indicated that the column was saturated with OII. At the end of the oxidation reaction at 11.7 hs, the A485 removal value was nearly 80%. Besides, PA was not detected, demonstrating that in Exp 3 the column did not leach enzyme. Accordingly, it can be concluded that during Exp 3 the OII oxidation reaction was only catalyzed by the immobilized HRP, but not by the presence of the free enzyme in solution. Finally, it is important to note the gradual increase of the absorbance after each experiment due to the accumulation of oxidation products. Figure 14 demonstrates that DSGE could catalyze the oxidation of OII by hydrogen peroxide in three consecutive assays during 12 hs of continuous use. However, further research is needed to develop adsorption-oxidation models that can represent the removal of OII by DSGE in fixed-bed column reactors.
4. Conclusions
In this work, a horseradish peroxidase (HRP) was immobilized onto calcined diatomites (D) by covalent bonding. The amount of protein immobilized was improved by the surface modification of D by silanization with APTES and glutaraldehyde. SEM/EDX, XRD, DRIFT, and TGA analysis demonstrated that HRP was successfully immobilized onto the surface of chemically modified diatomites.
Batch experiments demonstrate that adsorption and catalytic oxidation in the presence of hydrogen peroxide were both responsible for the overall removal of Orange II (OII). Finally, a fixed-bed column reactor filled with chemically bonded HRP onto diatomites (DSGE) was tested for the removal of OII. DSGE showed a noticeable enzymatic activity and stability, even after three consecutive assays during 12 h of semi-continuous operation. However, more research is needed to develop adsorption-oxidation models that can represent the removal of OII by DSGE in fixed-bed column reactors.
Conflict of interest
The author(s) declare there is no funding information/conflict of interest to declare.

