


Servicios Personalizados
Revista
Articulo
 Inglés (pdf)
 Artículo en XML
 Referencias del artículo
 Enviar artículo por email
Indicadores
-
 Citado por SciELO
 -
 Accesos
Links relacionados
-
 Similares en
SciELO
Similares en
SciELO
Compartir

 Permalink
Revista mexicana de ingeniería química
versión impresa ISSN 1665-2738
Rev. Mex. Ing. Quím vol.11 no.3 Ciudad de México dic. 2012
Fenómenos de transporte
The effect of the ratio between substrate concentration and specific area of the support on the biomass yield of fungal surface cultures
Efecto de la proporción entre la concentración del sustrato y el área específica del soporte sobre el rendimiento de cultivos fúngicos superficiales
E. Ortega-Sánchez1,2, O. Loera2 and G. Viniegra-González2*
1 Universidad Politécnica de Tlaxcala, Departamento de Biotecnología, Av. Universidad Politécnica #1, Col. San Pedro Xalcaltzinco 90180, Tlaxcala, Tlax. México.
2 Universidad Autónoma Metropolitana, Unidad Iztapalapa, Departamento de Biotecnología, Av. San Rafael Atlixco #186, Col. Vicentina 09340, México, D.F. México. *Corresponding author. E-mail: vini@xanum.uam.mx
Received 24 of July 2012
Accepted 10 of September 2012
Abstract
A parameter, σ0 = S0α-1 (gcm2), is defined. Where, S0, (gcm-3) is the initial substrate concentration and α is the specific area of the solid support. This parameter helps comparing the biomass yields, YX/S, of fungical superficial cultures either with a fixed S0 value and variable α or with fixed α and variable S0. A. niger cultures followed the logistic equation with maximal surface density ρAM (gcm-2). Final average thickness, h, was measured by image analysis. The values of h, followed a saturation function of σ0(R2 = 0.965) with extrapolated value hMAX ≈ 0.4 cm. But the volumetric density ρV =ρAMh-1 was nearly constantρV≈ 0.046 ± 0.005 (gcm-3). The regression  = Y0-1 + σ0ε-1 (R2 = 0.95) in the range, 5.9 mgcm-2 < (σ0 < 62.8 mgcm-2 indicated, Y0 = 0.5, as the maximal biomass yield, and ε = ρVhMAX ≈ 0.02 gcm-2, as a measurement of the biosynthetic efficiency. This approach could be useful for the normalization end comparison of screening tests of fungal surface cultures with a variety of solid supports and culture conditions. For example, cultures with different S0 values but, similar yield coefficient YX/S.
Keywords: fungal surface cultures, mass balance, specific area, biomass yield, Aspergillus niger.
Resumen
Se define, σ0 = S0α-1 (gcm2). Do nde, S0,(gcm-3) es la concentración inicial del sustrato y α, (cm-1) es el área específica del soporte sólido. Dicho parámetro ayuda a comparar los rendimientos de la biomasa, YX/S, de cultivos fúngicos superficiales, sea con un nivel fijo S0, y diversos valores de α, o con un valor fijo de α, y diversos valores de S0. Las curvas de crecimiento fueron seguidas por la ecuación logística con una densidad superficial maxima ρAM (gcm-2). Su espesor final, h, se midio por análisis de imagenes que siguieron una función de saturación en σ0(R2 = 0.965) con un valor extrapolado hMAX ≈ 0.4 cm. Pero, la densidad volumeorica, ρV= ρAMh-1 fue casi conatante ρV ≈ 0.046 ± 0.005 (gcm-3). La regresión = Y0-1 + σ0ε-1 (R2 = 0.95) en el intervalo, 5.9 mgcm-2< (σ0 < 62.8 mgcm-2, indicó, Y0 = 0.5, y ε = ρVhMAX ≈ 0.02 gcm-2, ambos como medida de la eficiencia bio-sintética. Este enfoque puede ser útil para normalizar y comparar ensayos de selección de cepas fúngicas en diversos tipos de soportes y condiciones de cultivo. Por ejemplo, diferente a valores de S0, pero similares valores de YX/S.
Palabras clave: cultivos fúngicos superficiales, balance de materia, área específica, rendimiento de la biomasa, Aspergillus niger.
1 Introduction
Fungal surface cultures on agar plates have been used for more than a century as laboratory models of the growth of filamentous fungi, and, could be seen as simplified models of Solid State Fermentations (SSF). For example, without the problems of inter particle diffusion barriers that affect SSF systems. However, cultures of Aspergillus niger grown on packed beds of small Amberlite beads imbibed with sugar broths showed higher biomass yields than similar cultures on agar plates (Favela-Torres et al., 1998) when the comparison was made on terms of the initial substrate concentration. But, an important difference between those systems was the specific area, α (Area/Volume, ratio), of the solid support, with a value α ≈ 2 cm-1 for agar plates and α ≈ 100 cm-1 for small Amberlite beads, estimated from data published by Auria et al. (1990). Furthermore, Rahardjo et al. (2005) found that the yield of a-amylase and total oxygen consumption, per gram of initial substrate, of cultures of A. oryzae grown on round flat cakes of wheat grains, was proportional to the specific area of those cakes. However, to the best of our knowledge, there are no quantitative accounts about the combined effect of substrate concentration and specific area of the solid support on the biomass yield of fungal surface cultures.
Thus, this work is related to the effect of the ratio1 σ0= S0α-1, on biomass yield (YX/S) where S0 (gcm-3) is the bulk substrate concentration, and α (cm-1) is the specific area of the solid support. This definition helps to explore the effects of changing the specific area, α, on YX/Shaving a fixed value of S0, as compared to the effect of changing S0, with a fixed α value. The purpose of this study is to show that σ0 is an important parameter affecting fungal biomass yield. This goal is achieved by showing that surface A. niger cultures follow a linear regression model between the measured values of (g of substrate consumed/g biomass produced) with respect to σ0. Also, the correlation between final superficial biomass production ρAM (gcm-2) and the measured thickness of the fungal layer, h, tries to test whether the estimated volumetric density, calculated as, ρV=ρAM ⋅ h-1, is constant for different values of σ0. Such results would be helpful to define the constraints of A. niger layers with different thicknesses as a result of using different σ0values. All those results seem useful for the rational design of fungal surface cultures that are commonly utilized in mass screening procedures for strain selection.
2 Materials and methods
2.1 Microorganism
The Aspergilus niger strain C28eco3-13 used in this study was previously reported by Tellez-Jurado et al. (2006) and is a laccase transformant derived from a wild strain studied by Antier et al. (1993). It belongs to the UAM (Universidad Autonoma Metropolitana) fungal collection. Such strain was propagated in Potato Dextrose Agar (PDA) at 30° C and the spores were preserved in vials with silica gel. For the present experiments, a few grains of silica gel were spread onto the surface of 25 mL of PDA medium within 9 cm diameter Petri dishes, followed by incubation at 30°C until black spores were formed (usually at 5 days). The resulting spores were harvested by pouring 100 mL of a sterile Tween-80 0.5% (v/v) solution into the dish and gently stirring the agar surface with a magnetic bar for 5 min. The resulting spore suspension was poured into a sterile Erlenmeyer flask. Spore concentrations were measured with a Neubauer chamber.
2.2 Medium composition
The culture medium was similar to one reported by Kafert (1977), but the only carbon source was glucose labeled as S0 (gL-1). The salt composition was proportional to S0 = 100: (gL-1): NaNO3 (15), KCl (5.2), KH2PO4 (8.1), K2HPO4 (10.4), MgSO4⋅7H2O (5.2), FeSO4⋅7H2O (0.052), EDTA (0.5), ZnSO4⋅7H2O (0.22), H3BO3 (0.11), MnCl2⋅4H2O (0.05), CoCl2. 6H2O (0.016), CuSO4⋅5H2O (0.016), (NH4)6 Mo7O2⋅4H2O (0.11). The, C/ N, ratio was maintained at a constant level (16 gC/ gN). The initial pH value of the medium was adjusted to 6.5 and 1.5% agar was used in all experiments.
2.3 Experimental units
The experimental units were 9 cm Petri dishes (A = 63.62 cm2) with different volumes of culture medium (see Table 1). Inoculation was performed with 1 mL containing 105 spores and scattered evenly over the surface (lawn pattern). Dishes were stored in a stove at 30°C for different periods of time.
2.4 Experimental design
The experiments were performed with different values of σ0, obtained in two different ways: a) Changing S0 (gcm-3) = 0.0125, 0.025, 0.050 and 0.100, with a fixed agar volume V = 30 mL (α = 2.12, cm-1) or b) changing V (mL) = 10, 25 and 40, (α = 6.36, 2.54, 1.59, cm-1) with a fixed S0 = 0.100, gcm-3. This experimental design is shown in Table 1 numbering the rows with increasing values of σ0= S0α-1.
2.5 Analysis
The dry weight of the biomass was measured after melting the agar medium. The biomass, together with the agar, was introduced into a baker containing 200 mL of acidified water with HCl (pH 3), which was placed in a microwave oven (Panasonic NV-950B) at level 9 for 2 minutes. The resulting liquid was then filtered through a tared Millipore filter membrane (nominal pore size 0.45 μm), washing through the filter with distilled water and placing it at 60°C until a constant weight was obtained. The total amounts of biomass, X, per agar plate were determined by the dry weight difference, and were expressed as average surface densities ρA (gcm-2). Growth curves were obtained using triplicate values of ρA at eight regular intervals over approximately 96 hours. The experimental values were followed by the logistic equation (1) and the asymptotic values (for t → ∞) were calculated as, ρAM.
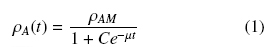
where, C = (ρAM - ρ0)/ ρ0 is an integración constant and the parameters ρAM, ρ0, and μ can be estimated from the least value of the sum of squared residuals between the experimental data and the calculated data points. Calculations were performed with the program Solver (Marquardt algorithm) of an Excel spread sheet.
Residual glucose present in the filtrate was measured by the DNS method (Miller, 1959). The thicknesses, h (cm), of fungal layers were measured at the end of each run (ρA ≈ ρAM). Vertical random sections of such layers were made with a conventional scalpel. Every section was observed under a microscope (OLYMPUS KP-D51/D50) adapted with a camera (OLYMPUSKP-D51/D50). Illumination source was the halogen bulb of the microscope (6V/30W) with intensity 4 in a scale from 0 to 7. Measurements were performed using commercial image analysis software (Image J, USA); the images were displayed as a gray images having 512x512 pixels, the thickness of interest was selected manually and measured with a predetermined software function (analyze and measure). For each experiment, 100 independent measurements were made in three separate Petri dishes.
2.6 Statistical analysis
Analysis of variance and multiple average Tukey's comparison tests were performed, with a level of statistical significance ρ < 0.05. The Minitab 15.0 (Pennsylvania, USA) statistical software was used.
3 Results
Table 1 shows that the average degree of substrate depletion was ƒ = 0.96 ± .04 and the average specific growth rate was, μ = 0.10 ± 0.02 h-1, both without statistical significance ( ρ > 0.05) with respect to changes in σ0. Hence biomass production was measured when practically all the substrate was utilized by the fungal mat and with growth rates comparatively similar in all the experiments. The yield coefficient, YX/S, was calculated from the mass balance (YX/S VƒS0 = AρAM) as follows:
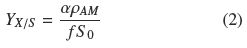
It is worth noticing that all quantities on the second term of Eq. (2) are experimental values measured as indicated above. If ρV = ρAMh-1 is the average volumetric density of the mycelium, h, is the thickness of the mycelium mat and recalling the definition σ0= S0 α-1, the following relationship follows:
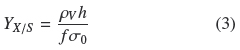
Figure 1 shows the trends of experimental values of, h andρAM, vs. σ0. Both dispersions of experimental data are quite similar to each other. The dispersion of thickness, h, was followed very closely (R2 = 0.965) by the hyperbolic Eq. (4)
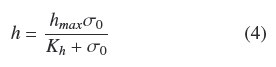
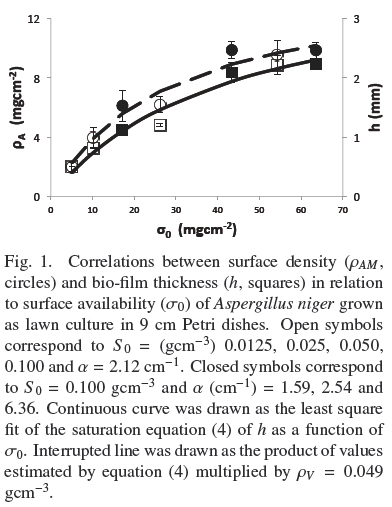
where, hmax = 0.386 cm, is the extrapolated value for very large σ0and Kh = 0.0431 gem-2 is the σ0 value when h = hmax/2. Table 1 shows that the estimated average of quotient ρAMh-2 was ρV = 0.048 ± 0.004 gcm-3 with low correlation with respect to σ0(R2 = 0.046). Also, the dispersion of experimental values of ρAM can be followed by Eq. (4) multiplied by a fixed value of, ρV = 0.049 gem-3 (see Fig. 1). This supports the model where the final value, ρV, is approximately constant for all experiments and the main source of biomass increase, with respect to σ0, is related to the thickness of the fungal mat. The published discrepancies with this model will be discussed in the following section.
Substitution of Eq. (4) into Eq. (3) leads, after some rearrangement and assuming that ƒ≈ 1, to
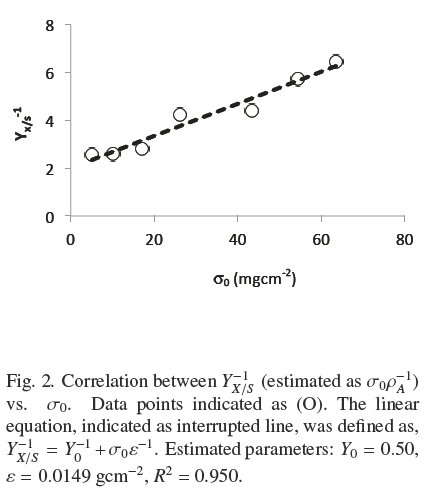
where, the physiological interpretation of parameters, Yu (maximal yield for small σ0) and ε = ρVhmax (maximal biomass surface density for large σ0), are derived in the Appendix A and commented in the Discussion. The calculated values, corresponding to Fig. 2 were, Y0 =0.50; ε = 0.0149gcm-2; R1 = 0.950. Therefore, there is consistency between, the saturation model given by Eq. (4) and the empirical biomass yield equation (5), supporting a simple model where A. niger grows with approximately constant volumetric density,ρρ, having a maximal thickness, hmax. It is worth noticing that the maximal yield Y0 ≈ 0.5 with glucose, is limited by the thermodynamic efficiency of biosynthesis (Heijnen and Roels, 1981).
4 Discussion
As indicated at the Introduction, Rahardjo et al. (2005) studied the effect of changing the value of a of flat rounded cakes made of wheat grains, on the pattern of total oxygen consumption and α-amylase production by R. oligosporus. They found a linear correlation of such variables in the range from α = 1 cm-1 to α = 12.9 cm-1. This is indirect evidence that YX/S is proportional to α, as indicated by the mass balance in equation (2) because R. oligosporus, should hydrolyze starch in order to grow on wheat grains and most of oxygen consumption is also linked to the growth process. Present results show in a more precise way how, α and S0 affect YX/S. This can be done combining eqs. (4) and (5) to become Eq. (6)
From Eq. (6) it can be derived that for very low σ0 (Y0 σ0 « ε), biomass yield will be maximal (YX/S → Y0). But for large σ0(Y0 σ0» ε), biomass yield will be a decreasing function of σ0(YX/S ≈ εσ0-1). Appendix A shows the final mass balance of substrate uptake based on the rates of biosynthesis (μ) and maintenance (m). The combination of such balance with the logistic equation of growth, produces two yield factors, a maximal biomass yield, Y0, and another term proportional to the ratio, m/μ. This ratio seems to be an indication of how much substrate was used by non-productive metabolism. For example, when the ratio, m/μ, is small, the yield coefficient is Y0. This helps to interpret the physiological meaning of e as the productivity of the surface culture that is large when the ratio, m/μ is small. The parameter e has the dimensions of biomass surface density since, according to Appendix A, ε =ρV hMAX, is the maximal biomass production on the surface of the solid support.
Our calculations yielded, ε = 0.033 gem-2 from biomass yield data published by Favela-Torres et al. (1998), obtained on agar plates with a wild strain of A. niger. This result shows that our mutant strain was two times less productive (ε = 0.015 gem-2) when cultured on agar plates than the wild strain studied by them. However, the maximal yield values were quite similar (Y0 ≈ 0.5) for both sets of data. Again, our calculations from previous data (Favela-Torres et al., 1998) obtained in columns packed with small beads of Amberlite, we obtained, ε = 0.009 gem-2. This is a smaller value than the aforementioned values of ε obtained on agar plates. It should be noted that the range of initial substrate concentration, S0, was quite similar in all those experiments (0.01 gem-3 < S0 < 0.45 gem-3) but the values for σ0 of Amberlite columns were quite different because of large difference in the specific area, since the specific area of agar plates is small (α ≈ 100 cm-1) as compared to the large value of Amberlite beads (α ≈ 100 cm-1) with diameter close to 0.06 cm. Such comparisons help to conclude that, a) The maximum yield, Y0, of A. niger, seems to concur with the usual biomass yield of aerobic microbial cultures when using glucose as the main source or carbon (Heijnen and Roels, 1981) and, b). The value of ε depends both on the fungal strain (wild type vs, mutant) and the culture medium (Petri dish vs. Amberlite beads). The importance of such comparison is that yield values should not be compared in terms of bulk substrate concentrations, S0, but on the basis of parameter σ0 = S0 α-1 In other words, to compare the yield of different fungal strains, grown on different kinds of solid supports, it is necessary to normalize such comparisons with similar σ0 values. Otherwise the importance of ε will not be appreciated.
The constancy of the volumetric density, ρV, of Aspergillus niger found in this work is somewhat different to the reports of Nopharatana et al. (2003) and Camacho-Diaz et al. (2010) with surface cultures of Rhizopus oligosporus. They found a decreasing function of volumetric density, ρV, on the thickness, h, in lawn cultures (Nopharatana et al, 2003) or on the radius of circular colonies (Camacho-Díaz et al., 2010). In the present work the variation of ρVwas found to be small for different values of h in the range, 0.05 cm < h < 0.22 cm. One explanation for those differences could be a sharper upper boundary in Aspergillus niger as compared to a loose defined boundary of the fungal mat of Rhizopus oligosporus.
This point requires further analysis. For example, it seems worth looking in future work, at biomass density distributions of different fungal species grown on solid surfaces.
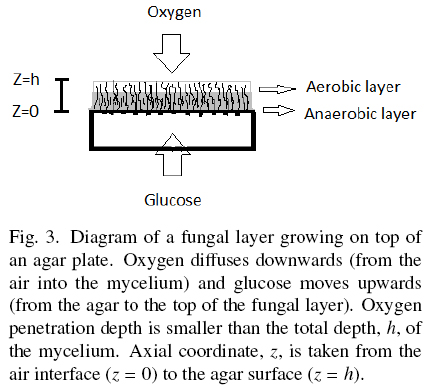
Hill (1929) and Pirt (1966, 1967) proposed the concept of oxygen penetration depth, here labeled as hC, for different kinds of biomass surface cultures. Measurements of hC done by Rahardjo et al. (2002) with microelectrodes inserted in the fungal mat of Aspergillus oryzae, reported hC = 0.0082 cm, and hC = 0.0060 cm for Rhizopus oligosporus, reported by Oostra et al. (2001). Those results indicate that biomass with depth higher than hC is deprived from oxygen. Oxygen limitation of Aspergillus niger was found related to polyol production and reduction of YX/S to values close to 0.25 (Diano et al., 2006). This phenomenon has been studied in solid-state fermentations by Gutierrez-Rojas et al. (1995) and Ruitjer et al. (2004). Also, Olsson and Jennings (1991) described the phenomenon of substrate translocation in fungal cultures. Hence, thick layers of A. niger, seem to be made of an uppermost and thin aerobic layer (h < hC) with YX/S ≈ 0.5 and a deep anaerobic layer (h > hC) with lower YX/S, producing secondary metabolites and trans-locating the excess substrate from the agar plate to the top aerobic layer (Fig. 3). The optimal value σ0= 0.001 gcm-2 can be estimated using Eq. (3) when, ƒ ≈ 1; H ≈ 0.01 cm; YX/S = 0.5, and ρV= 0.05 gcm-3. For example, most recipes for microbial cultures recommend S0 = 0.01 gcm-3, and the corresponding optimal specific area would be α = 10 cm-1. That is, an agar plate of height 0.1 cm (see Appendix B). This means that cultures using thicker agar plates could have a mixture of aerobic and anaerobic metabolism.
Appendix B provides a way to estimate the optimal characteristic length λ for different shapes of solid support, plates (λ = H), cylinders (λ = R) or spheres (λ = R). Such calculations help to choose the geometry and size of particles supporting the growth of thin fungal layers having maximal biomass yield for a given substrate concentration, S0, and physiological conditions (Y0, hC, and ρV values). This result could be important for the design of screening procedures requiring a specific kind of metabolism. In example, the use of very thin agar plates for aerobic metabolism and thick plates for different mixtures of aerobic and anaerobic metabolism. Furthermore, hypertonic syrups (S0 ≈ 0.1 gcm-3), require small solid particles with α values higher than 100 cm-1 in order to maximize biomass yields. For example, spherical particles with diameter smaller than d =0.06 cm. Therefore, the proper selection of σ0 seems to be an important parameter to orient biomass yield (and fungal metabolism) of surface cultures.
Conclusions
Mass balance of surface fungal cultures is a direct way to study how the biomass yield, YX/S, is affected by the combined effect of specific area, α (cm-1), of the support and the bulk initial substrate concentration, S0 (gcm-3), using the composite parameter, σ0= S0α-1. Measurements of the final surface density,ρAM(gcm-2) and the final thickness, h (cm), with changes of S0 or α, independent from each other, led to the conclusion that the estimated volumetric density, ρV= ρAMh-1 was nearly constant for all studied values of σ0 whereas the thickness, h, was hyperbolic on σ0. This supports that fungal mats of Aspergillus niger grow mainly at the expense of the thickness, h, which is bounded to a maximal value, hmax. Linear correlation between and σ0, indicated that fungal surface cultures have a maximal biomass yield, YX/S = Y0 when the parameter, σ0, is very low. This linear correlation has a slope, 1/ε, where, ε is the maximal productivity of the fungal culture. Maximal biomass yield is obtained with fungal layers thinner than the reported oxygen penetration depth (hC ≈ 0.01 cm). Conversely, when σ0is large (large amounts of substrate available per unit area) fungal mats will be thicker than the oxygen penetration depth. That is, thicker than 0.01 cm and according the experimental results of Oostra et al. (2001) and Rahardjo et al. (2002) implying that the cells below oxygen penetration depth will be anoxic. The fact that biomass reaches a maximal density (ρV < 0.05 gcm-3) could be taken as an indication of a constraint between the porosity of the fungal mat, higher than 75%, and the rate of oxygen consumption. Namely, for lower porosities (higher densities), oxygen transfer rate will be lower than oxygen demand. A practical consequence of this analysis is the importance of the combined parameter σ0= S0α-1 affecting the biomass yield, YX/S, in a reproducible way. This parameter seems important for the optimization of strains, under normalized conditions, using fungal surface cultures.
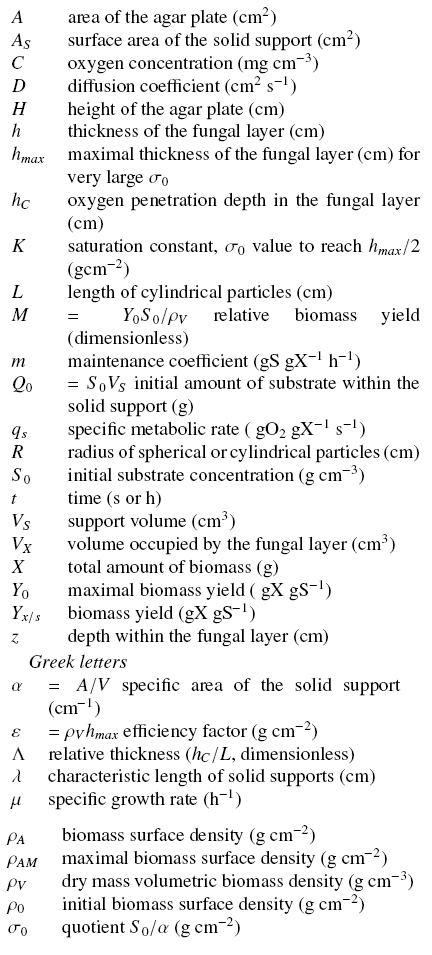
Nomenclature
Acknowledgements
Most of the experimental part of this work was done at and financed by the Universidad Autónoma Metropolitana with the collaboration of Universidad Politécnica de Tlaxcala. One co-author (GVG) was granted a sabbatical leave of absence during 2010 at Instituto de Química da Universidade Federal do Rio de Janeiro (UFRJ, Brazil) and was partially supported by the Consejo Nacional de Ciencia y Tecnología (CONACYT, México) and the Conselho Nacional de Desenvolvimento Científico e Tecnológico (CNPq, Brazil). Criticism and important suggestions are thanked to Professors, Denise Freire (UFRJ), Ernesto Favela-Torres (UAM), Felipe López-Isunza (UAM) and Enrique Galindo-Fentanes (Universidad Nacional Autónoma de México). Eric Ortega-Sánchez thanks to CONACYT for the scholarship granted (Reg. No. 202357).
References
Antier P., Minjares A., Roussos S., Raimbault M., and Viniegra-Gonzalez G. (1993). Pectinase-hyperproducing mutants of Aspergillus niger C28B25 for solid-state fermentation of coffee pulp. Enzyme and Microbial Technology 15, 254-260. [ Links ]
Auria R., Hernandez S., Raimbault M., and Revah S. (1990). Ion exchange resin: a model support for solid growth fermentation of Aspergillus niger. Biotechnology and Bioengineering 6, 391-396. [ Links ]
Camacho-Díaz B.H.C., Aparicio A.J., Chanona-Perez J.J., Calderon-Domínguez G. , Alamilla-Beltran L., Hernandez-Sanchez H. and Gutierrez-Lopez G.F. (2010). Morphological characterization of the growing front of Rhizopus oligosporus in solid media. Journal of Food Engineering 101, 309-317. [ Links ]
Diano A, Bekker-Jensen S, Dynesen J, and Nielsen J. (2006). Polyol synthesis in Aspergillus niger: influence of oxygen availability, carbon and nitrogen sources on the metabolism. Biotechnology and Bioengineering 94, 899-908. [ Links ]
Favela-Torres E., Córdova-López J., García-Rivero M. and Gutiérrez-Rojas M. (1998). Kinetics of growth of Aspergillus niger during submerged, agar surface and solid state fermentations. Process Biochemistry 33, 103-107. [ Links ]
Gutiérrez-Rojas M., Córdova J., Auria R., Revah S. and Favela-Torres E. (1995). Citric acid and polyols production by Aspergillus niger at high glucose concentration in solid-state fermentation of inert support. Biotechnology Letters 17, 219-224. [ Links ]
Heijnen J.J., and Roels J.A. (1981). A macroscopic model describing yield and maintenance relationships in aerobic fermentation processes. Biotechnology and Bioengineering 23, 739-763. [ Links ]
Hill A.V. (1928). The diffusion of oxygen and lactic acid through tissues. Proceedings of the Royal Society of London B 104,39-96. [ Links ]
Kafert E. (1977). Antranilate synthetase enzyme complex and tri-functional TRPC, gene of Aspergillus. Canadian Journal of Genetics and Cytology 19, 723-738. [ Links ]
Miller G.L. (1959). Use of dinitrosalicylic acid reagent for determination of reducing sugar. Analytical Chemistry 31, 426-428. [ Links ]
Nopharatana M., Mitchell D.A. and Howes T. (2003). Use of confocal scanning laser microscopy to measure the concentrations of aerial and penetrative hyphae during growth of Rhizopus oligosporus on a solid surface. Biotechnology and Bioengineering 84, 71-77. [ Links ]
Olsson S. and Jennings D.H. (1991). A glass fiber filter technique for studying nutrient uptake by fungi: the technique used on colonies grown on nutrient gradients of carbon and phosphorus. Experimental Mycology 15, 292-301. [ Links ]
Oostra J., le Comte E.P., van den Heuvel J.C., Tramper J. and Rinzema A. (2001). Intra-particle oxygen diffusion limitation in solid-state fermentation. Biotechnology and Bioengineering 75, 13-24. [ Links ]
Pirt S.J. (1966). A theory of the mode of growth of fungi in the form of pellets in submerged culture. Proceedings of the Royal Society of London B 166, 369-373. [ Links ]
Pirt S.J. (1967). A kinetic study of the mode of growth of surface colonies of bacteria and fungi. Journal of General Microbiology 47, 181-197. [ Links ]
Rahardjo Y.S.P., Weber F.J., le Comte E.P., Tramper J. and Rinzema A. (2002) Contribution of aerial hyphae of Aspergillus oryzae to respiration in a model solid-state fermentation system. Biotechnology and Bioengineering 78, 539-544. [ Links ]
Rahardjo Y.S.P., Jolink F., Haemers S., Tramper J. and Rinzema A. (2005) Significance of bed porosity, bran and specific surface area in solid-state cultivation of Aspergillus oryzae. Biomolecular Engineering 22, 133-139. [ Links ]
Ruijter G.J.G., Visser J. and Rinzema A. (2004). Polyol accumulation by Aspergillus oryzae at low water activity in solid-state fermentation. Microbiology 150, 1095-1101. [ Links ]
Téllez-Jurado A., Arana-Cuenca A., González-Becerra E., Viniegra- González G. and Loera O. (2005). Expression of a heterologous laccase by Aspergillus niger cultured by solid-state and submerged fermentations. Enzyme and Microbial Technology 38, 665-669. [ Links ]
Note
1 The ratio σ0= S0α-1 can be defined as the initial amount of substrate, Q = S0 V, within a solid support with volume, V, divided by the area, A, of the surface culture of the same solid support. This comes from the usual definition α = A/V.

