


Serviços Personalizados
Journal

Artigo
 Inglês (pdf)
 Artigo em XML
 Referências do artigo
 Enviar este artigo por email
Indicadores
 Citado por SciELO
 Links relacionados
-
 Similares em
SciELO
Similares em
SciELO
Compartilhar

 Permalink
Revista mexicana de ingeniería química
versão impressa ISSN 1665-2738
Rev. Mex. Ing. Quím vol.10 no.2 Ciudad de México Ago. 2011
Ingeniería de alimentos
Morphometric characterization of spray–dried microcapsules before and after α–tocopherol extraction
Caracterización morfométrica de microcápsulas secadas por aspersión antes y después de la extracción de α–tocoferol
M.X. Quintanilla–Carvajal1, L.S. Meraz–Torres1, L. Alamilla–Beltrán1, JJ. Chanona–Pérez1, E. Terres–Rojas2, H. Hernández–Sánchez1, A.R. Jiménez–Aparicio3 and G.F. Gutiérrez–López1*
1 Escuela Nacional de Ciencias Biológicas del Instituto Politécnico Nacional. Carpio y Plan de Ayala s/n. Col. Santo Tomás. México, D. F. CP. 11340. *Corresponding author. E–mail: gusfgl@gmail.com
2 Instituto Mexicano del Petróleo, Laboratorio de Microscopia Electrónica de Barrido Ambiental.
3 Centro de Desarrollo de Productos Bióticos del Instituto Politécnico Nacional. Km 35, Yautepec–Morelos, México.
Received 5 of June 2011.
Accepted 14 of June 2011.
Abstract
Microcapsules were obtained by spray–drying o f α–tocopherol (AT) – in – water emulsions subjected to single and double atomization yielding single atomized microcapsules (SAM) and double atomized microcapsules (DAM) which had different core to wall material ratios. Micrographs of whole and AT extracted of SAM and DAM obtained from Environmental Scanning Electron Microscopy (ESEM) were image analyzed and the Feret diameter, projected area, perimeter, maximum perimeter, shape factor and Fractal Dimension of contour (FDc) and texture (FDt) were determined. Whole DAM presented higher FDc and FD t than SAM, while SAM presented higher FDc values for all the microcapsules and higher DFt values for the AT to wall materials ratios 1:4 after the AT extraction. Most of the microcapsules displayed significantly different perimeter but non– significant projected areas, whereas the extracted microcapsules tended not to show significant differences between these two parameters.
Keywords: morphometric parameters, spray drying, image analysis, alpha tocopherol.
Resumen
Se obtuvieron microcápsulas mediante secado por aspersión de emulsiones de α–tocoferol (AT) – en–agua sometidas a atomización simple o doble de las que se obtuvieron microcápsulas de atomización simple (MAS) y microcápsulas de atomización doble (MAD) con diferentes relaciones entre los materiales de pared y el AT a encapsular. Se obtuvieron micrografías de MAS y MAD antes y después de la extracción del AT por Microscopía Electrónica de Barrido Ambiental (MEBA) a las que se les determinó el diámetro de Feret, el área proyectada, el perímetro, el perímetro máximo, el factor de forma, la Dimensión Fractal de contorno (DFc) y la Dimensión Fractal de textura (FDt). Las MAD presentaron mayores valores de DFc y DFt que las MAS, mientras que MAS presentaron mayores valores de DFc para las relaciones de AT a materiales de pared de 1:4 después de la extracción del AT La mayoría de las microcápsulas presentaron valores de perímetros significativamente diferentes, pero no de áreas proyectadas, mientras que las microcápsulas a las que se les extrajo el AT no presentaron diferencias significativas entre estos dos parámetros.
Palabras clave: parámetros morfométricos, secado por aspersión, análisis de imágenes, alfa–tocoferol.
1 Introduction
Microencapsulation techniques offer the possibility of protection and controlled release of active compounds. In this process, small particles are surrounded by a coating or embedded in a homogeneous or heterogeneous matrix to produce small capsules which may have a number of useful characteristics. In food and pharmaceutical applications, spray drying is often the final step of the microencapsulation process inducing the liquid droplets, solid particles or aroma compounds to be entrapped into thin films of food or chemical grade microencapsulating agents (Gharsallaoui et al., 2007; Champagne y Fustier 2007; Pérez–Alonso et al., 2008).
Extensive research aiming to understanding the fundamentals and applications of spray drying in encapsulation processes has been done and the progress in development of modern food materials has been enhanced by the advances in powder technologies and improvement in powder characterization methods (Woo et al., 2010). Nowadays, it is expected to understand powder behavior through physical characterization such as size, shape and surface area and to correlate these properties with encapsulation efficiency (Perea–Flores et al., 2010).
In the case of spray–dried emulsions, the amount of non–encapsulated core material is a key parameter in determining product quality. It has been shown that in fat–containing dairy powders, the surface of individual powder particles is almost completely covered with a thin layer of fat (Kim et al., 2009) which determines the flowability and wettability of these powders (Vega and Roos, 2006). There are different methods for the determination of free or surface lipid materials in spray–dried emulsions which are based on the extraction of different fractions of the non–encapsulated oil (Drusch and Berg, 2008; Lekago and Dunford, 2010). Information about morphology, structure and microstructure of these capsules can be obtained from image analysis through different computer vision systems. It is possible then, to identify the structure–function relationships to understand these complex systems (Aguilera, 2007; Chanona et al., 2008).
Irregular surfaces and textures of different food particles such as coffee, milk, or maltodextrin powders have been characterized successfully through fractal analysis. The key to quantify the irregularity of the contours and surfaces of food materials is the evaluation of their fractal dimension (D) by extracting structural and microstructural features from different images (Perea–Flores et al., 2010; Tapia–Ochoategui et al., 2011). However, the relationships between the nature of the wall materials used in encapsulation processes and the fractal dimension of the resulting capsules have not been reported yet. Gum arabic and maltodextrin are commonly used in encapsulation processes since they are important carriers and coating agents used for the spray drying of flavors and colorants that need to be protected from different oxidative reactions (Pitalua et al., 2010). Also, the microstructure of different kind of emulsions has been described (Murillo–Martinez et al., 2011) but no quantitative descriptors of the properties of the emulsion have been proposed. The objective of this work was to characterize by image analysis, the morphology of capsules of alpha tocopherol using different ratios of wall materials (gum arabic and maltodextrin).
2 Materials and methods
2.1 Materials
(±)α–tocopherol (AT; HPLC grade, Sigma–Aldrich, Toluca, State of Mexico, Mexico) was used as core material. Maltodextrin DE 20 (MD; Complementos Alimenticios, Naucalpan, State of Mexico, Mexico) and gum arabic from Acacia Senegal (GA; Alfred L. Wolf, S.A. de C.V., Mexico City, Mexico) were used as biopolymers.
Chloroform (C), hexane (H), isopropanol (IP) and methanol (M; HPLC grade) were all purchased from Sigma–Aldrich (Toluca, State of Mexico, Mexico). Grade I water was used in all assays.
2.2 Emulsion preparation
MD–GA in different proportions (3:1, 2:1, 1.5:1, 1:1) were dissolved in water and left to stand for 24 h to allow complete hydration. Afterwards, AT was added dropwise, in darkness conditions, to the aqueous biopolymer solutions with help of a Rival homogenizer (model IB901–MIX, Florida, USA) operated at 3000 rpm during 6 min. The emulsions were then added water to bring solids contents to 20% (w/w).
2.3 Spray–drying
A laboratory scale spray–dryer equipped with a 2–fluid atomizing nozzle was employed for drying the emulsions. Inlet temperature of air was 190 + 3 °C, outlet temperature of air was 100 + 3 °C, the flow rate was 1.14L/h, and atomizer air pressure 0.00012 Kg/m2 (Pérez–Alonso et al., 2009; Pulido and Beristain, 2010).
Emulsions were processed in two manners:
a) Spray–dried immediately after manufacture and
b) First cold–sprayed, and then spray–dried, using in all cases the experimental conditions mentioned above.
The single atomized microcapsules were coded as SAM3:2:1, SAM3:2:2, SAM3:1:1, SAM2:2:1, SAM2:1:1, while the double atomized microcapsules were coded as DAM3:2:1, DAM3:2:2, DAM3:1:1, DAM2:2:1, DAM2:1:1, respectively. All microcapsules were put into ziplock bags and covered with Reynold aluminum paper and put into a dessicator until required analysis.
2.4 AT extraction
The surface and inner free AT was extracted from SAM and DAM by adding 10 mL of chloroform to 100 mg of each powder, and stirred with vortex at room temperature for 2 min. The resulting solution was filtered through cotton to retain wall material and washed out with 2 mL of chloroform. The organic phase containing the surface and inner free AT was evaporated to dryness in a Büchi Rotavapor (model R205, Flawil, Switzerland) operated under reduced pressure and 50 °C.
Encapsulated AT was determined by adding 10 mL of water to the cotton containing the filtrate (microcapsules matrices) followed by the addition of 12 mL of chloroform for disrupting the microcapsules matrices. The filtrate was collected in a glass beaker, and added 10 mL of chloroform. This mixture was transferred to a burette and the lower organic phase was separated into a beaker containing 1 g of anhydrous Na2SO4. Finally the organic phase was evaporated to dryness as mentioned before, remaining the encapsulated AT.
2.5 Morphometric analysis
2.5.1. Morphometric parameters
Image processing was carried out according to Pedreschi et al, (2004). Images of the powders of 2048 × 1536 pixels were captured using a digital camera (Nikon Digital Sight DS–2Mv, TV Lens 0.55X, DS, Japan) fitted to a optical microscope (Nikon 50I, USA) and by means of the software NIS–Elements F V2.30. The images of the powders were converted to grey scale (8 bits) maps and then to binary images (black and white) by using the software ImageJ 1.34 (National Institutes of Health, Bethesda, MD, USA). Thresholding was applied to each image by using default settings (95–111). Fill holes tool was then used and the images inverted (Mery and Pedreschi, 2005). The following morphological parameters were determined: Feret diameter, perimeter, maximum perimeter and shape factor. With these results, the particle size distribution could be evaluated.
The area–perimeter relationship was also evaluated: Area–perimeter methods are generally used to estimate the fractal dimension (D) of objects (in this case agglomerates) to evaluate their complexity. This method measures the extent that patch perimeters "fill" the two–dimensional plane. The perimeter–area relationship for a given set of agglomerates is given by:
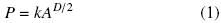
Where the area A is the number of pixels making up a given object, the perimeter P is a count of the number of pixel edges, and k is a scaling constant. The slope of the log–log area–perimeter plot for a set of objects gives an "average" fractal dimension (Burrough, 1986). Agglomerates with perfectly square objects (low perimeter: area ratio) have a fractal dimension D = 1, while those containing highly complex convoluted objects (high perimeter:area ratios) have fractal dimensions approaching 2. The method can be used to determine the relative "edginess" of an image.
For single agglomerates, the perimeter dimension reduces to:
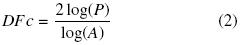
Where DFC is the Contour Fractal Dimension and was obtained adding 1 to the slope of the equation (Barleita and Barbosa–Canovas, 1993; Bellouti et al., Jiménez et al., 2005).
2.5.2 Microstructural analysis of microcapsules
For the structure analysis of the tablets, samples were mounted on cylindrical stubs which were fitted with double coated conductive carbon tape. An environmental scanning electron microscope (FEI Quanta 600, FEI Co., Hillsboro, Oregon., U.S.A.) was used to analyze the surface morphology of the capsules before and after the partial extraction of the extractable tocopherol. Digital images where obtained at 2 magnifications, 500× and 2000×. Images were stored as bit–maps in a gray scale with brightness values between 0 and 255 for each pixel constituting the image. A generalization of the Box Counting method was used to evaluate the fractal dimension of the images. In this work, the shifting differential box–counting method (SDBC) (Chen et al., 2003) was used to evaluate the fractal dimension of texture of ESEM images using the ImageJ 1.34 software. Image segmentation and extraction were also performed using the Image J 1.34 software to evaluate macroscopic structural changes. Image segmentation included cropping, conversion of color image to grey–scale values, and background subtraction to obtain the binary image from the original color image.
2.6 Statistical analysis
All analytical tests and microencapsulation experiments were carried out in duplicate and in randomized order. Results were reported as the mean ± standard deviation. Significant differences among results were determined by analysis of variance (ANOVA) at α = 0.05. All the analyses were performed using MS Excel 2007.
3 Results and discussion
3.1 Morphometric parameters
As stated in Section 2, all the images of DAM and SAM were processed and analyzed to obtain the different morphometric parameters. An example of the binarization process is presented in Fig. 1. Each original image represents the DAM3:2:1 and SAM3:2:1. In this figure, the gray–scale images represent the original emulsion, while the black and white ones are the processed ones according to the conversion carried out from grey scale (8 bits) maps to binary images (black and white).
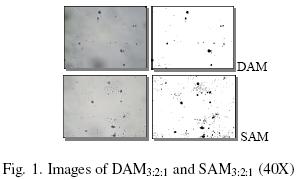
Fig. 2 shows the particle size distribution (in terms of the Feret diameter) of DAM and SAM and their respective distribution of frequencies. Apparently the graphs showed no evidence of a significant difference in particle size distribution between the two processes. To verify this assumption, a oneway ANOVA (α = 0.05) was applied to the various morphometric parameters.
Tables 1 and 2, present the average values of the morphometric parameters obtained from image analysis of DAM and SAM respectively. Results suggested that homogenization influences significantly (p < 0.05) the morphometric characteristics of the powders without showing any specific trend with wall material to tocopherol ratios. Evaluated Feret diameters varied between 2 and 10μm.
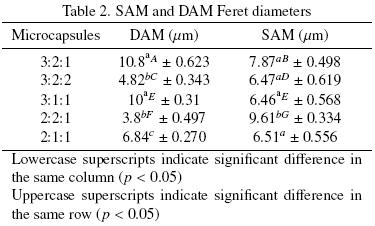
In Table 3, it is possible to observe that for powders having the higher amounts of maltodextrin in the matrix also had higher sizes (evaluated as Feret diameters). Similar findings were reported by Vignolles et al, (2009). On the other hand, Ye et al, (2007) reported that the powder particle size is independent of the size of the original emulsion globule, which coincide with our results. This shrinkage or swelling could be due to a combination of different ratios of wall material and tocopherol as Klaypradit and Huang suggested (2008). They reported a decrease in the size of the capsule when maltodextrin was present in high proportions, results in agreement with those obtained in this work.
Feret diameter, perimeter and maximum perimeter of those powders obtained from emulsions prepared with MD:GA:AT of 3:2:1, 3:2:2 and 3:1:1, presented significant differences when comparing DAM and SAM. However, the projected area for both microcapsules did not show significant differences. These results indicated that microcapsules having different shapes, presented fairly similar areas (different contour) and it is possible to point out that the evaluation of the size of the particles must include morphological indicators of the shape and dimension. The shape factor which describes the irregularity of the objects, in most of the cases, was higher for SAM. The powders that passed twice through the nozzle, presented more irregularity. Values of morphological parameters were significantly different for DAM (p < 0.05) at least in one morphometric parameter.
Surface and inner free AT extraction of DAM and SAM induced morphometric differences between these two materials as compared with the original microcapsules. The particle size distribution changed from monomodal to multimodal (Fig. 3) and in most powders, 3 peaks without any specific trend were evident. To verify this assumption, the various morphometric parameters were statistically analyzed (ANOVA) with α = 0.05.
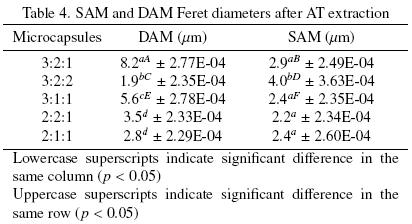
Table 3 shows morphometric parameters for the SAM and DAM materials after AT extraction. In Table 4 the Feret diameter for the same materials after the extraction are presented. These results suggest that the stage of atomization modified the morphometric characteristics of the microcapsules during surface and inner free AT extraction. Although, the particle sizes of the microcapsules varied significantly, DAM, for all cases, showed larger particle sizes. For SAM, particles sizes were significantly lower than for DAM with sizes from 2 to 8 microns (20% decrement).
All morphometric parameters showed significant differences (p < 0.05) for most SAM and DAM. SAM were more irregular than DAM based on obtained values for the shape factor and in general, all microcapsules showed significant differences in at least one morphometric parameter which is a consequence of the process and composition of the capsule.
FDc was significantly (p < 0.05) higher for DAM, as shown in Fig. 4. The FDC value in all cases confirmed the fractal nature of the agglomerates. Note that in this sense, the FDc is a relation between geometric properties (area and perimeter) and provides evidence of how smooth, rough, convoluted, tortuous or sinuous the perimeter of an object is in relation to its area covered. The results demonstrated that FDc is apparently very sensitive to changes in one or other of the above descriptors, which is why each powder had a specific value of FDc. On the other hand, the FDc values for powders without extractable tocopherol presented a significant decrease in this parameter for all cases. This can be explained by the reduction of the area and perimeter of each powder since the extraction of the AT helped to deagglomerate them (Fig. 5). It has been observed that in the case of powders containing lipid phases, their surface is almost completely covered by a thin layer of oil (Kim et al., 2003). It has been established that characteristics such as wettability, fluidity and agglomeration are highly affected by the amount of material that is encapsulated on the surface of the individual particles (Vega and Roos, 2006). Martins and Kieckbusch (2008) highlighted the influence of lipid phases on the agglomeration mechanism of carbohydrate based materials.
3.2 Microstructural analysis of the microcapsules
Significant differences were found in the texture fractal dimension for SAM and DAM, at the two magnifications (500X and 2000X), after and before the removal of the extractable AT and between all the ratios of wall materials. Figure 6 shows all the microcapsules images at each condition with the respective FDt and plot profile. It is important to note that all FDt texture were higher at the 2000X magnification for the powders before the extraction as can be observed in all the images. Smaller values were measured at 500X, where the agglomerations are more evident. Although a specific tendency was not found, in most of the samples the texture fractal dimension was higher for DAM; these differences might be due to size and morphology of agglomerates and the matrix accommodation. Image analysis results provided more information about the relationship between wall materials and microstructure (Perea–Flores et al., 2010).
Conclusions
It was possible to differentiate by using morphometric parameters, capsules obtained by doble and single atomized microcapsules. Double atomized microcapsules had rougher surface texture and more irregular contour than those produced by applying only single atomization process. Moreover, extraction of surface tocopherol decreased, in all cases, the roughness of the particles by possibly exposing cavities previously filled out with tocopherol. Homogenization processes affected quantitative and qualitatively the shape of capsules and the form in which the core material is trapped.
Acknowledgements
Authors wish to thank financial support from CONACYT and SIP–IPN–México. Authors X. Quintanilla and S. Meraz acknowledge study grants from CONACYT–México. Also authors wish to thank Dr. Jaime Vernon for useful contributions towards this work.
References
Aguilera, J.M. (2007). Microstructure and food product engineering. Food Technology 54(11), 56–65. [ Links ]
Barleita, B.J. and Barbosa–Canovas, G. (1993). Fractal analysis to characterize ruggedness changes in tapped agglomerated food powders. Journal of Food Science 58(5), 1030–1046. [ Links ]
Bellouti, M., Alves, M.M., Novais, J.M. and Mota, M. (1997). Flocs vs. granules: differentiation by fractal dimension. Water Research 31(5), 1227–1231. [ Links ]
Burrough, P.A. (1986). Principles of geographical systems for land resources assessment. In: Principles of Geographical Information Systems for land resources assessment. Pp. 193. Clarendon Press, Oxford. [ Links ]
Champagne, P. and Fustier, P. (2007). Microencapsulation for the improved delivery of bioactive compounds into foods. Current Opinion in Biotechnology 18,184–190. [ Links ]
Chanona–Pérez, J., Quevedo, R., Jimenez–Aparicio, A.R., Gumeta–Chávez, C., Mendoza–Pérez, J.A., Calderón–Domínguez, G., Alamilla–Beltrán, L. and Gutierrez–López, G.F. (2008). Image processing methods and fractal analysis for quantitative evaluation of size, shape, structure and microstructure in food materials. In: Food Engineering Integrated Approaches, (G. F. Gutierrez–López, G. V. Barbosa–Cánovas, J. Welti–Chanes, E. Parada–Arias, eds.), Pp. 277–285. Springer. [ Links ]
Chen, W., Yuan, S., Hsiao, H. and Hsieh, C. (2003). Algorithms to estimating fractal dimension of texture images. IEEE International Conference on Acoustics, Speech and Signal Processing 3,1541–1544. [ Links ]
Drusch, S. and Berg, S. (2008). Extractable oil in microcapsules prepared by spray–drying: Localization, determination and impact on oxidative stability. Food Chemistry 109(1),17–24. [ Links ]
Gharsallaoui, A., Roudaut, G., Chambin, O., Voilley, A., and Saurel, R. (2007). Applications of spray–drying in microencapsulation of food ingredients: An overview. Food Research International 40, 1107–1121. [ Links ]
Jiménez, J.C., Salcedo, M.G., Martínez, B.B., Chanona, P.J., Alamilla, B.L., Arenas, O.M., Gutiérrez, L.G. y Jiménez, A.R. 2005. Naturaleza fractal de células en suspensión de Beta vulgaris L., sometidas a un proceso de permeabilización. Biótica 2, 39–53. [ Links ]
Kim, E., Dong, D. and Pearce, D. (2003). On the mechanisms of surface formation and the surface compositions of industrial milk powders. Drying Technology 21, 265–278. [ Links ]
Kim, E.H.–J., Chen, X.D. and Pearce, D. (2009). Surface composition of industrial spray–dried milk powders. 3. Changes in the surface composition during long–term storage. Journal of Food Engineering 94, 182–191 [ Links ]
Klaypradit, W. and Huang, Y. (2008). Fish oil encapsulation with chitosan using ultrasonic atomizer. LWT –Food Science and Technology 41, 1113– 1139. [ Links ]
Lekago, J. and Dunford, N. L. (2010). Effect of Spray Nozzle Design on Fish Oil–Whey Protein Microcapsule Properties. Journal of Food Science 75(6), E94–E97. [ Links ]
Martins, P. and Kieckbusch, T. (2008). Influence of lipid phase on steam jet agglomeration of maltodextrin powders. Powder Technology 185, 258–266. [ Links ]
Mery, D. and Pedreschi, F. (2005) Segmentation of colour food images using a robust algorithm. Journal of Food Engineering 66, 353–360. [ Links ]
Murillo–Martínez, M.M., Pedroza–Islas, R., Lobato–Calleros, C., Martínez–Ferez, A. and Vernon–Carter, E.J. (2011). Designing W1/O/W2 double emulsions stabilized by protein polysaccharide complexes for producing edible films: Rheological, mechanical and water vapour properties. Food Hydrocolloids 25, 577–585. [ Links ]
Pedreschi, F., Mery, D., Mendoza, F. and Aguilera, J.M. (2004). Classification of potato chips using pattern recognition. Journal of Food Science 69, E1–E7. [ Links ]
Perea–Flores, M.J., Chanona–Pérez, J.J., Terres–Rojas, E., Calderon–Dominguez, G., Garibay–Febles, V., Alamilla–Beltran, L. and Gutierrez–Lopez, G.F. (2010) Microstructure structure characterization of milk powders and their relationship with rehydration properties. In: Spray Drying Technology, (M.W. Woo, A.S. Mujumdar y W.R.W Dau, eds.), Pp 197–219. Editorial Transport Processes Research (TPR), Singapore. [ Links ]
Pérez–Alonso, C, Cruz–Olivares, J., Barrera–Pichardo, J., Rodríguez–Huezo, M., Báez–González, J. and Vernon–Carter, E. (2008). DSC thermo–oxidative stability of red chili oleoresin microencapsulated in blended biopolymers matrices. Journal of Food Engineering 85, 613–624. [ Links ]
Pérez–Alonso, C, Fabela–Morón, M.F., Guadarrama–Lezama, A.Y., Barrera–Pichardo, J. F., Alamilla–Beltrán, L. and Rodríguez–Huezo, M.E. 2009. Interrelationship between the structural features and rehydration properties of spray dried manzano chilli sauce microcapsules. Revista Mexicana de Ingeniería Química 8(2),187–196. [ Links ]
Pitalua, E., Jimenez, M., Vernon–Carter, E.J. and Beristain, C.I. (2010). Antioxidative activity of microcapsules with beetroot juice using gum arabic as wall material. Food and Bioproducts Processing 88, 253–258. [ Links ]
Pulido, A. and Beristain, C.I. 2010. Spray dried encapsulation of ascorbic acid using chitosan as wall material. Revista Mexicana de Ingeniería Química 9(2), 189–195. [ Links ]
Tapia–Ochoategui, A.P, Camacho–Díaz, B.H., Perea–Flores, M.J., Ordoñez–Ruiz, I.M., Gutiérrez–López, G.F. and Dávila–Ortiz, G 2011. Morfometric changes during the traditional curing process of vanilla pods (Vanilla planifolia; Orchidaceae) in Mexico. Revista Mexicana de Ingeniería Química 10(1), 105–115. [ Links ]
Vega, C. and Roos, Y.H. (2006). Invited review: spray–dried dairy and dairy–like emulsions compositional. Journal of Dairy Science 89(2), 383–401. [ Links ]
Vignolles, M. L., Lopez, C, Madec, M. N., Ehrhardt, J. J. Méjean, S., Schuck, P. and Jeantet, R. (2009). Fat properties during homogenization, spray–drying, and storage affect the physical properties of dairy powders. Journal of Dairy Science 92, 58–70. [ Links ]
Woo, M.W., Mujumdar, A.S. and Dau, W.R.W. (2010). Spray Drying Technology. Editorial Transport Processes Research (TPR), Singapore. [ Links ]
Ye, X., Fernando, S., Wilson, W. and Singh, A. (2007). Application of amphiphilic catalysts, ultrasonication, and nanoemulsions for biodiesel production process. Chemical Engineering and Technology 30(11), 1481 –1487. [ Links ]

