


 nueva página del texto (beta)
 Inglés (pdf)
 Artículo en XML
 Referencias del artículo
 Enviar artículo por email
 Citado por SciELO
  Similares en
SciELO
Similares en
SciELO 
 Permalink
Introduction
The gut microbiota is a set of microorganisms colonizing the digestive tract. It is a highly complex ecosystem, harboring large bacterial populations in the intestine and colon, with approximately 1011-1012 microorganisms/g of intestinal contents1. Microbes detected in the human intestinal tract can be classified into three domains based on molecular phylogeny: Eukarya, Bacteria, and Archaea. Bacteria are the predominant strains of the gut microbiota. Around 90% of fecal bacteria belong to two major phylogenetic lineages: Firmicutes and Bacteroidetes. However, the gastrointestinal tract of adult humans has been estimated to contain approximately 500 to 1000 different bacterial species2. The number and proportion of particular bacterial species in the intestinal tract are known as microbiota diversity, which is associated with the versatility of metabolic functions3.
The first years of life are a crucial stage for gut microbiota development. Colonization of the digestive tract begins at birth4. Subsequently, infant feeding and weaning are essential for gut microbiota development and further establishment during adulthood. While some groups have claimed that gut microbiota remains relatively stable after infancy5,6, others have demonstrated continued microbial plasticity during childhood and adolescence7-9. However, functional features of microbiota in children/adolescents may change at this stage of life, and gut microbiota may develop more gradually than previously proposed7. Thus, lifestyle changes at this stage still represent an opportunity for modifying microbiota composition.
Recently, changes in the bacterial composition of the human intestine were proposed to play a causal role in obesity10-12. It has been shown that individuals with obesity have less bacterial number and diversity than healthy individuals. In Mexican children with obesity, an increased amount of Bacteroides eggerthii was found, which correlated positively with body fat percentage13. Other studies have shown an increase in Prevotella or Collinsella in Mexican children and adolescents with obesity14,15.
In animal models of diet-induced obesity, reduced gut microbiota diversity and changes in mucosal integrity have been associated with increased permeability, pathogen translocation, and inflammation16,17. Interestingly, some of these modifications are reversible when high-fat intake or the dietary factor causing obesity is discontinued18.
Dietary interventions in adults and children generate modifications in the composition and diversity of gut microbiota19-21. Moreover, physical activation induces an increased number of short-chain fatty acid-producing species22, contributing to a healthy state23. Regardless of diet, exercise promotes intestinal balance and improvement in gut microbiota composition, with consequent favorable metabolic changes in children24. Childhood obesity interventions have been shown to affect weight loss when lifestyle changes are achieved25. The most effective multidimensional interventions promote changes in food consumption patterns, physical activation, and behavior26,27. At the Hospital Infantil de México Federico Gómez (HIMFG), the Pediatric Obesity Clinic has been designed to promote nutritional and physical activity behavioral modifications. No previous publication has reported whether the gut microbiota composition of Mexican children with obesity changes after a multidimensional intervention. The present pilot study aimed to evaluate modifications in the gut microbiota composition of Mexican children with obesity driven by a 6-week multifaceted intervention.
Methods
Study design
We conducted a short-term, quasi-experimental, longitudinal pilot study to compare the microbiota composition of obese children before and after 6 weeks of dietary and physical activity measures.
Participants
Children were selected from the Dynamic Child Care for Obesity and Overweight Program (PAIDOS, for its Spanish acronym) of the Pediatric Obesity Clinic, Hospital Infantil de México Federico Gómez (HIMFG). The study was approved by the Ethics Committee (HIM/2019/010), and parents and participants provided written informed consent and assent, respectively.
As inclusion criteria, we considered those participants living in the Mexico City area and following a 6-week diet and physical activity intervention (short-term), with no neurological or psychomotor disorders or obesity-causing diseases. Patients with diarrhea or antibiotic exposure 3 months before the study were excluded. Although we initially recruited 20 children with obesity, only nine patients donated both (pre- and post-intervention) self-collected stool samples. Three of these nine patients were excluded due to antibiotics intake during the intervention. Therefore, only six male children with obesity (aged 11-14 years) participated in this study. In addition, fasting blood samples (pre- and post-intervention) were collected for biochemical analyses and anthropometric measurements.
Anthropometric parameters
Anthropometric measurements included weight, height, and waist circumference. Body fat mass percentage was obtained by bioelectrical impedance analysis (TANITA, BF-689). Obesity status was defined as a zBMI score > 1.6428,29 or as a body fat percentage > 32 for males30.
Blood sampling and biochemical analyses
Blood samples were drawn after 12 h fasting, and serum was separated using gel separation tubes. Serum levels of glucose, total cholesterol, HDL cholesterol (HDL-C), LDL cholesterol (LDL-C), triglycerides, alanine aminotransferase (ALT), and aspartate aminotransferase (AST) were quantified with commercially available standardized methods (Dimension RXL Max, ®).
Multidimensional intervention: diet, nutrition education, and physical activity intervention
Patients visited the Pediatric Obesity Clinic weekly for six weeks. In the first session, medical history, as well as anthropometric and dietary information, was obtained. In addition, participants received a hypo energetic dietary plan (60% energy from carbohydrates, 20-25% from fats, and 15-20% from proteins) and instructions according to their age, gender, and a moderate to intense physical activity plan. In subsequent sessions, anthropometric measurements were conducted. Patients also received nutritional education and physical activation recommendations to achieve at least 150 min/week. The objectives of nutritional education were to increase fruit and vegetable consumption, replace refined carbohydrates with whole grains, and limit the consumption of sugar added to processed food and sugar-sweetened beverages. After six weeks, anthropometric and biochemical data were again determined for comparison (pre- and post-intervention data).
Stool sampling and DNA extraction
Pre- and post-intervention fecal samples were self-collected at home in a sterile cup and refrigerated overnight before storage at −80°C until processing. DNA was extracted from 200 mg of feces using the QIAamp® DNA Stool Mini Kit (Qiagen, Inc.). DNA concentration was determined spectrophotometrically.
Sequencing of 16S rRNA
Characterization of the gut microbiome was performed by sequencing the V4 hypervariable region of the 16S rRNA, using primers 515F and 806R, as suggested by the Earth Microbiome Project and as previously described13. Briefly, PCR was performed on 100 ng DNA. Products were purified using Agencourt AMPure XP beads (Beckman Coulter) with an automated protocol in the Agilent Bravo Automated Liquid Handling Platform (Agilent Technologies). Equimolar ratios of amplicons from the individual samples were pooled and sequenced using an Illumina MiSeq 2 × 250 platform. The size and concentration of each sequencing pool were determined by an Agilent D1000 ScreenTape for TapeStation 4200 system (Agilent Technologies) and a Qubit 2.0 fluorometer (Invitrogen), respectively.
Data processing and statistical analysis
Sequences were analyzed using QIIME 1.9.0. Quality filters removed sequences containing mismatched barcodes, ambiguous bases, or low-quality reads (Phred quality score < 30). After trimming barcodes, demultiplexing was performed. Operational taxonomic unit (OTU) read counts were obtained with a closed-reference OTU selection algorithm at 97% identity against the Greengenes database (version 13_08). Potential chimeras were detected with USearch61 and excluded from further analysis. Taxonomic classification was performed to generate phylum to genus level composition matrices. Alpha and beta diversity statistics were calculated with QIIME31.
Statistical analysis was performed with R and SPSS. Data normality was assessed with Kolmogorov-Smirnov test. Data are shown as median and interquartile ranges for continuous variables or percentages for categorical variables. Paired Wilcoxon tests assessed differences in metabolic traits pre-and post-intervention. Ordination was performed by principal coordinates analysis (PCoA) on weighted and unweighted Unifrac dissimilarities for gut microbiota composition. Rarefaction curves were calculated by QIIME, with subsampling in the range of 10-58,000 sequences, with one step of 1,000 sequences and ten re-samplings on each step. Values were obtained for the Shannon diversity index, observed OTUs, and Chao1 richness estimation at a standardized sequencing depth. Differences in bacterial community composition were evaluated by PERMANOVA using Unifrac distances. For taxonomic characterization, OTUs whose mean abundance in all samples was < 0.01% were excluded. The paired Wilcoxon test evaluated alpha diversity and taxonomic differences pre-and post-intervention. Spearman correlations tests were performed to relate taxa abundances to changes in metabolic traits (delta waist circumference: T6–T0). Statistical significance was considered when p < 0.05.
Results
Anthropometric and biochemical parameters
Only nine of the 20 children initially recruited provided pre- and post-intervention stool samples. Three of these nine patients were excluded due to antibiotic use. Therefore, six male participants met the inclusion criteria, completed the program, and provided pre- and post-intervention samples. Most anthropometric and biochemical characteristics did not change after the intervention (Table 1). However, waist circumference was significantly reduced after the intervention (98.05 ± 11.2 cm pre- vs. 94.95 ± 7.82 cm post-intervention, p = 0.031).
Table 1 Clinical and biochemical variables of the studied population
| Variables | Median | IQR | |||
|---|---|---|---|---|---|
| Age (y) | 12.915 | 2 | |||
| Height (m) | 1.602 | 0.13725 | |||
| Pre-intervention | Post-intervention | p- value | |||
| Median | IQR | Median | IQR | ||
| Waist circumference (cm) | 98.05 | 11.20 | 94.95 | 7.82 | 0.03* |
| Weight | 71.80 | 17.05 | 71.85 | 14.52 | 0.84 |
| BMI Z-score | 1.87 | 0.22 | 1.87 | 0.22 | 0.59 |
| Body fat (%) | 32.95 | 4.17 | 30 | 3.90 | 0.09 |
| Glucose (mg/dL) | 87 | 5.25 | 91.50 | 12.75 | 0.28 |
| Total cholesterol (mg/dL) | 150.50 | 47.25 | 155.50 | 26.25 | 1 |
| HDL-C (mg/dL) | 39.50 | 6.75 | 37 | 5 | 0.36 |
| LDL-C (mg/dL) | 85.20 | 41.35 | 91.50 | 6.30 | 0.59 |
| TG(mg/dL) | 94.50 | 85.50 | 122 | 109.50 | 0.79 |
| ALT (mg/dL) | 36 | 11.50 | 35 | 10.50 | 0.17 |
| AST (mg/dL) | 22 | 4.25 | 26.50 | 3.25 | 0.89 |
All participants were male (n = 6). Data are expressed as medians, IQR, Wilcoxon paired test,
*p < 0.05.
ALT: alanine aminotransferase; AST: aspartate aminotransferase;
BMI Z-score: body mass index Z-score; HDL-C: high-density lipoprotein cholesterol; IQR: interquartile range; LDL-C: low-density lipoprotein cholesterol;
TG: triglycerides.
Gut microbiota richness and diversity
Fecal DNA sequencing resulted in a mean number of sequences per sample of 87,602 (range 58,363–115,770). Observed OTUs, Chao estimate of richness, and Shannon index showed no significant differences pre-post-intervention (Figure 1). Moreover, in the PCoA of unweighted and weighted Unifrac distances, samples were not clustered pre- or post-intervention (Figures 1D and E). PERMANOVA analyses of distance matrices showed no significant effect of the intervention on overall community composition. In contrast, individuals showed a statistically significant proportion of gut microbial variation (unweighted, R2 = 0.52, p = 9.9 x 10⁻³ and weighted, R2 = 0.70, p = 0.020), suggesting that the gut bacterial composition of children with obesity was given by individual divergence, but not by diet or physical activation during the time of the intervention.
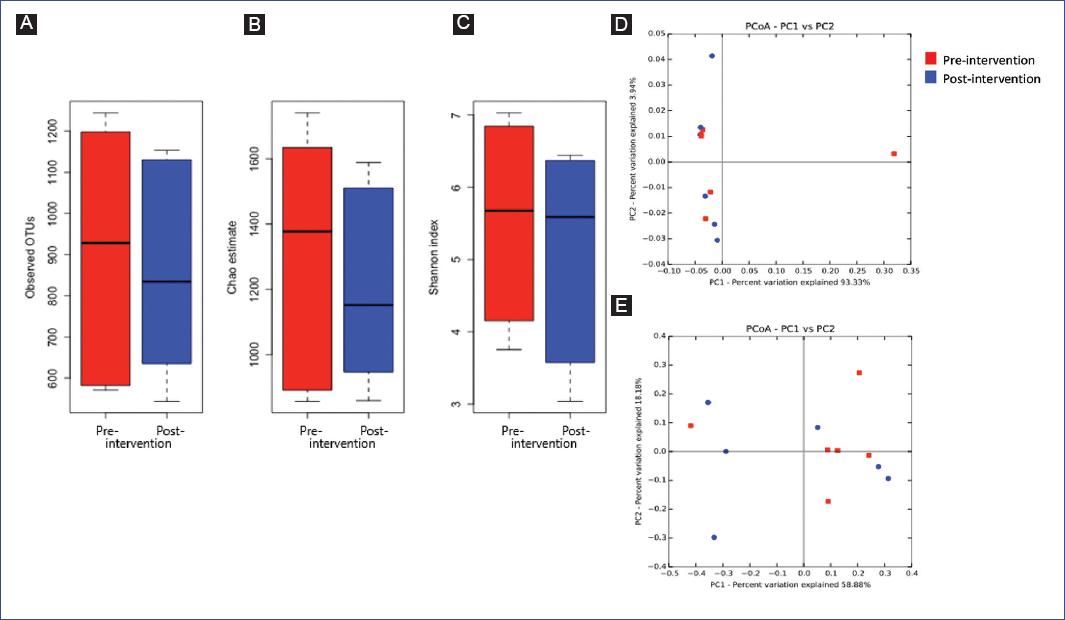
Figure 1 Alpha and beta diversity plots pre-and post-intervention. A: observed OTUs, B: Chao estimate, and C. Shannon index pre- and post-intervention in children with obesity. D-E: principal coordinates analysis of samples pre- and post-intervention based on D. unweighted Unifrac distance and E. weighted Unifrac distance (n = 6). Paired Wilcoxon tests evaluated differences in alpha diversity indexes pre-and post-intervention.
Phylum and family distribution
We next evaluated the composition of the gut microbiota at the phylum level. The most abundant phylum in children before the intervention was Bacteroidetes (median relative abundance = 46.5%), followed by Firmicutes (median relative abundance = 45.7%), and Proteobacteria (median relative abundance = 3.7%) (Figure 2A), and no significant modifications in this abundance were observed after the intervention. No significant differences were found at the family or genus level (Figure 2B) (Supplementary table 1). These results indicate that this multidimensional intervention showed no consistent effect on the gut microbial composition of individuals.
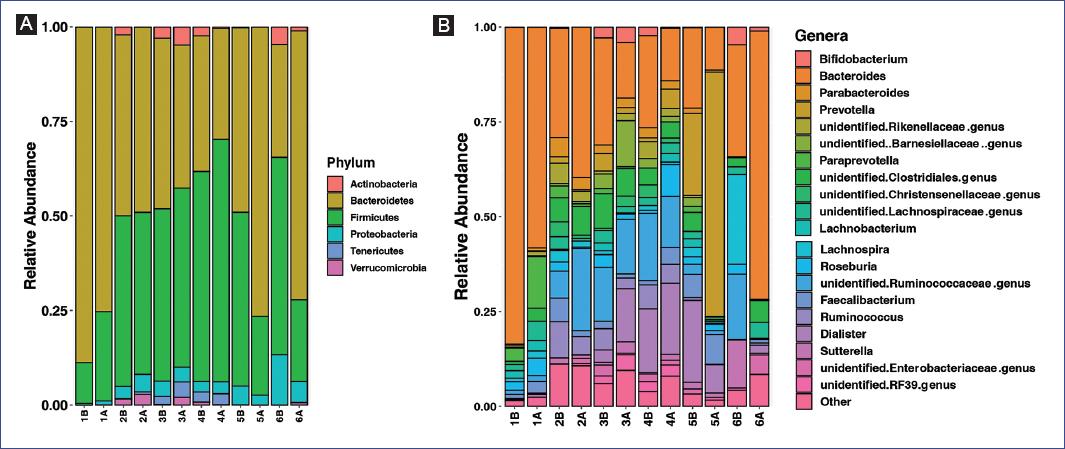
Figure 2 Taxonomic classification of fecal samples pre-and post-intervention. A: stacked bar chart of the phylum-level classification of intestinal bacteria by relative abundance. B: stacked bar chart of the genera whose mean relative abundance was >1%; genera below these levels were collapsed in Other. Bars represent individual samples (n = 6). Paired Wilcoxon tests evaluated differences in taxa relative abundance pre-and post-intervention. B: before; A: after.
Correlation between anthropometric data and taxonomic abundance modifications
Spearman correlations were performed to test whether gut microbiota changes post-intervention were related to the observed changes in waist circumference. At the genus level, Odoribacter abundance showed a negative and significant correlation with the change in waist circumference (delta waist circumference T6-T0) (Figure 3): the quantity of Odoribacter increased significantly in those with a more substantial reduction in waist circumference (r = -0.94, p = 0.0167). Correlation tests between changes in waist circumference and taxa abundance are shown in Supplementary table 2.
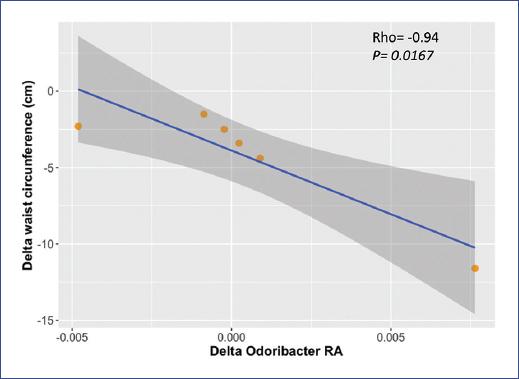
Figure 3 Correlation between changes in waist circumference and Odoribacter relative abundance after a multidimensional intervention in children with obesity (n = 6); rho and p-value are based on Spearman’s rank correlation. Delta waist circumference was calculated as time at 6 weeks minus time at the beginning of intervention (T6 - T0)
Discussion
Comprehensive treatment with lifestyle modifications that lead to weight loss is essential to reduce the high rates of childhood obesity. Lifestyle modifications that include diet, behavioral treatment, and physical activity (i.e., multidimensional interventions) have been extensively studied due to their effects on weight loss, BMI reduction, and adiposity indicators32. In addition, improvements in weight loss, diastolic/systolic blood pressure, oxidative status, and some biochemical parameters associated with metabolic syndrome are frequently observed33. However, inconsistent results have been found for serum glucose and lipid concentrations34,35. These differences generally depend on the type of dietary treatments, distribution of nutrients, and the timing of the interventions (short- versus long-term).
Six subjects who met the inclusion criteria were recruited for this pilot study. The intervention lasted six weeks, during which the participants received a hypo energetic and individualized dietary plan without modifying the standard macronutrient distribution. In addition, patients received nutritional education and physical activation recommendations to achieve at least 150 min/week.
Regarding adiposity, we observed that the intervention reduced waist circumference without modifying BMI or body fat. These results were unexpected, as BMI and body fat are adiposity indicators. It is possible that 6 weeks of multidimensional intervention produced initial modifications in waist circumference, which correlates with the amount of visceral fat36. Still, it was not long enough to modify other anthropometric measurements further. A review study showed that long-term interventions in Mexican children based in Mexico or the United States changed adiposity markers when nutrition and physical activity were modified37. A 12-week physical activity intervention in Mexican children did not modify BMI but decreased biochemical parameters such as blood glucose and cholesterol concentrations38. Therefore, a long-term multidimensional intervention that includes a more significant number of children could better impact the Mexican population in the future.
Few dietary interventions have demonstrated a beneficial influence on the composition of the gut microbiota of children with obesity16,39,40. The effects of a multidimensional intervention (diet, nutritional education, and physical activity) on the gut microbiota of Mexican children with obesity have not been investigated in depth. The present pilot study found that gut microbiota composition and diversity were not modified after this intervention. This result was unexpected, as we hypothesized that the multidimensional intervention would change gut microbiota composition. However, this pilot study was designed to describe our findings during an initial approach with patients, which is valuable for our following contributions with larger sample sizes.
Although no modifications were found in the overall composition of the microbiota, an interesting finding was that the relative abundance of Odoribacter was correlated with the change in waist circumference: as waist circumference decreased, Odoribacter abundance increased. Previous studies in children and adolescents have associated Odoribacter with adiposity. Odoribacter was inversely correlated with visceral and subcutaneous adipose tissue and intrahepatic lipid deposition41. Moreover, Odoribacter abundance has also been related to metabolic health. Obese and overweight children and adults were classified into metabolically healthy and unhealthy, concluding that Odoribacter abundance was higher in healthy subjects42,43. Therefore, our results are consistent with previous studies indicating that Odoribacter abundance is associated with adiposity indicators and metabolic status.
However, as mentioned, an additional cohort and a more extended intervention are needed to confirm these results in our population. To further determine whether Odoribacter abundance is related to metabolic health, we need to include lean children and children with obesity, healthy children, and those with metabolic diseases to explore microbiota composition focusing on Odoribacter and following lifestyle change interventions.
Limitations of the study
For this pilot study, our group recruited 20 individuals who agreed to participate in the intervention; however, after adjusting for inclusion and exclusion criteria, the final sample size (n = 6) was small. The findings of this pilot study should be confirmed in a larger sample. Additionally, a long-term intervention could drive further anthropometric modifications to reflect gut microbiota composition and diversity changes. Therefore, a larger sample size and a more extended intervention are needed to confirm these results and investigate whether further gut microbiota modifications could be observed.
In this short-term pilot study, although no changes in BMI, body fat, gut microbiota composition, or diversity were observed with the intervention, waist circumference reduction was inversely associated with the abundance of Odoribacter after a multidimensional intervention in Mexican children with obesity.
Supplementary data
Supplementary data are available at Boletín Médico del Hospital Infantil de México online (https://10.24875/BMHIM.22000008). These data are provided by the corresponding author and published online for the benefit of the reader. The contents of supplementary data are the sole responsibility of the authors.

