


 nueva página del texto (beta)
 Inglés (pdf)
 Artículo en XML
 Referencias del artículo
 Enviar artículo por email
 Citado por SciELO
  Similares en
SciELO
Similares en
SciELO 
 Permalink
Introduction
Currently, fossil fuels are vital for our global energy needs, accounting for more than 80 % of the world primary energy consumption, IEA (2013). A global fossil fuel study made by Mohr et al. (2015), shows that all the three scenarios analyzed suggest that world coal production may peak before 2025, due to peaking Chinese production, and that only natural gas could have strong growth in the future. The energy consumption and atmospheric emissions of some of the pollutant species reported by Pemex Refinacion under different projections was evaluated by Granados et al. (2021). The authors concluded that is important to develop and apply perspectives than maximize productivity and minimize energy consumption, reducing air emissions. In the last 10 years, the compact and subcompact growth has been higher than most vehicles, close to 100 %. The benefits of the mini-sized electric vehicles were shown by González et al. (2017). The charging of electric vehicles and complementarity of electric vehicles and pumped-hydro as energy storage in small isolated energy systems was investigated by Deflorio et al. (2015), Foley & Gallachoir (2015) and Ramírez et al. (2016), respectively. Can electric vehicles significantly reduce our dependence on non-renewable energy? Scenarios of compact vehicles in the UK are shown by Raugei et al. (2018), Raymand et al. (2021) as a case in point. Studies on alternative fuels using internal combustion engines have been carried out by several authors such as Gugulothu & Reddy (2016) who evaluated In-Cylinder Flow in a diesel engine. Likewise, thermodynamic Analysis of a Turbocharged Diesel Engine Operating under Steady State Condition was carried out by Menacer & Bouchetara (2016). In the same sense, Gómez et al. (2017) and Nguyen & Nguyen (2018) studying the performance of the gasoline-ethanol blend in Otto cycle and motorcycle, respectively.
For the past decade, vehicles using compressed air have been attracting attention. This is due to its low pollution rate and high efficiency, which is comparable to conventional diesel engines. These vehicles could be more efficient if thermodynamic processes are analyzed and modified Zhang et al. (2021).
Huang et al. (2013) have experimentally studied the performance of a compressed-air driven piston engine. Authors found that the outlet pressure increases at high velocity showing the potential of recycling the compressed air energy by attaching additional cylinders (split-cycle engine). Dimitrova & Maréchal (2015) studied compressed air as an innovative solution for hybridization of small gasoline engine. This powertrain presents the advantage of directly using the shaft of the engine to transmit the pneumatic torque, generated from the pneumatic energy source - the compressed air tank. A comprehensive review on compressed air powered engine by Marvania & Subudhi (2017) was presented. From the available results, it is evident that with current mechanisms, vehicles powered solely by compressed air cannot be accepted as a practical alternative. Compressed air hybrid propulsion, which combines compressed air propulsion with a conventional internal combustion engine, may be a potential method of avoiding technical failures Fang et al. (2021). Also, Abela et al. (2022) analyzes the pneumatic parameters that compromise a compressed air system in the presence of leaks and mechanical defects, which have a significant impact on its performance. To compensate these limitations, different hybrid pneumatic strategies were evaluated to improve the efficiency. An optimization method for the pneumatic mode of hybrid pneumatic engine by supplying heat during the expansion process of compressed air was carried out by Fang et al. (2018). The results show that the power and torque of the pneumatic prototype engine under the heat source temperature at 90 °C and 1 MPa intake pressure are both increased.
The researchers Huang et al. (2009) studied recycling exhaust gas energy of hybrid pneumatic power system with Computational fluids dynamics, CFD. The simulation results show that exhaust gas recycling efficiency and merger flow energy are significantly dependent on the optimum adjustment of the cross-section area, CSA, for changes in air pressure. Under these optimum adjustments, the exhaust gas recycling efficiency can reach about 83 %.
Nowadays, the main objective of pneumatic motor research is to study the design and build viability of pneumatic propulsion for commercial applications, mostly used in motorcycle motors. There are two experimental research studies shown by Wang et al. (2014) and Huang et al. (2013) that investigate the variables that affect the performance of a pneumatic motor. On the other hand, theoretical research studies, refereed in the current paper, aim to simulate a pneumatic system for commercial vehicle application considering only the thermodynamic processes that occur in the piston. The theoretical studies explained in the current paper pursue a numerical simulation of internal piston process and compare them with hybrid pneumatic-combustion systems in the paper of Midhun et al. (2014). Furthermore, Korbut & Szpica (2021) consider that compressed air as a propulsion source, has a disadvantage due to its low air energy density, with very few viable solutions available on the market, which has allowed the development of hybrid systems (combined with other fuels) that can potentially be a good method to avoid technical failures. This agrees with what was stated by Fang et al. (2021), which sees the displacement of a vehicle with a compressed air-only powertrain as difficult, creating the opportunity for the development of work to encourage the search for combined alternative energy sources. Particularly, there is a theoretical study which investigates the performance of a CAV (Compressed Air Vehicle) Papson et al. (2010). It stated the necessity for seeking alternatives to improve CAV performance and for the technology to be competitive among other technologies that are already in the market such as internal combustion, hybrid and electric vehicles. Nabil (2019) transformed a gasoline engine of a motorcycle and incorporated compressed air to drive its different components. Although he warns that the use of low pressure is directly reflected in its driving force, which produces a low performance that hinders its commercialization. Xu et al. (2021) develops a test bench for compressed air vehicles, and analyzes the influence of essential parameters, managing to identify torque and moderate speeds within a competitive economic margin. In conclusion, it has been observed in this study that the CAV has a fuel economy greater than IC cars, but the obtained range is considerably lower than any of the other technologies. The study concludes that the CAV technology has opportunities for improvement in fuel charging and performance; also in order to be competitive it must achieve better efficiency and performance indicators.
This paper aims to assess the performance of a pneumatic engine through modelling and simulation, to identify the viability of its use in commercial vehicles. The main contribution of this work, apart from the cylinder parameters, was to include the feed pipe in the modeling.
Modeling
The mathematical modeling is composed of the following 3 main parts: airflow through feeding system, intake valve to the cylinder (opening and closing intake valve, isentropic expansion model), exhaust and remaining (air exhaust, and remaining air compression). Each process is described in this section. The analyzed system we recommend for a compact vehicle.
The main modeling assumptions are:
air is modelled as an ideal gas
adiabatic flow
steady state flow
increase in temperature due to friction in the pipeline is not considered
Airflow through feeding system
The airflow through feeding system process, illustrated in Figure 1a, considers the air entering in the feeding pipe, and in Figure 1b, considers the flow in the pipe, as well as the air compression passing from the cross-sectional area of the intake valve.
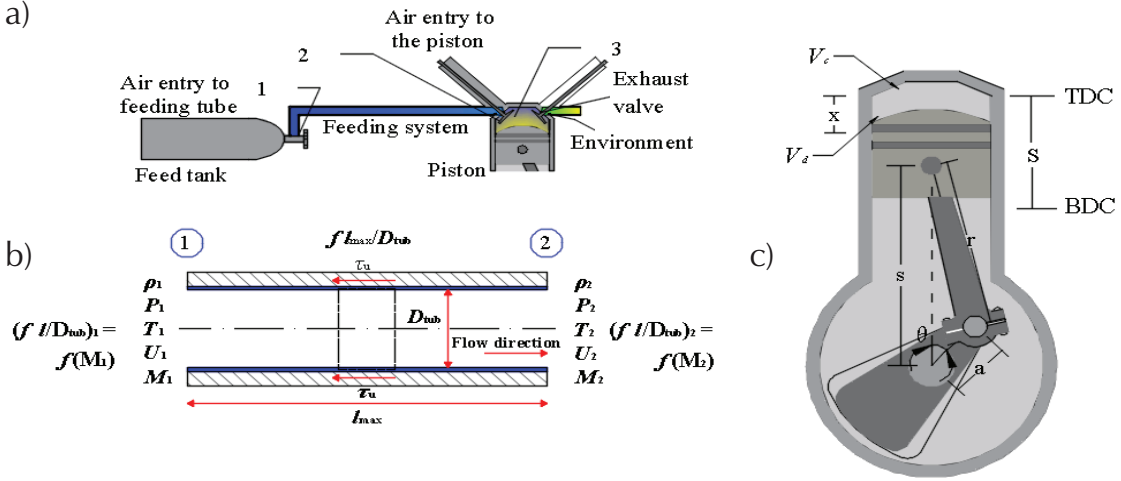
Figure 1 a) Air feeding piping, feeding and exhaust valve, b) Fanno flow in pipe for two points, c) cylinder-piston characteristics
This paper models the feeding flow process assuming ideal gas and dividing it into the following subprocesses: feeding Air flow (Fanno Flow; subsonic speeds and adiabatic process) and Convergent flow (isentropic converging-diverging flow; isentropic and adiabatic process). Fanno flow modeling shown by Bar (2018), considers frictional forces interacting inside the pipe as non-isentropic; hence, entropy increases along the pipe. The equation that represents the Fanno flow, uses an average friction factor as follows.
Where:
|
Fanno friction factor |
l max = |
maximum pipe length |
D = |
diameter |
k = |
specific heat rate C p/C v |
M = |
Mach number defined by fluid to sound velocity, M = u/c |
For Fanno Flow modeling is convenient to compute the thermodynamic properties in relation to critical properties of the fluid. This is because the friction modifies the stagnation properties at different points of the pipe, whereas the critical properties are those where the speed of the fluid is equal to the speed of sound (M = 1). All the equations will be written as a function of the theoretical stagnation variable.
here T o and T are the stagnation and fluid temperature, respectively.
The equations that allow computations of thermodynamic properties along a pipe are Eqs. (3), (4), and (5) for pressure, temperature, and stagnation pressure, respectively:
where P
o, P and c are the stagnation and fluid pressure and sound speed, respectively. The last variable defined by
Equation (1) is a dimensionless friction factor of Fanno as a function of Mach's number
It should not be forgotten that along the pipe, in Fanno model, the mass conservation equation is satisfied.
Additionally, pressure drop inside a pipe has a limit, which is known as a critical point, P limit; this is a physical limitation depending on the fluid, and computation of this limit is made with Eq. (7):
This physical limit generates a maximum speed that a compressible fluid can achieve due to the differences in pressure inside a pipe line (pressure drop). In the case that the pressure drop is greater than the critical ratio Eq. (7) Fanno flow model is used to compute fluid speed, meaning speed of sound is not exceeded. In any other condition, moving away from the critical pressure difference condition, the calculation of fluid speed, U, at a point in the pipeline was performed using the equation suggested in Mott (2015) and Zacarías et al. (2017). The density ρ is utilized.
Intake valve to the cylinder
The expansion model is considered as an adiabatic process. The equation that relates the temperature and the speed of the sound can be written as follows:
The area that a convergent or convergent-divergent pipe must have to accelerate a fluid at the speed of sound is known as the critical area (A *). The relationship between the cross-sectional area with the critical area and the Mach number is given as:
Throughout the convergent or convergent-divergent pipe, the mass conservation is maintained, allowing us to compute through the conservation of matter law the mass flow,
The average valve opening time allowing air into the piston and the change in mass flow is modelled as a function of the crank angle (θ), variables of piston position (s), and piston instantaneous speed (U p) were used, as shown by Pulkrabek (2014). From Figure 1c, the piston speed is computed as follows:
Where:
The average velocity is
Where:
Particularly, the relative position of the piston is computed with respect to the distance from the centre of the crankshaft to the connection rod of the piston. This is shown in Figure 1 as the variable s.
Once the piston position is known, it is possible to compute the instantaneous piston volume, V d, as:
where V c and B are the clearance volume and bore. Thus, it is possible to compute density of the gas, using Eq. (18).
Computing other thermodynamic parameters such as pressure are performed using ideal gas equation.
Isentropic expansion
The isentropic expansion process begins when the inlet valve is closed. The piston chamber no longer receives more air thus the mass of air inside the piston is constant. Air density is computed considering the density definition.
On the other hand, the piston continues to increase its volume, which was computed by Eq. (17). Due to this expansion the density of the air changes in each degree of crank rotation, consequently the pressure and temperature are modified. The process is considered isentropic where the pressure was computed as follows:
Performance indicators
Work, w, is the energy that acts in the system at a given distance; it must be computed for a complete cycle, IMEP is defined as the indicated mean effective pressure that is an indication of the operating pressure which the system is working, power is defined as the work done per unit of time
This is defined as the force acting on a momentary distance. The torque,
The power, E, is computed as Eq. (23).
Modeling the time this engine, T, takes for one revolution is defined as follows:
In order to model the efficiency,
Where:
Exhaust and remining
Air exhaust
Modeling air exhaust is based on considering a small exhaust pipe length, hence pressure at the outlet of the exhaust valve is equal to atmosphere pressure. In the present paper, the throttling occurs due to the exhaust valve pressure and the outlet pressure (atmospheric pressure), this is shown in Figure 1. The difference in pressure between the piston and the atmospheric pressure forces the gas to be throttled in the valve. Before opening the exhaust valve, the conditions of total mass in the piston, pressure, temperature, and density, as well as the atmospheric or outlet pressure of the valve are known. This information is used to compute the output speed with Eq. (9), mass flow, temperature and air outlet density with Eqs. (15), (18), and (2), respectively. Finally, using mass flow it is possible to know mass change inside the piston at any time. As mentioned in case the pressure difference is greater than the critical difference, it must be assumed that the flow is being choked, so that the output speed at the valve will be equal to the speed of the sound (M = 1). Using the equation of the Joule-Thomson Coefficient, the inlet temperature can be computed for the exhaust pipe.
The Joule-Thomson effect, µ J, is defined as an isenthalpic process. It is summarized in the following equation according to Vent (2001).
Assuming that air behavior follows Van der Waals equation of state, Joule-Thomson coefficient can be written as follows:
Where a and b are well defined, and they are parameters of the Van der Waals equation for the particular gas.
Once the output speed at the valve and the density of the fluid in the exhaust pipe are known, it is possible to compute the inlet speed in the exhaust pipe through the mass conservation Eq. (15).
Remaining compression air
The process of compressing the remaining air is an isentropic process. This process begins at the moment the exhaust valve is closed, the remaining air is subjected to a compression process in order to reach the nominal working pressure of the piston. The difference between this process and the process of isentropic expansion is that the present process decreases its volume in each movement of the crank, as opposed to the expansion process where it increases.
Results and discussions
The model in the programming language Engineering Equation Solver, EES, Klein (2018) was programmed. This software is useful for solving engineering problems. In order to validate the model proposed in Section 2 for a pneumatic engine, the results were obtained with the engine data shown in Table 1, experimentally obtained by Huang et al. (2013) and explained in Manrique (2018). For the simulation, engine parameters shown in Table 2 were utilized. The results for a two-stroke pneumatic motor obtained with the model are shown in this section.
Table 1 Engine characteristics
| Parameter | Value |
|---|---|
| Displacement volume, cm3 (4-stroke) | 101.7 |
| Horsepower, at 7500 rpm, HP | 7.5 |
| Torque, at 6000 rpm, N-m | 7.44 |
| Bore and stroke, mm | 50, 51.8 |
| Compression ratio | 10 |
Table 2 Parameters changed for the simulation
| Parameter | Value |
|---|---|
| Initial pressure, bar | 2, 2.5, 3 |
| Compression ratio | 5, 10, 20 |
| Intake port, mm | 15, 20, 25 |
| Intake pipeline length, cm | 20, 30, 50 |
| Feeding valve opening timing. [o] | 0-130, 0-150, 0 - 170 |
| Exhaust valve opening timing, [o] | 150-330, 180 - 330, 190-330 |
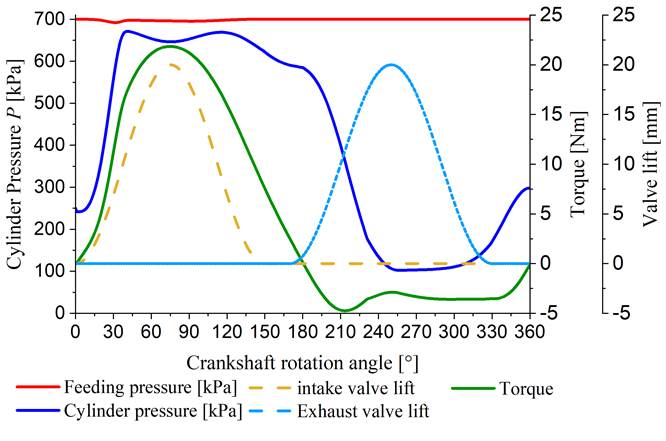
The results allowed to obtain a graph like the one in Figure 2, where the behavior of the torque, the opening of the intake and exhaust valves, as well as the supply pressure and the pressure inside the cylinder is shown. The Figure shows a behavior very similar to the experimental results published by Huang et al. 2013.
The pressure results inside the cylinder published by the author and those found in this work were compared. The error is presented in Figure 3, where it can be seen that the maximum error of the model is 67.2 %, while most of the points have an error of less than 35 %. From this Figure, it can be seen that in thrust, between 0 and 25 degrees of crankshaft rotation, the model has an error of less than 10 %.
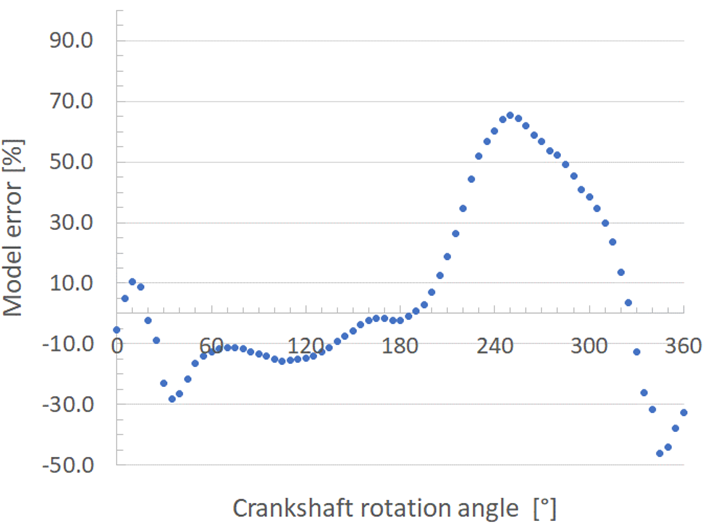
Figure 3 Error in the modeling results, versus experimental results of the literature, from Huang et al. (2013)
The comparison of the experimental results from the literature with those obtained in this work, without and with the pipe (improved model), is presented in Figure 4. From this Figure, it can be concluded that, including the supply pipe to the model, the pressure inside the cylinder can increase up to 38.7 % at 25° of crankshaft rotation.
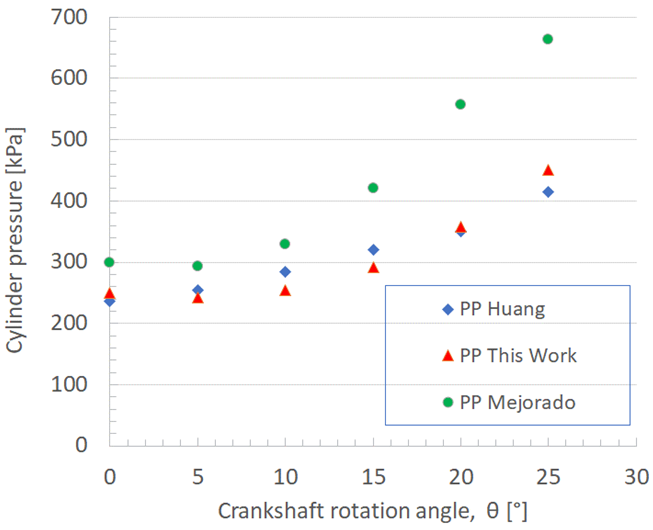
Figure 4 Experimental results from the literature with those obtained in this work, without and with the pipe (improved model)
With these results of the model with an error of less than 10 %, compared to those published in the literature, it was concluded that the model can be used to perform a first assessment of a pneumatic motor operating at different operating conditions, as presented below.
Air flow to feeding system
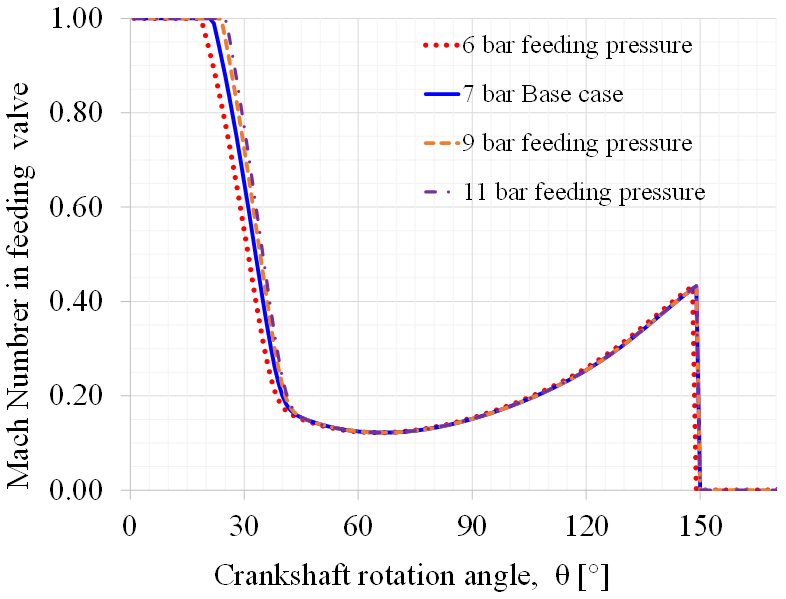
The most noteworthy system limitation is fluid speed, which is strongly related by valve opening. Choking effect is generated during the first 20 crank rotation degrees. This constrains air speed, hence mass entering the piston during the first crank rotation degrees, when pressure difference from piston and feeding pressure is maximum. The choking effect time increases when feeding pressure increases, this is shown in Figure 5. Likewise, it is observed that the speed decreases up to 80 % during the period from 20° to 40° degrees. When speed reaches the point of 40 degrees of rotation, it is observed that the speeds for all cases are equal and this is maintained during the remaining feeding process. An increase in the inlet speed is observed during the remaining degrees of feeding, from 90° onwards, due to the closing of the intake valve.
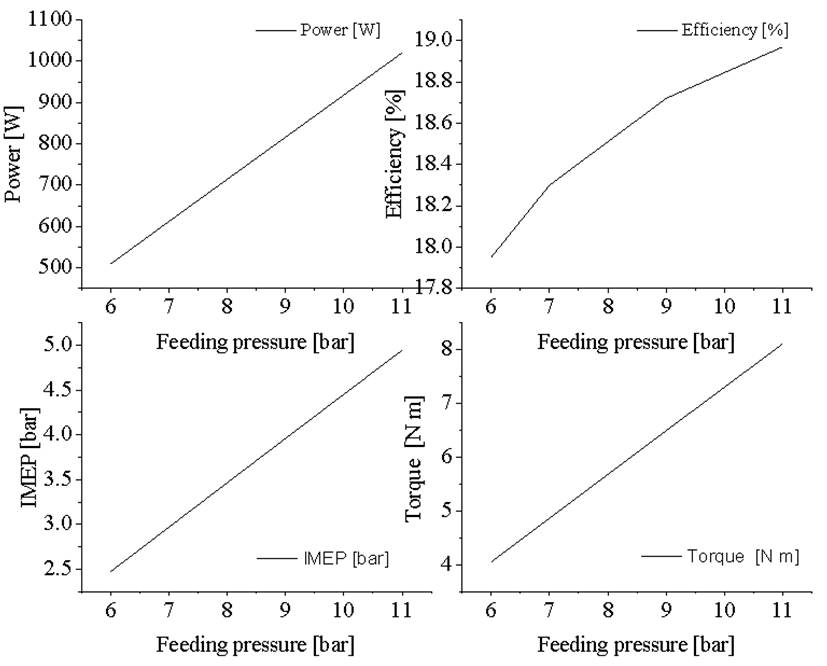
It is shown in Figure 6 that torque and power increase considerably when the feeding pressure increases; this is due to the increase in IMEP or average piston pressure. It is observed that the IMEP is below 50 % of feeding pressure. Despite of IMEP increase, system efficiency does not rise significantly. In fact comparing the result of 6 bar feeding pressure of against base case, only an efficiency improvement of 0.35 % is observed. In the case of raising the supply pressure to 9 bar, efficiency increased by 0.42 %. The last case feeding pressure is raised to 11 bar, thus efficiency increases by only 0.25 % compared with 9 bar feeding pressure case.
The variables modified and compared with base case scenario were pipe diameter and pipe length. The results are shown in Figure 7. Changes in the feed diameter were simulated by decreasing it by 5mm and later increasing it by 5 millimeters then compared to base case scenario. Modification in feeding pipe length were from base case scenario of 30 cm to 20 cm and then to 50 cm. Simulation results show an improvement in performance indicators and efficiency by increasing the diameter of the pipe by 5 millimeters. The improvement in indicators is 3.2 %, with an increase in efficiency of 0.47 %. As the feed diameter decreased, the results were a decrease in the indicators by 13.5 % and fall in efficiency of 1.93 %.
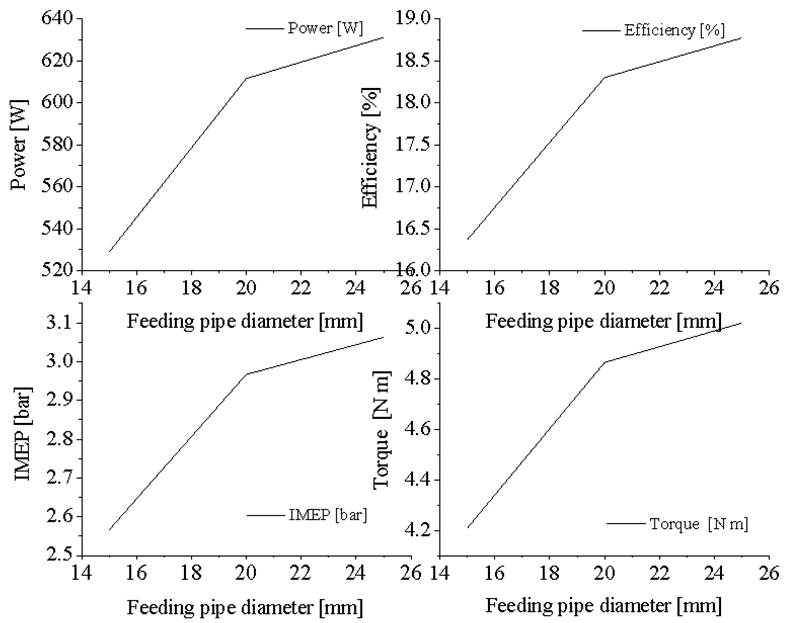
Figure 7 Performance parameters: a) power and efficiency, b) IMEP and torque vs feeding pipe diameter
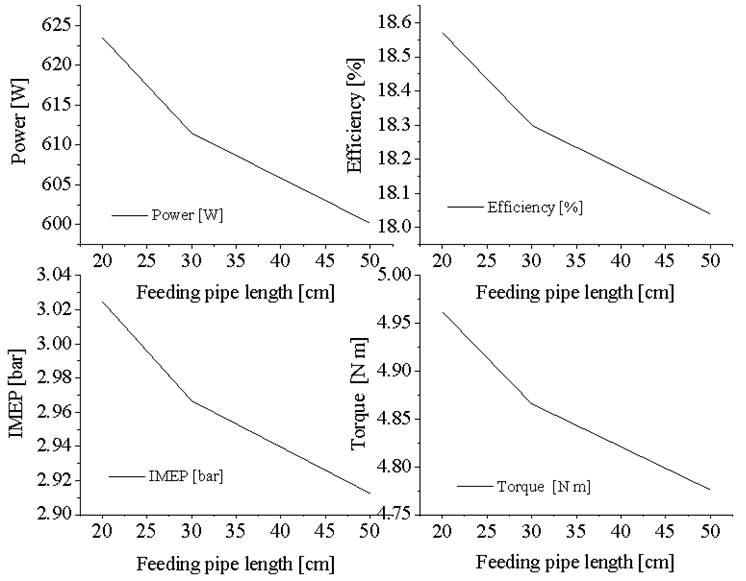
Pipe length changing scenarios in Figure 8 show an improvement on indicators is observed as the length of the pipe is reduced, increasing the indicators such as work, power, torque and IMEP by 2 % and increase efficiency moderately for 0.27 %. The increase in pipe length leads to a drop in the indicators by 1.9 % and a decrease in efficiency of only 0.26 %.
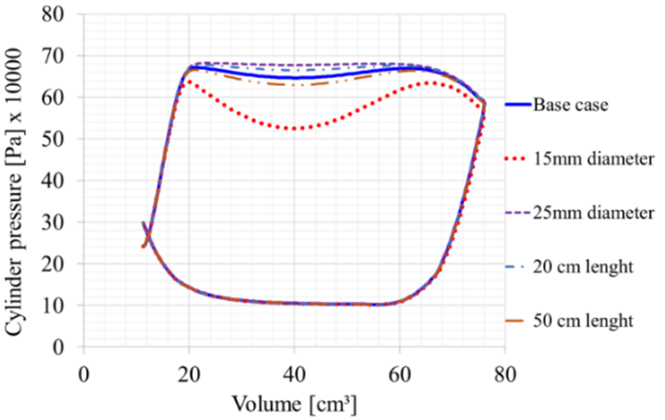
Decreasing pipe diameter by 5 mm generates a considerable drop in performance indicators; there are two reasons why this effect is so important. First, the indicated mean pressure (IMEP) drops considerably, this effect can be seen in Figure 9 which shows the Pressure-Volume diagram. It is observed that when piston start descending it suffers an important pressure drop, from 640,000 Pa to approximately 520,000 Pa, starting around the 20 cm3 and reaching its minimum in 40 cm3; later, the pressure starts rising. This phenomenon occurs because piston instantaneous speed reaches its maximum value around a crank angle of 70 and 90 degrees, during this interval piston volume is between 20 cm3 and 60 cm3.
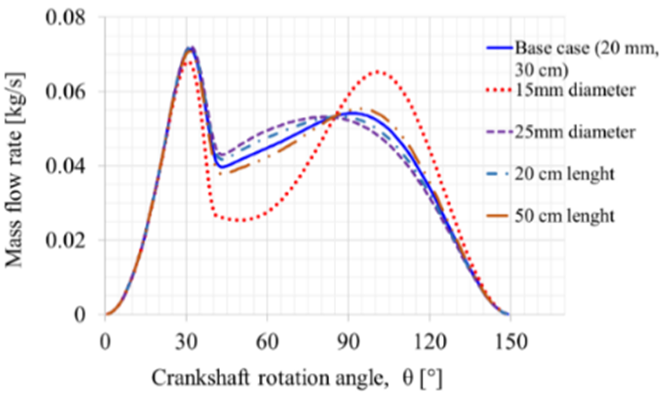
The pressure drop in the piston is related with system flow restrictions. Hence, in the case when the diameter is the smallest, the volumetric flow is the lowest by about 0.015kg/s compared to base case. This effect can also be observed in Figure 10. It is clear that the largest mass flow fluctuation occurs during the motor rotation when the system has the lowest tube diameter, from 15 mm. During crank rotation angle interval of 70° to 90° (where the maximum piston speed occurs) the mass flow of the base case with a biggest diameter, 25 mm, is very low compared to the other cases; actually, it can be deduced that the pressure drop is a consequence of the minimum amount of mass entering the system at a rate much lower that the volume increase speed.
Intake valve to the cylinder and compression ratio
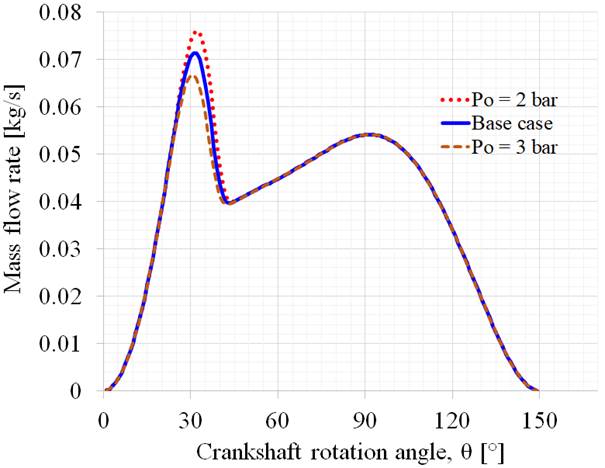
Effects on the efficiency results for these cases are due to the flow change. This effect can be seen clearly in Figure 11. This Figure shows that at the beginning of the process between degrees 20 ° and 40 ° the maximum mass flow occurs in each of the shown cases, 0.076 kg/s, 0.0715 kg/s and 0.0662 kg/s for 2 bar, base case and 3 bar respectively. In the same line, for the case of lower initial pressure the maximum mass flow of 0.076 kg/s is the highest, consequently the maximum mass flow for the upper initial pressure is the lowest, 0.0662 kg/s. This increase in flow is not absorbed by the system in the most efficient way since it is shown before that the flow is not utilized with the highest efficiency, because during this peak on mass flow piston pressure it does not increase significantly. In conclusion, the initial pressure of the piston does not have a significant effect on performance indicators, but it has a positive effect on efficiency. Thus using the highest initial pressure of 3 bar the system can offer the system could operate in a more efficient way.
Compression ratio influence
The compression ratio has shown to be an important variable for the performance of the motor. The differences in feeding air speed can be seen in Figure 12. This Figure shows that in different rotation degrees there are drastic changes in the feeding speed on the valve. An example of this is to review the results in 30 ° of rotation where we observe that for a compression ratio of 20 the Mach number is around 0.3, instead for a compression ratio of 10 the Mach number is 0.6, and for the smaller compression ratio (RC 5) the Mach number is 0.9. Having a smaller piston volume, in the case of 20 CR the consequence is that the volume of air entering the piston is up to 66.67 % smaller.
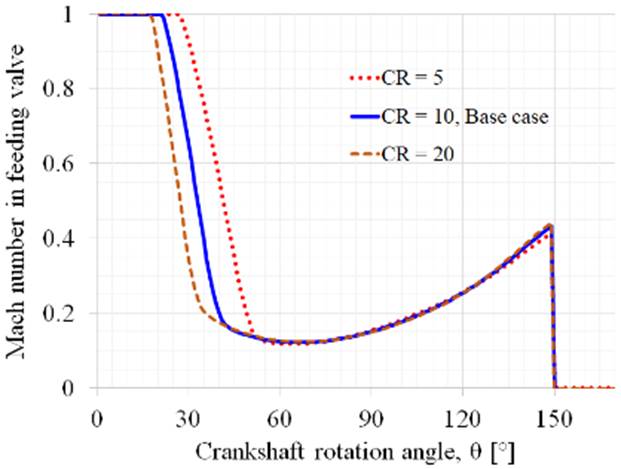
Figure 12 Mach number in intake valve changes with crank rotation angle at different compression ratio
The results of Figure 13 show that the compression ratio has a direct effect on the system efficiency in. However, it does not have significantly affect variables such as Work, Power, or Torque. This indicates that using different CRs to improve variables like work, power or torque would not help. On the other hand, the compression ratio significantly affects the volumetric flow, increasing it in each case, but without obtaining a significance benefit (this is reflected in small IMEP changes).
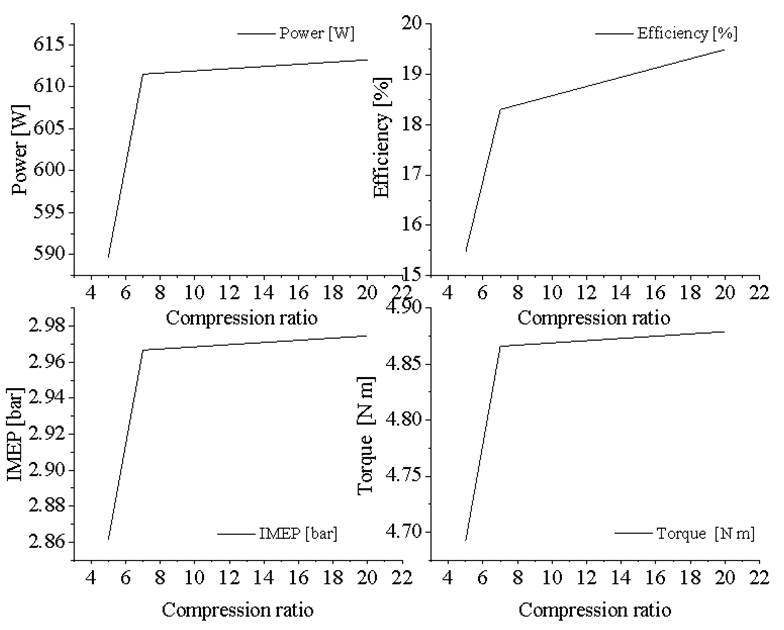
The positive effect on efficiency due to compression ratio decreases as volume grows. It can be seen that the efficiency increase effect of switching from a CR 5 to a CR 10 (base case) is 2.83 %, while the effect of switching from a CR 10 (base case) to a CR 20 is just 1.19 %. Therefore, the improvement in efficiency is due to the compression ratio having an upper or maximum limit. In conclusion, these results shown that compression ratio has a significant effect on the efficiency of the system. It is advisable to use a smaller volume as the car is driven at higher speeds; this improves the efficiency of the engine, without generating a detrimental effect on the power, work and torque of important consequences.
Exhaust and remaining
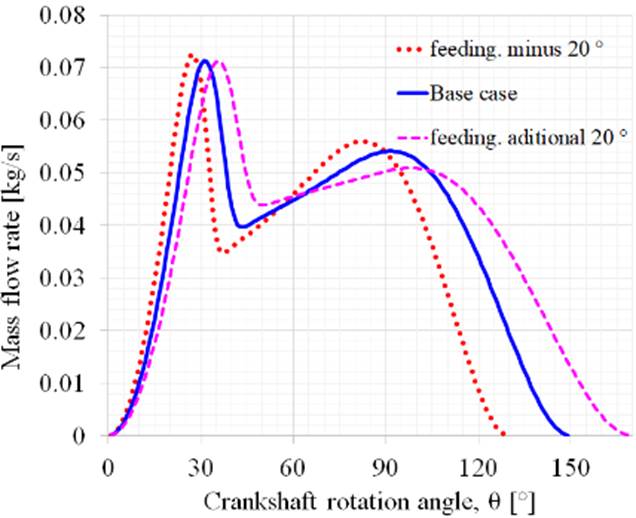
Figure 14 shows the phenomena that rules the mass flow in the different rotation angles. At the beginning of the process the flow rate is governed mainly by the valve opening, since the flow is in a process of convergent flow, so depending on area changes the flow accelerates. This effect shows a mass flow acceleration from 0 kg/s to 0.07 kg/s, between 0° degrees and 30° degrees for the base case. After this process the pressure difference is the phenomenon which governed the fluid speed. This is the reason mass flow is reduced to a minimum, to 0.040 kg/s in 40° degrees. At that minimum point the flow rate continues depending on the pressure difference, but the system undergoes a small pressure drop due to the increased speed of the piston resulting in a greater pressure difference by accelerating the fluid. Finally, a second maximum mass flow of 0.054 kg/s at approximately 90° degrees is observed for the base case; this happens due to a combination of two effects; first, the intake valve decreases its cross-sectional area (it is in the closing stage); secondly, the difference of pressures has decreased considerably generating a rapid drop in fluid speed. This drop in mass flow is maintained until the inlet valve closes completely. Figure 14 shows where highest and lowest mass flow occurs in the case of maintaining the feed valve with 20 ° less.
Comparing the result of base case with the second case, it is observed that the increase in opening time of the exhaust valve adversely affects all the engine performance indicators. The results shown in Figure 15 are compared by the valve opening timing ratio,
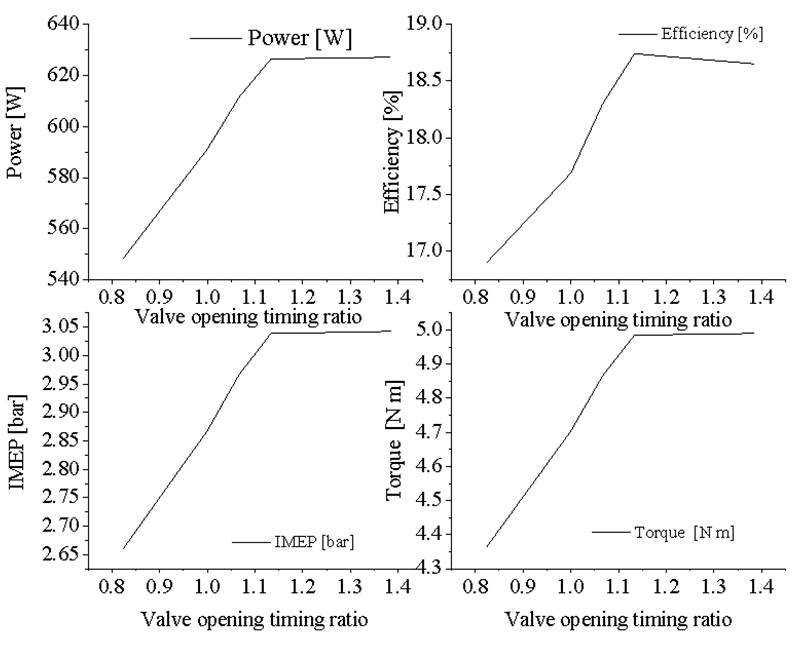
Figure 15 Performance parameters: a) power and efficiency, b) IMEP and torque versus exhaust feeding valve opening
It decreased by 1.4 % the efficiency and affection in about 10 % the performance indicators like work, power, torque and IMEP. On the other hand, when comparing the base case with intake time decrease by 20 ° an increase of all the performance indicators is observed. These increase by 2.5 %, efficiency increases by 0.35 %.
Conclusions
The results of the model and the present study allow the following conclusions:
The model predicts the power, torque and efficiency results of a pneumatic engine providing the feeding pressure and some flow parameters such as length and diameter of the feeding pipe. This is very useful because the model could be used in the prediction of the performance of pneumatic motors with different operating conditions.
Influence of feeding pressure on performance variables such as work, power, and torque increase as the piston pressure increases. However, the influence of this on the efficiency of the system is not linear and has an upper limit. Additionally, using a pressure above 9 bars can lead to leakage problems in the system. Hence, this variable has strong limitations in improving system performance. In addition, the energy required to bring a gas to high pressure conditions must be considered.
The initial pressure of the piston has no significant effect on the performance of the system; thus, designing the highest possible initial pressure value will benefit the system moderately.
The compression ratio proved to be a key variable to improve the system efficiency. It is demonstrated that this variable can give important benefits to the system in all performance indicators. This paper shows that the greater the compression ratio, the greater the benefit to the efficiency of the system. This variable also has an upper limit to improve efficiency.
Flow variables such as the diameter and length of the feed pipe proved to have significant effects on the efficiency of the system as well as in the performance indicators. Diameter flow effect proved to have a greater effect on yield than the length of the pipe. It is therefore recommended to use a larger diameter to improve efficiency. Additionally, it is clear that a balance between the speed of the piston and the mass flow must be considered for the design; otherwise, the piston pressure drop will occur causing a significantly decrease of performance.
Valve opening showed a moderate effect on the system. It is clear that one should look for the shortest admission time as well as the shortest iso-entropic expansion time to improve the system performance. Although it is desirable to allow compressed air to be maintained for the longest time in the system, this effect can be achieved by the choking effect, designing the flow area in the exhaust valve.
It is advisable to make an optimization of the variables above mentioned with a cost benefit study against the efficiency increase of the same system.

