


Servicios Personalizados
Revista
Articulo
 texto en
  Inglés (pdf)
 Artículo en XML
 Referencias del artículo
 Enviar artículo por email
Indicadores
-
 Citado por SciELO
 -
 Accesos
Links relacionados
-
 Similares en
SciELO
Similares en
SciELO
Compartir

 Permalink
Agrociencia
versión On-line ISSN 2521-9766versión impresa ISSN 1405-3195
Agrociencia vol.52 no.3 Texcoco abr./may. 2018
Natural Renewable Resources
Models of dominant height growth and site indexes for Pinus ayacahuite Ehren
1Universidad de la Sierra Juárez. Avenida Universidad s/n, Ixtlán de Juárez, 68725, Oaxaca, México.
2Instituto de Estudios Ambientales-División de Estudios de Postgrado. Universidad de la Sierra Juárez, México.
3 Ciencias Forestales. Campus Montecillo. Colegio de Postgraduados. 56230. Montecillo, Estado de México, México.
The development of mathematical models with technical and scientific bases is important in forest management decision-making. The objective of this study was to model dominant height growth of Pinus ayacahuite Ehren to enable productivity projections. Data on stem analysis of 34 P. ayacahuite individuals were used to fit growth models, classic in forest biometry (Schumacher, Chapman-Richards, Levakovic II, Hossfeld IV and Gompertz), as well as the modeling strategies Guide Curve Method, Algebraic Difference Approach (ADA) and Generalized Algebraic Difference Approach (GADA), using non-linear least squares method. A simultaneous fit was used for the ADA and GADA equations and a 40-year base-age. The graphic and numerical results of the models were satisfactory, according to the statistical indicators of goodness of fit. The indicators of fit of Chapman-Richards polymorphic b 2 models in guide curve and ADA, polymorphic b 1 of Hossfeld IV in ADA and the Hossfeld IV model under the GADA approach were better than the other models. The models selected enabled the construction of families of site index curves. Of these, the Chapman-Richards polymorphic b 2 model in ADA had the best prediction capacity. Therefore, its use is recommended for determining the site index and to classify levels of timber productivity of P. ayacahuite stands.
Key words: site quality; guide curve method; algebraic difference approach; generalized algebraic difference approach; Pinus ayacahuite; forest productivity
El desarrollo de modelos matemáticos con bases técnicas y científicas es importante para tomar decisiones en el manejo forestal. El objetivo de este estudio fue modelar el crecimiento en altura dominante de Pinus ayacahuite Ehren, para realizar proyecciones de su productividad. Datos del análisis troncal de 34 individuos de P. ayacahuite se usaron para ajustar modelos de crecimiento, clásicos en biometría forestal: Schumacher, Chapman-Richards, Levakovic II, Hossfeld IV y Gompertz; además, con las estrategias de modelado: curva guía, el método de diferencia algebraica (ADA) y el método de diferencia algebraica generalizada (GADA), mediante mínimos cuadrados no lineales. Un ajuste simultáneo se empleó para las ecuaciones ADA y GADA y edad base de 40 años. Los resultados gráficos y numéricos de los modelos fueron satisfactorios de acuerdo con los indicadores estadísticos de bondad de ajuste. Los indicadores de ajuste de los modelos polimórfico b 2 de Chapman-Richards en curva guía y ADA, polimórfico b 1 de Hossfeld IV en ADA, y el modelo de Hossfeld IV bajo el enfoque GADA fueron mejores en comparación con los otros modelos. Los modelos seleccionados permitieron construir familias de curvas de índice de sitio. De ellos, el modelo polimórfico b 2 de Chapman-Richards en ADA mostró capacidad de predicción mayor. Por tanto, se recomienda su uso para determinar el índice de sitio y clasificar los niveles de productividad maderable de rodales de P. ayacahuite.
Palabras clave: calidad de sitio; curva guía; diferencia algebraica; diferencia algebraica generalizada; Pinus ayacahuite; productividad forestal
Introduction
Modeling dominant height growth and its corresponding expression of site index enable estimating productivity of forest stands (Tamarit et al., 2014). However, the differences in productive potentiality of the sites have an influence in stand management aspects, such as defining productive objectives, the silvicultural regime, optimum rotation age, harvesting techniques and investment profitability (Ivancich et al., 2011).
The forester should calculate dominant height growth to evaluate product potential since it is one of the variables least affected by changes in density and intermediate silvicultural treatments in a stand. Moreover, it is related to the total volume, is easy to assess and is an indicator of forest productivity (Clutter et al., 1983; Tamarit et al., 2014). The site index (IS) enables estimating productivity of a forest site in a practical manner. The concept of IS is based on the idea that more fertile sites for a given species will produce trees of larger dimensions at a certain base age (Daniel et al., 1979; Mendoza, 1993).
Methods for constructing IS curves are classified into four groups: the Guide Curve Method (GCM), the Algebraic Difference Approach (ADA) developed by Bailey and Clutter (1974), the Parameter Prediction Method (PPM) (Clutter et al., 1983), and the Generalized Algebraic Difference Approach (GADA) proposed by Cieszewsky and Bailey (2000).
The Guide Curve Method uses data from temporary sampling plots and is utilized to generate anamorphic and polymorphic type site index curves (Clutter et al., 1983; García et al., 1998). For dynamic modeling, it is necessary to have data measured at least twice in trees or stands using interval plots, permanent plots or stem analysis (Gadow et al., 2007). The ADA method involves, essentially, the substitution of a parameter of the base model to express it as a function of the site. This approach enables constructing base-aged invariant site index models and invariant of the projection route (Baily and Clutter, 1974).
Cieszewski and Bailey (2000) introduced a generalized ADA methodology, the GADA approach, which considers that the base equation expands to permit that more than one parameter depends on the site quality and that the families of curves obtained increase in flexibility (Cieszewski and Bailey, 2000; Cieszewski, 2001). The main advantage of GADA is its capacity to broaden the base of equations, in accord with several theories on growth characteristics (asymptote, growth rate). This includes the possibility of simulating concurrent polymorphism and multiple asymptotes, an important property of site equations (Cieszewski, 2003; Diéguez et al., 2006).
The objective of this study was to model dominant height of Pinus ayacahuite Ehren under different growth hypotheses (anamorphic and polymorphic curves and curves of asymptotic polymorphism) and make productivity projections. The hypothesis was that the polymorphic models better describe the growth pattern and productivity of the species under study.
Materials and Methods
Study area and dendrometric data
The study was conducted in forests on communal land of Ixtlán de Juárez, Oaxaca, México (17° 23´ 0.50´´, 17° 23´ 0.58´´ N, 96° 28´ 45´´, 96° 28´ 53´´ W, mean altitude 2780 m). The database was obtained from stem analysis of 34 P. ayacahuite individuals from cross sections extracted immediately after the stump, from diameter at breast height (DBH, 1.3 m above-ground) and after DBH, at each commercial length (2.62 m, 2.54 m and 1.25 m) up to the tree apex. The dendrometric information was age-height in each cross section and age-total height of the tree. With these data, the complete profile of each individual was reconstructed.
The data cover a wide interval of dominant heights and ages (Table 1). The statistical summary included mean, median, standard deviation and variable interval for fitting dominant height (HD) growth functions.
Biometric models used and derivation of self-referencing models
To forecast dynamic and biological behavior, we used five base models (guide curve) with non-linear structure (Table 2), classic in forest biometry.
Table 2 Biometric models tested for modeling dominant height growth of Pinus ayacahuite Ehren.
| Modelo | Expresión | Código de ecuación |
|---|---|---|
| Schumacher (Schumacher, 1939) |
|
Ec. 1 |
| ChapmanRichards (Richards, 1959) |
|
Ec. 2 |
| Levakovic II (Levakovic, 1935) |
|
Ec. 3 |
| Hossfeld IV (Hossfeld, 1822) |
|
Ec. 4 |
| Gompertz (Gompertz, 1825) |
|
Ec. 5 |
where: HD is dominant height (m), E is stand age (years), exp is the exponential function, ln is natural logarithm and bi is parameters to be estimated.
In modeling HD growth and IS of P. ayacahuite, each model was expressed in its formulations under the guide curve and ADA (Table 3). For the case of the Hossfeld IV and Chapman-Richards models, two GADA formulations were posed (Table 4). These approaches permitted construction of different IS curves (anamorphic, polymorphic and asymptotic polymorphic).
Table 3 Structure of the growth models in their ADA (Algebraic Difference Approach).
| Modelo de Predicción | Modelos de proyección | |
|---|---|---|
| Schumacher |
Anamórfico: |
Polimórfico: |
| Chapman-Richards |
Anamórfico: |
|
| Polimórfico b1: |
Polimórfico b2 |
|
| Levakovic II |
Anamórfico: |
|
| Polimórfico b1: | ||
| Polimórfico b2: | ||
| Hossfeld IV |
Anamórfico |
|
| Polimórfico b1: | ||
| Polimórfico b2: | ||
| Gompertz |
Anamórfico: |
|
| Polimórfico b1 | ||
| Polimórfico b2: | ||
where HD1 is dominant height (m) in the state 1 of measurement; HD2 is dominant height of state 2; E1 and E2 are tree age (years) corresponding to states 1 and 2. ln is the natural logarithm and bi parameters to be estimated.
Table 4 Structure of two base models with their GADA formulations (Generalized Algebraic Difference Approach).
| Modelo | Parámetro relacionado al sitio | Solución para X con valores iniciales (HD1, E1) |
|---|---|---|
| Chapman-Richards: |
|
donde: L0 = In[1 exp(-b0E1)] |
| Hossfeld IV: |
|
|
Deriving the models with a guide curve involved fitting the base models to obtain the average curve in the entire interval of observations of HD - E, from which proportional curves were generated above and below the central curve in the following order: 1) each growth equation (in its integral form) was fitted to generate the guide curve of a base age (EB) from the predicted HD value, 2) the model was formulated in its site index expression, 3) the parameter of the growth hypothesis of interest was selected and solved from the IS expression, and 4) the solution of the parameter in the original equation (integral) was substituted.
The ADA method consisted of developing the equation to be fitted in its differentiated form, by expressing future dominant height (HD2) as a function of future age (E2), from the initial age (E1) and initial dominant height (HD1). The model of algebraic difference that defines the family of IS curves is expressed as HD2 = f (HD1, E2, E1, β), where HD2 is the value of dominant height at age E2 (age of the projection), HD1 is the dominant height at age E1 (initial age) and β is the vector of regression parameters (Clutter et al., 1983; Diéguez et al., 2005; Magaña et al., 2008; Santiago et al., 2013).
In developing the GADA models, the following were considered: 1) selection of a growth model and identification of dependent parameters of site quality, 2) expression of the selected parameters as functions of the site quality defined by the variable X (not observable, independent variable that describes site productivity) and the new parameters, 3) the bidimensional base equation selected was expanded to an explicit site index tridimensional equation, and 4) the value of X was solved from the initial conditions of the site; that is, we parted from initial values of age and height, in such a way that the model was implicit and applicable (Cieszewski and Bailey, 2000; Cieszewski, 2002; Vargas et al., 2010; Quiñonez et al., 2015).
Model fit
To fit the guide curve equations, 468 pairs of dominant height-age data were used. In ADA and GADA, fit was performed simultaneously to minimize errors of the equation system; HD1 = f (E1, b), HD2 = f (HD1, E2, E1, b) with 434 pairs of non-overlapping data. These fits were done using non-linear least squares with the procedure MODEL of SAS/ETS® v. 9.0 (SAS Institute Inc., 2002). Graphic analysis was done with R Project 3.2.3 (R Development Core Team, 2015).
Statistical indicators
The statistical indicators used to evaluate goodness of fit of each model tested are presented in Table 5. The graphic analysis of the predictive capacity and significance of the estimators of the parameters of each model were the basis of election of the best models. Significance was evaluated with the Student t test, under H0: b i = 0 and a critical value α = 0.05 (Infante and Zarate, 2012).
Table 5 Statistical indicators for evaluating goodness of fit of dominant height growth models for Pinus ayacahuite Ehren.
| Indicador | Expresión |
|---|---|
| Coeficiente de determinación (Pseudo R2) |
|
| Coeficiente de determinación ajustado por el número de parámetros (R2-adj) |
|
| Suma de cuadrados del error |
|
| Cuadrado medio del error |
|
| Raíz del error medio cuadrático |
|
where donde
Resuslts and Discussion
Guide curve
All the non-linear models generated adequate fit. The highest R2-adj values were found with the Levakovic II, Hossfeld IV and Chapman-Richards, explaining nearly 93.6 % of the total variance in dominant height. Moreover, the three models generated the lowest values of SCE and, consequently, of RECM. Each had significant parameters, with P value below 1 % (Table 6).
Cuadro 6 Statistics of goodness of fit and estimated parameters of the dominant height growth prediction models for Pinus ayacahuite Ehren.
| Modelo | SCE | CME | RECM | R2 | R2-adj | Estimación | P > |t| | |
|---|---|---|---|---|---|---|---|---|
| Schumacher | 3049.4 | 6.5438 | 2.5581 | 0.9267 | 0.9265 | b0 | 42.74808 | <0.0001 |
| b1 | 33.5607 | <0.0001 | ||||||
| Chapman-Richards | 2659.3 | 5.7190 | 2.3914 | 0.9361 | 0.9358 | b0 | 38.56064 | <0.0001 |
| b1 | 0.022142 | <0.0001 | ||||||
| b2 | 1.469665 | <0.0001 | ||||||
| Levakovic II | 2655.5 | 5.7107 | 2.3897 | 0.9362 | 0.9359 | b0 | 61.15912 | <0.0001 |
| b1 | 41.13109 | <0.0001 | ||||||
| b2 | 1.756719 | <0.0001 | ||||||
| Hossfeld IV | 2656.9 | 5.7138 | 2.3904 | 0.9361 | 0.9359 | b0 | 48.14863 | <0.0001 |
| b1 | 5.827152 | <0.0001 | ||||||
| b2 | 1.431855 | <0.0001 | ||||||
| Gompertz | 2811.7 | 6.0468 | 2.4590 | 0.9324 | 0.9321 | b0 | 31.26157 | <0.0001 |
| b1 | -3.34316 | <0.0001 | ||||||
| b2 | -0.04461 | <0.0001 | ||||||
SCE: sum of square errors; CME: mean squared error; RECM: root mean squared error; R2: coefficient of determination; R2-adj: adjusted R2 statistic; bi: value of estimated parameters.
The graphic analysis indicated that the Schumacher model underestimated growth in early ages. In contrast, the Gompertz model overestimated growth up to 1.5 m at 2 years of age. According to the estimated parameters (Table 6), the asymptotic values of the Schumacher, Levakovic II and Hossfeld IV models were higher than those the species can reach (up to 40 m) (Perry, 1991).
The Chapman-Richards model, which generated a more real asymptotic value, was selected for construction of the site index curves, and growth estimations were compared with the ADA and GADA approaches.
Dynamic equations
The ADA projection models in their anamorphic and polymorphic expressions had excellent fit (Table 7), and their parameters were significant (p ≤ 0.0001) (Table 8). The exception was the Schumacher model. The polymorphic models derived from Chapman-Richards (b 2 ), Levakovic II (b 2 ) and Hossfeld IV (b 1 ) were outstanding for their higher value of the adjusted coefficient of determination (R2-adj) and for explaining approximately 99 % of the total variability. These models had lower SCE and CME values. The Chapman-Richard model b 2 and Hossfeld IV model b 1 had lower standard errors, as well as the most real asymptotic values observed. Thus, in this phase of the numerical analysis, the last two models were better than the others
Table 7 Statistics of goodness of fit of the prediction and projection models under ADA methodology.
| Predicción (HD1) | Proyección (HD2) | ||||||
|---|---|---|---|---|---|---|---|
| Modelo | SCE | CME | R2-adj | SCE | CME | R2-adj | |
| Schumacher Anamórfico | 8987.9 | 20.7813 | 0.7387 | 2154.2 | 4.9692 | 0.9362 | |
| Schumacher Polimórfico | 2919.7 | 6.7509 | 0.9151 | 2221.3 | 5.124 | 0.9342 | |
| Chapman-Richards anamórfico | 2454.9 | 5.6827 | 0.9286 | 475.2 | 1.0975 | 0.9859 | |
| Chapman-Richards Polimórfico b1 | 2447.1 | 5.6646 | 0.9288 | 397.5 | 0.9180 | 0.9882 | |
| Chapman-Richards Polimórfico b2 | 2447.5 | 5.6656 | 0.9288 | 352.2 | 0.8135 | 0.9896 | |
| Levakovic II Anamórfico | 2459.5 | 5.6932 | 0.9284 | 474.0 | 1.0946 | 0.9859 | |
| Levakovic II Polimórfico b1 | 2450.9 | 5.6735 | 0.9287 | 399.2 | 0.9218 | 0.9882 | |
| Levakovic II Polimórfico b2 | 2449.9 | 5.6710 | 0.9287 | 371.2 | 0.8573 | 0.9890 | |
| Hossfeld IV Anamórfico | 2455.3 | 5.6837 | 0.9285 | 475.5 | 1.0981 | 0.9859 | |
| Hossfeld IV Polimórfico b1 | 2447.1 | 5.6647 | 0.9288 | 398.4 | 0.9201 | 0.9882 | |
| Hossfeld IV Polimórfico b2 | 2450.3 | 5.6720 | 0.9287 | 500.9 | 1.1567 | 0.9851 | |
| Gompertz Anamórfico | 2550.2 | 5.9032 | 0.9258 | 600.5 | 1.3868 | 0.9822 | |
| Gompertz Polimórfico b1 | 2556.9 | 5.9187 | 0.9256 | 461.7 | 1.0662 | 0.9863 | |
| Gompertz Polimórfico b2 | 2524.7 | 5.8577 | 0.9258 | 674.6 | 1.5616 | 0.9798 | |
Table 8 Values of parameters estimated simultaneously for HD growth models by the ADA approach.
| Modelo | bi | Estimación | Error estándar | P > |t| |
|---|---|---|---|---|
| Schumacher anamórfico | b0 | 23.653 | 0.3434 | <0.0001 |
| b1 | 10.45587 | 0.1550 | <0.0001 | |
| Schumacher polimórfico | b0 | 36.9377 | 0.6447 | <0.0001 |
| b1 | 27.97976 | 0.7368 | <0.0001 | |
| Chapman-Richards anamórfico | b0 | 38.68393 | 1.4155 | <0.0001 |
| b1 | 0.021054 | 0.00138 | <0.0001 | |
| b2 | 1.390515 | 0.0410 | <0.0001 | |
| Chapman-Richards Polimórfico b1 | b0 | 38.00643 | 1.0392 | <0.0001 |
| b1 | 0.022102 | 0.00117 | <0.0001 | |
| b2 | 1.437551 | 0.0401 | <0.0001 | |
| Chapman-Richards Polimórfico b2 | b0 | 39.22716 | 1.1530 | <0.0001 |
| b1 | 0.020946 | 0.00128 | <0.0001 | |
| b2 | 1.414433 | 0.0498 | <0.0001 | |
| Levakovic II Anamórfico | b0 | 63.94109 | 2.9284 | <0.0001 |
| b1 | 52.83666 | 5.7550 | <0.0001 | |
| b2 | 1.529662 | 0.0626 | <0.0001 | |
| Levakovic II Polimórfico b1 | b0 | 61.98111 | 2.2948 | <0.0001 |
| b1 | 46.82683 | 4.4259 | <0.0001 | |
| b2 | 1.621179 | 0.0646 | <0.0001 | |
| Levakovic II Polimórfico b2 | b0 | 63.458 | 2.5390 | <0.0001 |
| b1 | 49.42909 | 5.4951 | <0.0001 | |
| b2 | 1.59386 | 0.0785 | <0.0001 | |
| Hossfeld IV Anamórfico | b0 | 49.91392 | 2.5091 | <0.0001 |
| b1 | 5.625445 | 0.0718 | <0.0001 | |
| b2 | 1.362065 | 0.0337 | <0.0001 | |
| Hossfeld IV Polimórfico b1 | b0 | 47.85916 | 1.8841 | <0.0001 |
| b1 | 5.721145 | 0.0785 | <0.0001 | |
| b2 | 1.406078 | 0.0325 | <0.0001 | |
| Hossfeld IV Polimórfico b2 | b0 | 46.82266 | 1.7840 | <0.0001 |
| b1 | 5.708496 | 0.0622 | <0.0001 | |
| b2 | 1.413273 | 0.0271 | <0.0001 | |
| Gompertz Anamórfico | b0 | 29.96692 | 0.5068 | <0.0001 |
| b1 | -3.26372 | 0.0683 | <0.0001 | |
| b2 | -0.0462 | 0.00124 | <0.0001 | |
| Gompertz Polimórfico b1 | b0 | 31.0351 | 0.4086 | <0.0001 |
| b1 | -3.28957 | 0.0859 | <0.0001 | |
| b2 | -0.04436 | 0.00115 | <0.0001 | |
| Gompertz Polimórfico b2 | b0 | 30.20798 | 0.3979 | <0.0001 |
| b1 | -3.4001 | 0.0628 | <0.0001 | |
| b2 | -0.04679 | 0.00107 | <0.0001 |
According to the Student t test, the parameters of all the fitted models were statistically significant, with p ≤ 0.0001, lower than the critical value (α = 0.05). Thus, any value lower than this limit represented a rejection of H0. The graphic analysis verified the results of the fit by showing the dynamic trend for P. ayacahuite (Figure 1).
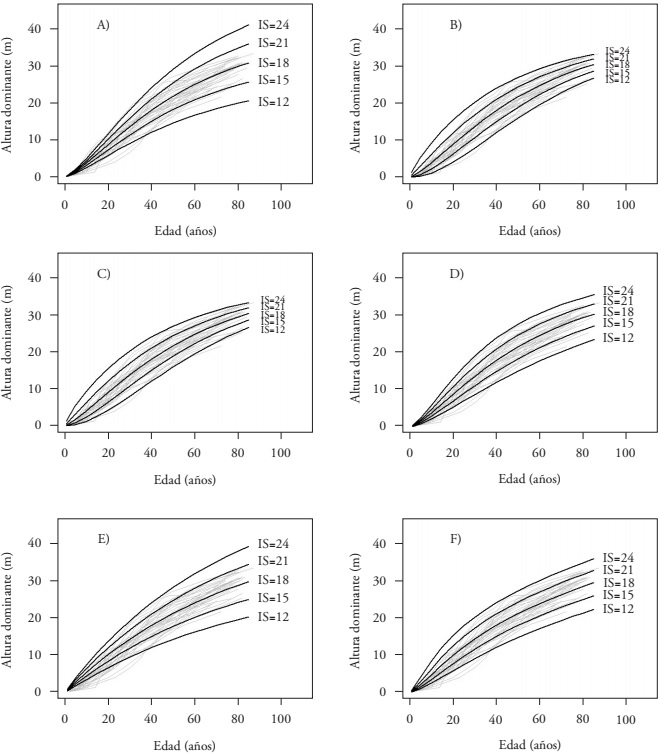
Figure 1 Families of site index curves for Pinus ayacahuite at 40 years base age. A) and B): by the guide curve method, anamorphic expression (b 0 ) and Chapman-Richards polymorphic b 2 . C) and D): ADA-type dynamic growth curves, polymorphic Chapman-Richards b 2 model and Hossfeld IV polymorphic b 1 . E) and F): GADA-type dynamic growth curves of the Chapman-Richards and Hossfeld models, respectively.
For the derivation of the GADA structures, the Chapman-Richards and Hossfeld IV models (Table 9), which have been widely used for modeling forest growth (Diéguez et al., 2006; Vargas et al., 2013; Tamarit et al., 2014; Quiñonez et al., 2015), were considered.
Table 9 Statistics of goodness of fit and estimated parameters of the GADA models.
| Modelo | SCE | CME | RECM | R2-adj | Estimación | Error estándar | P > |t| | |
|---|---|---|---|---|---|---|---|---|
| Chapman-Richards | 353.6 | 0.9741 | 0.9870 | 0.9853 | b0 | 0.01255 | 0.00216 | <0.0001 |
| b1 | -0.83462 | 0.0384 | <0.0001 | |||||
| b2 | -0.29716 | 0.0809 | 0.0003 | |||||
| Hossfeld IV | 372.6 | 0.8645 | 0.9298 | 0.9889 | b0 | 33.00662 | 3.3777 | <0.0001 |
| b1 | 0.026752 | 0.00784 | 0.0007 | |||||
| b2 | -1.42868 | 0.0462 | <0.0001 | |||||
SCE: sum of square errors; CME: mean squared error; RECM: root mean squared error; R2: coefficient of determination; R2-adj: adjusted R2 statistic; bi: value of estimated parameters.
R2-adj of the two models explained more than 98 % of the total variance. The values of SCE and CME were low, like those of the selected ADA models, and RECM had plausible values for both equations. All the estimations of the parameters were significant (p ( 0.01), and there were no major differences between the two adjusted models. The curves were compared to evaluate the performance of the models with GADA structure (Figure 1).
Families of site index curves for Pinus ayacahuite
From 12, 15, 18, 21 and 24 m to the base age of 40 years of the best models, the IS curves constructed from the models of similar fit followed different growth patterns (Figure 1A - F). Different models can have the same goodness of fit statistics or of comparison but different response (some underestimate in the early ages and overestimate with advanced ages and vice versa) (Diéguez et al. 2006).
The superimposed trajectories of the IS data observed in a family of curves, in this case of the anamorphic type of the Chapman-Richards model, showed that the dominant height growth pattern of P. ayacahuite follows different trends as a reflection of polymorphism (Figure 1A). In this respect, Corral et al. (2004) point out that anamorphic functions are generally not the most adequate for representing dominant height growth because the curve shapes vary among sites. Therefore, dominant height growth is actually polymorphic. For this reason, anamorphic structure was ruled out for describing dominant height growth.
Moreover, larger discrepancies are observed at early ages. In this respect, Huang (1999)) suggested that erratic height growth at young ages is due to young trees’ reaction to abnormal climatic extremes that can affect their total height, which is frequently determined by factors different from site quality.
The polymorphic b 2 derivation of Chapman-Richards and b 1 of Hossfeld IV were robust in the ADA models, according to the goodness of fit indicators and the significance of the estimated parameters (Tables 7 and 8). The graphic results (Figure 1C and D) show that both models satisfactorily group real observed data of all site qualities. Nevertheless, the model derived from Chapman-Richards grouped the data on early ages better than the Hossfeld IV model. Therefore, the Chapman-Richards polymorphic b 2 structure was superior to the Hossfeld IV b 1 derivation for predicting dominant height growth. The latter model was similar to that of Hossfeld IV, selected with the GADA methodology, which had adequate goodness of fit and graphic performance. In this way, the two specified ADA models were selected.
The numerical analysis of the models derived from Chapman-Richards and Hossfeld IV with the GADA formulation did not show major differences. However, the Hossfeld IV model was more realistic in the graphic result because it generated predictions with trends similar to the observed profiles. For sites of better quality, the Chapman-Richards overestimated growth; the opposite occurred in low quality sites (Figure 1E). For this reason, we concluded that to predict dominant height growth of P. ayacahuite with GADA structure, the model derived from Hossfeld IV is adequate. Consequently, to compare growth and productivity estimations of P. ayacahuite stands with the three methodologies, the selection is the following: Chapman-Richards polymorphic b 2 model with the guide curve, Chapman-Richards polymorphic b 2 and Hossfeld IV b 1 in ADA and Hossfeld IV in GADA.
The Chapman-Richards and Hossfeld IV models are widely used to model forest growth by the guide curve method and their versions of algebraic difference and generalized algebraic difference approaches. As examples for the Chapman-Richards model, Diéguez et al. (2006) constructed dynamic growth curves for Pinus tadea L. in the USA, and Vargas et al. (2010) studied Pinus cooperi Blanco in Durango, Mexico, with the compared models and derivations of Korf and Hossfeld IV. In addition, Quiñonez et al. (2015) developed a GADA expression to compare it with the structure derived by Kumland and Eng (2005) in forests of Durango.
Gómez et al. (2009) exemplified the Hossfeld IV model to describe dominant height in plantations of E. grandis Hill ex Maiden and E. urophylla S. T. Blake, in Oaxaca, and De los Santos et al. (2006) evaluated growth in plantations of Terminalia amazonia (Gmel.) Excell in two regions of Costa Rica. Santiago et al. (2013) investigated the construction of a compatible system of growth and yield for even-aged stands of Pinus patula Schl. et Cham.
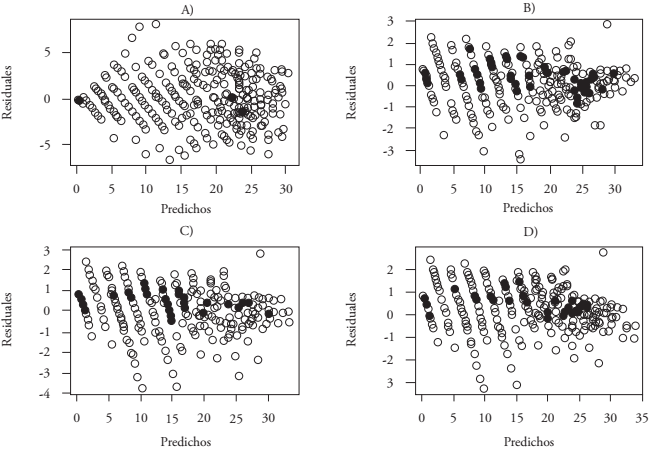
Graphs of the residuals for the models selected with the three methodologies are presented in Figure 2. We can see that in the ADA and GADA dynamic models, the dispersion of the residuals was less (-4 to 3 m), relative to the model selected with the guide curve (-6 to 8 m). Moreover, the latter model showed a slight funnel-shape tendency at early ages; the distribution of the residuals of the other models did not exhibit heteroscedasticity and showed a random pattern of the residuals around the reference line (line zero). This is due to the nature of the data used in the ADA and GADA dynamic equations, which enabled simultaneous fit and comparison of the change rates. For this reason, the studies conducted for construction of site index curves were developed with the methodology of the equations in algebraic differences or in its generalized form (Castillo et al., 2013; Vargas et al., 2013; Quiñonez et al., 2015).
Conclusions
The Chapman-Richards polymorphic b2 models in guide curve, the Chapman-Richards polymorphic b2, the Hossfeld IV b1 model in algebraic difference and the Hossfeld IV model in generalized algebraic difference are suitable options for predicting dominant height growth of P. ayacahuite. With these models, timber productivity can be quantified. The Chapman-Richards polymorphic b2 model in algebraic difference is recommended to determine the site index and select appropriate management regimes for P. ayacahuite stands of the Ixtlán de Juárez forest, Oaxaca, given its predictive capacity, graphic behavior, and ease of implementation.
Literatura Citada
Bailey, R. L., and J. L. Clutter. 1974. Base-age invariant polymorphic site curves. Forest Sci. 20: 155-159. [ Links ]
Castillo, L. A., B. Vargas L, J. J. Corral R., J. A. Nájera L., F. Cruz C., y F Javier H. 2013. Modelo compatible altura-índice de sitio para cuatro especies de pino en Santiago Papasquiaro, Durango. Rev. Mex. Cienc. For. 18: 89-103. [ Links ]
Cieszewski, C. J. 2001. Three methods of deriving advanced dynamic site equations demonstrated on inland Douglas-fir site curves. Can. J. Forest Res. 31: 165-173. [ Links ]
Cieszewski, C. J. 2002. Comparing fixed- and variable-base-age site equations having single versus multiple asymptotes. Forest Sci. 48: 7-23. [ Links ]
Cieszewski, C. J. 2003. Developing a well-behaved dynamic site equation using a modified Hossfeld IV function Y3 = (axm)/(c + xm-1), a simplified mixed-model and scant subalpine fir data. Forest Sci. 49: 539-554. [ Links ]
Cieszewski, C. J., and R. L. Bailey. 2000. Generalized algebraic difference approach: theory based derivation of dynamic equations with polymorphism and variable asymptotes. Forest Sci. 46: 116-126. [ Links ]
Clutter, J. L., J. C. Forston, L. V. Pienaar, G. H. Brister, and R. L. Bailey. 1983. Timber Management: A Quantitative Approach. John Wiley & Sons, Inc. New York. 333 p. [ Links ]
Corral R., J. J., J. G. Álvarez G., A. D. Ruíz G., and K. V. Gadow. 2004. Compatible height and site index models for five pine species in El Salto, Durango (México). Forest Ecol. Manag. 201: 145-160. [ Links ]
Daniel, T. W., J. A. Helms., and F. S. Baker. 1979. Principles of Silviculture. 2nd Ed. McGraw-Hill. New York. 500 p. [ Links ]
De los Santos P., H. M., M. Montero M., y M. Markku. 2006. Curvas dinámicas de crecimiento en altura dominante para Terminalia amazonia (Gmel.) Excell en Costa Rica. Agrociencia 40: 521-532. [ Links ]
Diéguez A., U., J. G. Álvarez G., M. Barrio A., and A. Rojo A. 2005. Site quality equations for Pinus sylvestris L. plantations in Galicia (north-west Spain). Ann. Forest Sci. 62: 143-152. [ Links ]
Diéguez A., U., H. E. Burkhart, and R. L. Amateis. 2006. Dynamic site model for loblolly pine (Pinus taeda L.) plantations in the United States. Forest Sci. 52: 262-272. [ Links ]
Gadow, K. V., S. Sánchez O., y J. G. Álvarez G. 2007. Estructura y Crecimiento del Bosque. Universidad de Göttingen, Alemania. 287 p. [ Links ]
García, C. X., H. Ramírez M., C. Rodríguez F., J Jasso M., y C. A. Ortiz S. 1998. Índice de sitio para caoba (Swietenia macrophylla King) en Quintana Roo, México. Rev. Ciencia For. Méx. 23: 9-19. [ Links ]
Gómez T., J., H. M. de los Santos P., A. M. Fierros G., y J. R. Valdez L. 2009. Modelos de crecimiento en altura dominante para Eucalyptus grandis Hill ex Maiden y E. urophylla S. T. Blake en Oaxaca, México. Rev. Fitotec. Mex. 32: 161-169. [ Links ]
Gompertz, B. 1825. On the nature of the function expressive of the law of human mortality, and on a new mode of determining the value of life contingencies. Philos. T. Roy. Soc. 115: 513-585. [ Links ]
Hossfeld, J. W. 1822. Mathematik für Forstmänner, Ökonomen und Cameralisten. Gotha, 4. Bd., S. 310. [ Links ]
Huang, S. 1999. Development of compatible height and site index models for young and mature stands within an ecosystem based management framework. In: Amaro, A., and M. Tomé (eds). Empirical and Process-based Models for Forest Tree and Stand Growth Simulation, Ediçoes Salamandra-Novas Tecnologias. Lisbon. pp: 61-98. [ Links ]
Infante G., S., y G. P. Zárate de L. 2012. Métodos Estadísticos: Un Enfoque Interdisciplinario. 3a ed. Ed. La Gaya Ciencia, Colegio de Postgraduados. México. 624 p. [ Links ]
Ivancich, H., G. Martínez P., y P. Peri. 2011. Modelos forzados y no forzados para el cálculo del índice de sitio en bosques de Nothofagus antarctica en Patagonia Sur. Bosque 32: 135-145. [ Links ]
Krumland, B., and H. Eng. 2005. Site index systems for major young-growth forest and woodland species in northern California. California. Department of Forestry & Fire Protection. Forestry Report No. 4. 272 p. [ Links ]
Levakovic, A. 1935. An analytical form of growth law. Glasnik za sumske pokuse. Zagreb 4: 189-282. (In Serbo-Croat). [ Links ]
Magaña T., O. S., J. M. Torres R., C. Rodríguez F., H. Aguirre D., y A. M. Fierros G. 2008. Predicción de la producción y rendimiento de Pinus rudis Endl., en Aloapan, Oaxaca. Madera Bosques 14: 5-19. [ Links ]
Mendoza B., M. A. 1993. Conceptos Básicos de Manejo Forestal. UTEHA NORIEGA Eds. México. 161 p. [ Links ]
Perry Jr., J. P. 1991. The Pines of Mexico and Central America. Timber Press. Portland. 231 p. [ Links ]
Quiñonez B., G., H. M. de los Santos P., F. Cruz C., A. Velázquez M., G. Ángeles P., y G. Ramírez V. 2015. Índice de sitio con polimorfismo complejo para masas forestales de Durango, México. Agrociencia 49: 439-454. [ Links ]
R Development Core Team. 2015. R: language and environment for statistical computing. R Foundation for Statistical Computing, Vienna, Austria. ISBN URL<http://www.R-project.org>. [ Links ]
Richards, F. J. 1959. A flexible growth function for empirical use. J. Exp. Bot. 10: 290-300. [ Links ]
Santiago G., W., H. M. de los Santos P., G. Ángeles P., J. R. Valdez L., y G. Ramírez V. 2013. Sistema compatible de crecimiento y rendimiento para rodales coetáneos de Pinus patula. Rev. Fitotec. Mex. 36: 163-172. [ Links ]
SAS Institute Inc. 2002. SAS/ETS® 9.0 User's Guide. SAS Institute Inc. Cary, NC. [ Links ]
Schumacher, F. X. 1939. A new growth function curve and its application to timber-yield studies. J. Forestry 37: 819-820. [ Links ]
Tamarit U., J. C., H. M. de los Santos P., A. Aldrete., J. R. Valdez L., H. Ramírez M., y V. Guerra de la C. 2014. Ecuaciones dinámicas de índice de sitio para Tectona grandis en Campeche, México. Agrociencia 48: 225-238. [ Links ]
Vargas L., B., J. G. Álvarez G., J. J. Corral R., y O. A. Aguirre C. 2010. Construcción de curvas dinámicas de índice de sitio para Pinus cooperi Blanco. Rev. Fitotec. Mex. 33: 343-351. [ Links ]
Vargas L., B., O. A. Aguirre C., J. J. Corral R., F. Crecente C., y U. Diéguez A. 2013. Modelo de crecimiento en altura dominante e índice de sitio para Pinus pseudostrobus Lindl. en el noreste de México. Agrociencia 47: 91-106. [ Links ]
Received: August 2016; Accepted: April 2017
 Este es un artículo publicado en acceso abierto bajo una licencia Creative Commons
