


Servicios Personalizados
Revista
Articulo
 Inglés (pdf)
 Artículo en XML
 Referencias del artículo
 Enviar artículo por email
Indicadores
-
 Citado por SciELO
 -
 Accesos
Links relacionados
-
 Similares en
SciELO
Similares en
SciELO
Compartir

 Permalink
Hidrobiológica
versión impresa ISSN 0188-8897
Hidrobiológica vol.24 no.3 Ciudad de México sep./dic. 2014
Artículos
Phytoplankton size-fractionated chlorophyll-a off Baja California during winter, spring, and summer 2008
Clorofila-a del fitoplancton separado por fracciones de tamaño frente a Baja California durante invierno, primavera y verano de 2008
Víctor M. Martinez-Almeida,1 Gilberto Gaxiola-Castro,2 Reginaldo Durazo,3 and J. Rubén Lara-Lara2
1 Postdoctoral CONACYT fellowship. Departamento de Oceanografía Biológica, CICESE. Carretera Ensenada Tijuana No. 3918. Zona Playitas. C.P. 22860. Ensenada, Baja California, México.
2 División de Oceanología. Departamento de Oceanografía Biológica, CICESE. Carretera Ensenada Tijuana No. 3918. Zona Playitas. C.P. 22860. Ensenada, Baja California, México.
3 Facultad de Ciencias Marinas. Universidad Autónoma de Baja California. Kilómetro 103 Carretera Tijuana-Ensenada. Ensenada, Baja California, México. e-mail: ggaxiola@cicese.mx.
Recibido: 29 de abril 2012.
Aceptado: 26 de noviembre 2013.
ABSTRACT
Spatial and temporal size-fractionated phytoplankton chlorophyll-a (Chl-a) variability as pico-nanoplankton (PN, 0.48.0 urn) and nano-microplankton (NM, >8.0 urn) off Baja California is shown. Chl-a samples from the upper 200 m were obtained from nearshore, offshore, and intermediate locations during winter, spring, and summer 2008. PN-Chl-a contribution to phytoplankton biomass was ~4 times higher than NM fraction. Chl-a PN/NM ratio increased toward offshore, while total Chl-a (PN + NM) decreased. Seasonally, offshore phytoplankton cells abundance had a comparable contribution for both size-fractions, without an apparent change by the integrated water-column total Chl-a (60 mg m-2). Vertical Chl-a profiles were similar for winter and summer seasons. The highest Chl-a concentration and phytoplankton-cells abundance arose in spring, predominantly for NM at nearshore locations, reaching from 2.7-fold (nearshore: middle) to 4.2-fold (middle: offshore) ratios. Phytoplankton Chl-a increased from winter to spring (5.4 times), with maximum contribution of NM (6.6 times) at nearshore zones. Water-column integrated phytoplankton abundance was 5-fold higher in spring than winter, and 2-fold over summer. Using optical microscopy, dinoflagellate cells were the most abundant and variable phytoplankton recognizable group at intermediate zone. Smaller phytoplankton cells sustained approximately continuous biomass off Baja California. The spatial and temporal phytoplankton biomass variability was mainly influenced by an increase of larger cells as result of spring coastal upwelling events.
Keywords: Chlorophyll-a, IMECOCAL Program, phytoplankton-size structure, southern California Current.
RESUMEN
Se presenta la variabilidad espacio-temporal de Clorofila-a (Cl-a) en muestras de fitoplancton separadas por tamaño celular: pico-nanoplancton (PN, 0.4-8.0 μm) y nano-microplancton (NM> 8.0 μm) frente a Baja California. Las muestras, obtenidas de la parte superior de la columna (200 m) fueron recolectadas en estaciones costeras, oceánicas e intermedias durante invierno, primavera y verano de 2008. La contribución del PN a la biomasa del fitoplancton fue ~4 veces mayor que la fracción del NM. La proporción de Cl-a PN/NM aumenta hacia fuera de la costa, mientras que la Cl-a total (PN + NM) disminuye. Estacionalmente, el fitoplancton en la región oceánica tuvo una contribución similar en ambas fracciones de tamaño, con valores aproximadamente constantes en la Cl-a total integrada (60 mg m-2). Los perfiles verticales de Cl-a fueron similares en invierno y verano. La mayor concentración de clorofila-a y abundancia fitoplanctónica se obtuvo en primavera, principalmente derivada de la fracción NM en zonas costeras, alcanzando cocientes desde 2.7 veces (estaciones costeras: intermedias) hasta 4.2 veces (intermedias: oceánicas). La Cl-a incrementó 5.4 veces de invierno a primavera, siendo máxima (6.6 veces) en el NM de la región costera. La abundancia del fitoplancton en primavera fue 5 veces mayor con relación al invierno y 2 veces más alta que el verano. Por medio del análisis con microscopio óptico, se identificó a los dinoflagelados como el grupo más abundante y variable en las estaciones de la zona intermedia. El fitoplancton más pequeño alcanzó una biomasa aproximadamente constante frente a Baja California. La variabilidad espacio-temporal de la biomasa del fitoplancton estuvo influida fundamentalmente por el incremento de la abundancia de las células de mayor tamaño como resultado de las surgencias costeras durante la primavera.
Palabras clave: Clorofila-a, estructura del fitoplancton por tamaños, programa IMECOCAL, sur de la Corriente de California.
INTRODUCTION
Phytoplankton cell size is an important ecological variable playing a critical role in the ocean community structure, primary production, and oceanic food web. The phytoplankton size structure has a strong influence on carbon transfer efficiency to higher trophic levels (Legendre & Le Fevre, 1989), and vertical transport of organic material to oceanic deeper waters and to the sediments (Bienfang et al., 1983). Water column stratification is related with nutrient limitation in the upper ocean layers and abundance of smaller size phytoplankton cells, while vertical mixing conditions are mostly associated with high nutrient concentration and abundance of large-phytoplankton cells (Daly & Smith, 1993). However, many factors appear to influence phytoplankton community size structure, including competitive interactions among phytoplank-ton taxa (Tilman, 1977), zooplankton grazing (Kerr & Dickie, 2001), cells sinking (Kiørboe, 1993), and physical aggregation (Stemmann et al., 2004).
Understanding the mechanisms controlling phytoplankton community size structure in response to environmental factors is essential in order to recognize the importance of temporal and spatial fluctuations in the ocean food web structure, understand biological pump regulation, and characterize the ocean response as a long-term sink of atmospheric carbon dioxide (Irwin et al., 2006). Finkel et al. (2010) have shown that phytoplankton cell size and elemental stoichiometry often respond to abiotic conditions and follow biophysical factors that link environmental conditions to growth rates, food web interactions, and ultimately ocean biogeochemical cycles. This suggests that cell size and elemental stoichiometry are promising ecophysiological traits for modeling and tracking changes in phytoplankton community structure in response to changes of environmental conditions, including climate change.
Phytoplankton size structure and its importance in the oceanic ecosystems were reconsidered after the detection of the widespread occurrence and diversity of tiny microalgae (0.2-2.0 μm-size), termed pico-phytoplankton (Stockner & Antia, 1986). Several authors have indicated that nano-phytoplankton cells (2-20 μm-size) also contribute significantly to phytoplankton biomass, and together with micro-phytoplankton (20-200 μm-size) and pico-phytoplankton build different mechanisms of energy and carbon flow in the oceanic environment (Iriarte et al., 2000; Linacre et al., 2012). In temperate and tropical ocean environments, nano-phytoplankton and pico-phytoplankton cells contribute >60% of the phytoplankton primary production and biomass, and up to 90% over some particular ocean conditions (Platt et al., 1983; Robles-Jarero & Lara-Lara, 1993; Maranon et al., 2001). Phyto-plankton smallest size classes, including coccoid cyanobacteria and pico-phytoplankton-sized algal cells, are considered to be the most abundant in open oceanic waters, whereas shallow coastal waters and more productive ecosystems at nearshore areas are usually characterized by cells in the nano-phytoplankton and micro-phytoplankton size classes (Li, 2002; Poulton et al., 2006; Linacre et al., 2012).
Monitoring chlorophyll-a (Chl-a) as an indirect, standardized and widely accepted approach to assess phytoplankton biomass has been very useful. Chl-a concentration is an indirect indicator of nutrient intensification or weakening in the ocean ecosystems, and it is related with hydrodynamic variability of the upper water column. Goericke (2011) proposes that phytoplankton community structure fluctuates predictably as a function of total Chl-a and that a balance between bottom-up and top-down pelagic ecosystem conditions is controlled by its assembly.
Spatial and temporal Chl-a total phytoplankton variability in the southern region of the California Current (CC) off Baja California is well recognized (Espinosa-Carreon et al., 2004; Gaxiola-Castro et al., 2008; Gaxiola-Castro et al., 2010). However, in spite of the importance of phytoplankton-size structure within the food web and its contribution to the biogeochemical cycles, the understanding of its spatial and seasonal distributions is still very restricted.
A great variability in the size composition of phytoplankton cells has been shown between transects perpendicular to the coast off Baja California during winter periods (Millan-Nunez & Millan-Nunez, 2010).
Since phytoplankton size-fractionated distribution is particularly a significant index of the plankton community attributes, the present study focuses on the description of the phytoplankton size based on both the Chl-a concentration at three seasons of the year 2008 and their distribution with depth in the IMECOCAL off Baja California region. We aim to answer the following specific questions: 1- How does phytoplankton size structure change spatially and temporally?; 2- How does phytoplankton size structure change with depth?; 3- What is the vertical distribution of size-fractionated Chl-a? Answers to these questions provide a baseline reference for future research related with regional and long-term assessment purposes.
This work is complemented by the quantification of the foremost phytoplankton taxonomic groups (>5 μm-size) analyzed under light microscope, which allowed us to distinguish and correlate cells abundance and Chl-a with changes in several environmental variables.
MATERIALS AND METHODS
Study area. The IMECOCAL (Spanish acronym for Mexican Investigations of the California Current) region west of the Baja California Peninsula is located in the southern section of the California Current (CC). The hydrography of the area is mainly characterized by an alongshore near-surface equatorward flow, carrying relatively cool and low-salinity water from the subarctic (Durazo et al., 2010). Also, there is a subsurface poleward current flowing along the edge of the continental slope, and local coastal upwelling events are driven by northwesterly winds during most of the year but with more intensity during spring and summer seasons. Subarctic water dominates during winter and spring seasons, while tropical and subtropical influences are commonly observed through late summer and autumn (Lynn & Simpson, 1987; Durazo et al., 2010).
The CC southern region is surveyed by IMECOCAL that has been monitoring the region off Baja California Peninsula since October 1997, following a subgrid of the CALCOFI (California Cooperative Oceanic Fisheries Investigations) program on the Mexican side. The whole IMECOCAL area is within the California Upwelling Coastal Province (Longhurst, 1998). Standard IMECOCAL surveys are carried out along perpendicular transects (lines) to the coast between lines 100 off Ensenada (31°40'N, 116°50'W) to 137 in the Gulf of Ulloa (25°01'N, 112°11'W) (Fig.1). The distance between transects is 74 km, and 37 km among stations. Additional information of the IMECOCAL surveys and methods are available at http://imecocal.cicese.mx/.
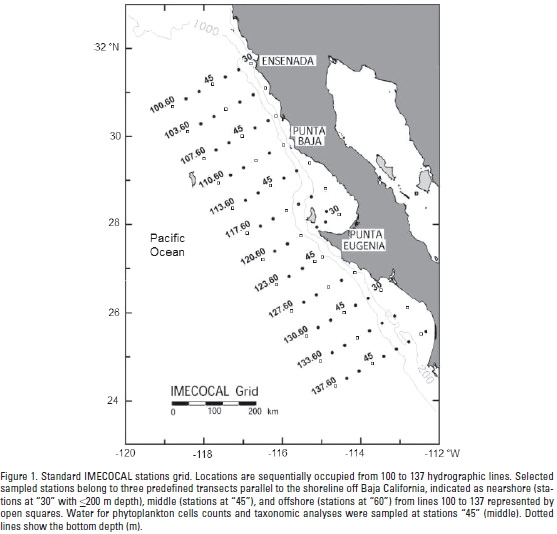
Data collection. On each station of the IMECOCAL grid, CTD (Sea-Bird SBE-911 plus) casts were carried out to obtain vertical profiles of salinity (conductivity), temperature, and depth (pressure) on board the CICESE R/V Francisco de Ulloa. During 2008 selected stations were sampled by three surveys: January 23 to February 12 (IM0801, winter, n=29 sampled stations), April 16 to May 2 (IM0804, spring, n=24), and July 14 to August 3 (IM0807, summer, n=37). For this work, sampled stations from lines 100 to 137 were distributed throughout three predefined transects parallel to the shoreline and are designated as: nearshore stations "30" with <200 m depth, n=10 (winter), n=11(spring) and n=13 (summer), middle stations "45", n=11 (winter), n=7 (spring) and n=12 (summer), and offshore stations "60", n=8 (winter), n=6 (spring) and n=12 (summer) (Fig. 1). During the spring survey, some stations were not visited due to rough seas.
Chl-a analyses. Phytoplankton biomass as Chl-a was determined at all selected stations and from seven levels of the upper 200 m depth (0, 10, 20, 50, 100, 150, 200 m) using 5-liter Niskin bottles coupled to a General Oceanics rosette. Water samples were passed simultaneously through a sequential filtration unit with 8 μm pore-size polycarbonate filters (PC, Nucleopore, 13 mm) and 0.4 μm pore-size filter. Usually the filtration procedure delay was less than 30 minutes and was performed under low light and low-vacuum pressure (<100 mm Hg). Filters were immediately frozen and stored in liquid nitrogen until analysis. Chl-a extraction was prepared with 10 ml of 90% acetone for ~24 hours in a refrigerator, and analyzed with a Trilogy Turner Designs Fluorometer (Model 7200-000) calibrated using pure Chl-a (Sigma-Aldrich Co.). Chl-a concentration (mg Chl-a m-3) was measured by the non-acidification method (module Chl-NA, model 046) following Welschmeyer's technique (Welschmeyer, 1994), which is selective for Chl-a and discriminates against chlorophyll-b and accessory pigments.
Chl-a from cells collected by 8.0 μm pore-size filters were categorized as nano-microplankton fraction (>8 μm, hereafter NM), whereas those passing through 8.0 μm filter and retained by 0.4 μm-pore filter (0.4-8 μm) were characterized as the pico-nanoplankton fraction (hereafter PN). Both pore-size filters are suggested as "standard" for the separation of chlorophyll in the IMECOCAL program. Total phytoplankton-Chl-a is considered by addition of the two size-fractionated Chl-a measurements (PN + NM).
Phytoplankton quantification and identification. For logistical reasons, samples for scope cell counting were taken only at locations of intermediate transects (stations 45 of the IMECOCAL grid; Fig. 1), with a total of 10, 7 and 10 samples in winter, spring, and summer, respectively. Sampling depths were performed from the upper 100 m water-column section (0, 10, 20, 50 and 100 m) which contains most of the phytoplankton biomass. Water samples (250 ml) were preserved with Lugol's solution to a final concentration of 3%. Samples were counted by placing 50 ml in a settling chamber for at least 24 hours and examined under an inverted compound microscope according to Utermbhl's technique (Utermb'hl, 1958). Individual organisms in the entire chamber were counted at 400x magnification, and identification was restricted to the recognized taxa or those with a distinguished morphology. Dinoflagellates, diatoms, and flagellates (including coccolithophorids) species were identified and categorized into their corresponding taxonomical group. Smallest taxa (cells size ca. ≤5 μm) were excluded in the analyses because of the lower magnification procedure for phytoplankton counts.
Data analyses. A basic statistical analysis for all variables obtained from the vertical profiles and along selected stations (nearshore, middle, and offshore) were calculated. Minima, maxima, and mean values provide insights into regional differences in terms of significant phytoplankton and biomass structure constituents. Standard trapezoidal integration method was utilized to calculate depth-integrated fractionated phytoplankton Chl-a concentration (mg m-2) and phytoplankton individuals (ind m-2) of the upper water column (see selected depths for each one). Seasonal and spatial differences among variables were verified using the nonparametric Kruskal-Wallis test. Relationships among hydrographic and biological variables were examined by the Spearman rank correlation analysis. Statistical analyses were performed using the Statgraphics Centurion XVI software, considering a significance level p < 0.05.
RESULTS
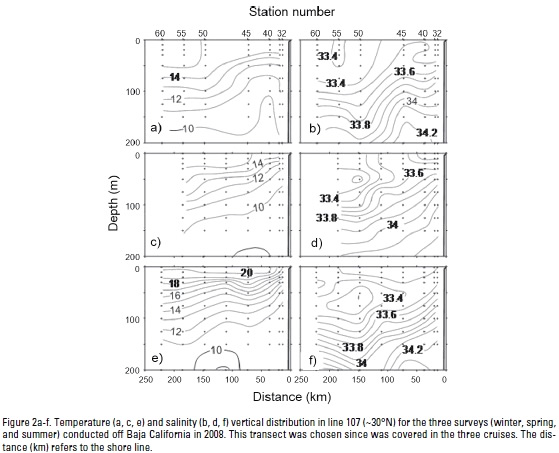
Hydrography. Upper layer (0-200 m) hydrographic conditions for the three cruises conducted in 2008, as seen in section 107 (~30°N), are depicted in Fig. 2. Section 107 was chosen since this transect was surveyed in the three cruises. Winter stratification is weak and the salinity minimum (33.4) indicated that the California Current (CC) core is at surface (Fig. 2a-b). Also, the small slope toward the coast of both temperature and salinity indicates weak or absent coastal upwelling in this season. For spring, the upper layer developed into larger sea surface temperatures (SST, 15 °C), with minimum values near the coast and stronger isothermal slopes indicating coastal upwelling (Fig. 2c). During this season, the CC core (S=33.2) is located offshore near 50 m depth (Fig. 2d). In summer, the CC core remained offshore at the same depth underneath higher salinity and temperature waters (Fig. 2e-f). The slope of near shore isotherms indicate coastal upwelling, although restricted to the first ~75 km from the coast. In all three seasons the downward slope of deeper isotherms (~200 m) near the coast indicates a narrow poleward flow, but they appear close to the coast in winter and wider and offshore during summer.
Upper layer hydrographic conditions also may be pictured in terms of the spatial distribution of properties. Here we have selected temperature and salinity spatial distributions at 50 m depth (Fig. 3), approximately the position of the salinity minimum during spring and summer as described above (Fig. 2b-c). For temperature distributions, we added arrowheads to contour lines as a proxy for near surface geostrophic flows, which are closely related to the actual 50 m geostrophic flows, computed using 500 dbar as the reference level (data not shown). Conditions during winter show a southward flow; the small coast offshore temperature gradients suggest a weak alongshore flow (Fig. 3a). Salinity is mostly uniform throughout the entire region, confirming the upper layer homogeneous conditions during this season. For spring there was a large spatial gap where no sampling was possible due to bad weather (Fig. 3b). Despite this, we note minimum (maximum) temperatures (salinities) at the coast, and larger coastal offshore temperature and salinity gradients indicating coastal upwelling, both in the northern and southern regions. Due to the development of vertical stratification, more meandering and mesoscale features can be clearly defined in these distributions (Fig. 2b), which were very well developed by summer (Fig. 3c) when coastal upwelling is also noticeable by the minimum temperature and maximum salinity near the coast.
Minima water-column temperature (upper 200 m depth) fluctuates from 8.5 °C in winter (offshore) to 10.1 °C in summer (nears-hore), with maxima between 17.2 °C in winter (middle stations) and 24.7 °C in summer (offshore stations). Water-column temperature profiles have shown a seasonal thermocline in the upper 200 m depth by spring and summer. The highest temperature difference (~10 °C) between surface and 200 m depth is observed in summer. Winter average temperature in near-surface waters (0-30 m) is almost the same (~16 °C) on all transects, with ~6 °C difference from surface to 200 m depth. During this season, temperature consistencies along transects (p=0.25) suggest that the Pacific Ocean off Baja California is a region with approximately similar winter hydrographic conditions. Temperature is significantly (p=0.0002) lowest at nearshore locations during spring in relation to winter and summer, indicating the increase of coastal upwelling events in the former season.
Salinity averages in the upper 200 m water-column depth range from 33.13 (offshore) to 34.75 (nearshore). Water column salinity shows a similar pattern to temperature, with less vertical variations and without differences between transects over seasons (p> 0.33). Temporal and spatial salinity variability is inversely correlated with temperature (Spearman r=-0.40). Both variables have a typical opposite vertical pattern, with higher values of salinity at nearshore surface locations during the spring upwelling season.
Pico-nanoplankton (PN) Chl-a. Average PN Chl-a concentrations in the water column are generally <1.0 mg m-3 (Fig. 4a-c), except during spring when a maxima concentration (4.99 mg m-3) is reached in the upper 20 m at nearshore locations (Table 1, Fig. 4b). Very similar PN Chl-a vertical profiles for all transects during winter and summer are noticeable (Fig. 4a, c). Seasonal and spatial minima and maxima of integrated water-column Chl-a PN fraction in the upper 200 m are summarized in Table 2. Temporally, subsurface Chl-a maximum (SCM) is distinguished in the upper 50 m, except during spring when it occurs gradually deeper from nearshore (10-20 m) to offshore stations (100 m). Apart from spring at nearshore and middle transects (Fig. 4b, Fig. 5), PN Chl-a fraction generally contributes with >50% to the Chl-a values. There are no temporal differences between seasons at nearshore (p=0.286) and between offshore transects (p=0.054) (Fig. 5a). PN Chl-a on nearshore transects have a 1.8-fold increase in spring relative to summer (p=0.035) (Table 3). Considering an average for the entire study area, the lowest mean values of PN fraction difference (< 1) occurs between summer and winter (Table 3).
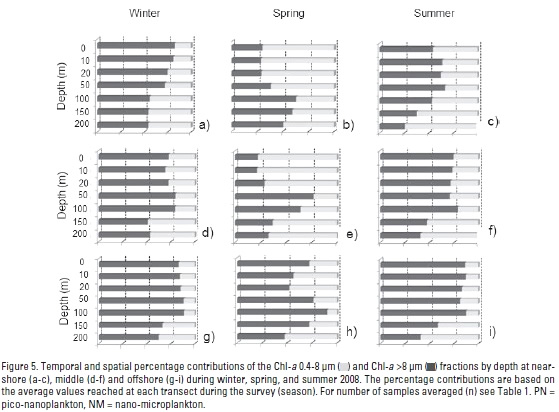
Nano-microplankton (NM) Chl-a fraction. Nano-microplankton seasonal average Chl-a concentrations in the water column was generally <0.5 mg m-3 (Fig. 4d-f). Chl-a vertical profiles show a very similar pattern in winter and summer (Fig. 4d, f) with the mean highest concentration (3.8 mg m-3) in the upper 20 m during spring at a nearshore station (Fig. 4e). NM Chl-a concentrations significantly increase during spring, in particular at nearshore (shallower than 50 m depth) and middle locations (20 m depth) (Fig. 4e), thus contributing with >50% of total Chl-a by depth (Fig. 5b, e). A conspicuous subsurface Chl-a maximum (SCM) was observed at 20 m depth, except for the summer middle stations when it occurred at 50 m (Fig. 4f). Water-column integrated Chl-a was maximum in spring nearshore locations (Fig. 6b). Moreover, Chl-a by middle and offshore zones was significantly similar between seasons (p> 0.485) and without differences between transects (p=0.139) in winter. However, during spring (p=0.013) and summer (p=0.0002) NM Chl-a fraction at nearshore locations was higher than for middle and offshore locations. As an average for the entire study area, the NM Chl-a largest increase arose from winter to spring (5.4 times), with a main contribution (6.6) by nearshore zones followed by the middle transect with 3.4 times increase (Tables 2-3).
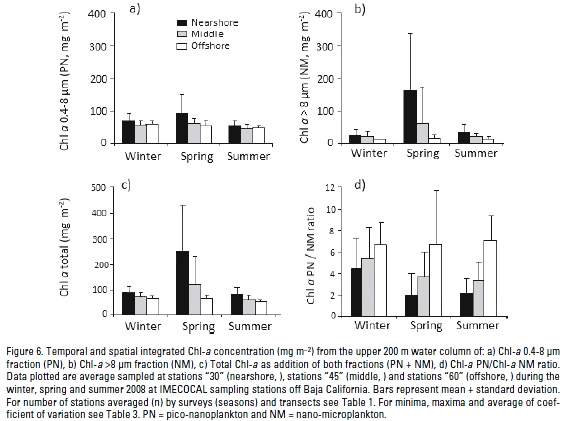
Total Phytoplankton Chl-a biomass. Maxima concentrations of both size-fractionated phytoplankton Chl-a (NM + PN) were from 1.37 mg m-3 in summer (offshore stations) to 14.94 mg m-3 during spring (nearshore stations) (Table 1). Chl-a vertical profiles show a very similar pattern in winter and summer (Fig. 4g,i), with the mean highest concentration (5.2 mg m-3) in the upper 20 m during spring in a nearshore station (Fig. 4h). Spatial and temporal minima and maxima for integrated total Chl-a in the upper 200 m are summarized in Table 2. Temporally, total Chl-a concentration at nearshore locations was higher in spring (p=0.04). For winter, no significant differences between transects (p=0.074) and between periods for the middle transect (p=0.143) were observed. In summer, there was a slightly higher Chl-a concentration near-shore in relation with offshore locations (p=0.01). Spatially, the averaged integrated Chl-a decreased towards offshore, where a very similar temporal value (~60 mg Chl-a m-2) for this zone was achieved (Table 2 and Fig. 6c). Averaged total Chl-a increase for the entire study area from winter to spring was 2.2-fold (Table 3), with the greatest change on nearshore positions (2.8 times).
Chl-a (PN/NM) ratio. Average Chl-a phytoplankton PN/NM ratio in the upper water-column ranged from 2 to 8 (i.e. pico-nanoplankton cells exceed nano-microplankton) particularly at offshore stations (Fig. 4j-l). Regional and temporal variability of minima and maxima integrated Chl-a PN/NM ratios are summarized in Table 2. For the complete area, highest variability is reached in spring (C.V. 96%) mainly at nearshore zones. Seasonally, there is a nearshore reduced Chl-a PN/NM ratio during spring rather than in winter (p=0.03). Comparing middle and offshore transects, the amounts of both fractions remain similar (> p=0.251) and spatially related in winter (p=0.351). During spring and summer, PN/NM ratios at nearshore regions are <2, lower than those near middle and offshore positions (< p=0.03; Fig. 4k, l). There is a major contribution of the PN fraction (PN>NM) towards offshore positions. The PN/NM Chl-a ratio tends to be higher at depths lower than 100 m (Fig. 4j-l), with the highest ratios (~9-fold) in spring and offshore stations (Fig. 4k). This pattern is very similar for all locations and surveys (Fig. 6d).
Vertical Chl-a distribution. Subsurface Chl-a maximum (SCM) was a noticeable structure in our study (Fig. 4). Averaged chlorophyll maximum in both phytoplankton fractions was shallower (~10-20 m depth) at nearshore locations and deeper (50-100 m) offshore, with lower concentrations particularly in PN through the spring season (Fig. 4b). During winter and summer, NM Chl-a fraction showed a vertical homogenous distribution (Fig. 4d and f). However, an evident Chl-a increase was distinguished between 10-20 m depth at nearshore and middle stations during the spring upwelling season (Fig. 4e). Averaged water-column PN/NM ratios ranged from two to eight except in spring and summer nearshore stations. These values indicate the highest PN fraction contribution throughout the water column (Fig. 4j-l), with its lowest influence in coastal areas.
Phytoplankton abundance. Total phytoplankton abundance (cells >5 μm) in the upper 100 m ranged from 1.1 x 10⁶ ind m-3 in winter to 194.3 x 10⁶ ind m-3 in spring (Table 1). Maximum phytoplankton cell abundances were observed generally in the upper 50 m layer (Fig. 7a-c). A phytoplankton increase up to 39 x 106 ind m-3 was detected during spring in the upper 50 m related to winter and summer seasons (Fig. 7a-c). In spring, averaged water-column integrated phytoplankton was nearly 5-fold higher than winter and 2-fold higher than summer (Table 4, Fig. 7d).
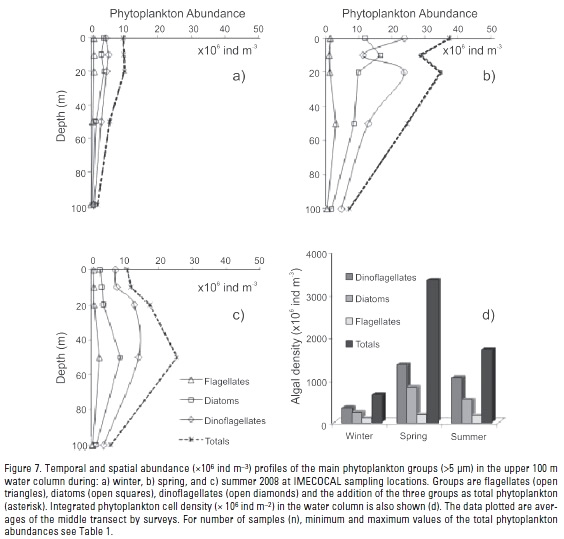
Abundance and species richness (data not shown) of Dinophyceae (Heterocapsa ssp., Prorocentrum ssp., Ceratium spp.) and Bacillariophyceae (Pseudo-nitszchia spp., Chaetocerus ssp., Rhizosolenia spp.) dominated the phytoplankton community. Dinoflagellates were the most abundant cells (Fig. 7d), representing >50% of total phytoplankton for each period, and reaching 64% by summer. Diatoms contributed with 28%, 37%, and 35% of the total phytoplankton abundance during summer, winter, and spring, respectively. Dinoflagellates and diatoms have shown a similar vertical pattern during winter (Fig. 7a and c). Integrated water-column dinoflagellate abundance was four times higher in spring than winter, and 1.3 times higher than summer (Table 4). Seasonally, the highest increase of dinoflagellates/diatoms ratio was 1.34 reached from winter to summer.
Relationships between variables. Using the Spearman's rank correlation analysis in the water column, significant positive relationships (p< 0.05) are recognized between water-column temperature and Chl-a phytoplankton fractions (PN and NM) (r=0.32 to r = 0.71) and with total Chl-a (r=0.65 to r=0.99). Inverse correlations (r=-0.23 to r=-0.76) between Chl-a in both phyto-plankton fractions and salinity are observed. In spring and summer water temperature is not significantly correlated with the NM fraction (p> 0.05), but it is positively correlated (r=0.43 to r=0.60) with the PN fraction through all sampled periods. During spring, dependence of phytoplankton Chl-a fraction on salinity variability is only significant at nearshore locations, without correlation of the NM fraction for the middle and offshore transects. Total Chl-a concentration has higher correlation with the PN fraction, except at nearshore zones during spring season. Dinoflagellates and diatoms cell abundances show positive and significant correlations with Chl-a fraction >8 pm (dinoflagellates, r=0.76, n=100; and diatoms, r=0.93, n=100).
DISCUSSION
Seawater temperature changes seasonally and spatially from surface to 200 m depth, with higher values in summer when a stronger stratifications is characteristic in the upper 100 m depth (Fig. 2a, c and e; Fig. 3a-c). In contrast, lower temperature and more saline waters occur nearshore in spring (Fig. 2c), indicating coastal upwelling episodes (Fig. 3b). Coastal upwelling events off Baja California appear to be associated with the predominant northwesterly winds (>8 m s-1; data not shown) mostly occurring during spring and summer seasons (Barton & Argote, 1980; Durazo etal., 2010). The concomitant offshore Ekman transport brings to the surface deeper and colder (more saline) waters near the coast (Figs. 2, 3). Thus, hydrographic variability during seasons influences the phytoplankton biomass water column distribution, with a typical decrease in Chl-a from nearshore to offshore zones and PN fraction dominating offshore (Tables 1 and 2; Fig. 6d).
During spring, phytoplankton <8 μm (PN) Chl-a was the prevailing fraction (>50%) throughout the water column in all but the nearshore and middle transects, where cells >8 pm fraction (NM) were dominant. Seasonal and interannual Chl-a IMECOCAL patterns indicated that spring Chl-a maximum is the result of phyto-plankton growth in response to upwelling-favorable northwesterly winds (Gaxiola-Castro et al., 2008).
Phytoplankton PN fraction contributed >4-fold over NM to water-column integrated Chl-a (Fig. 6), although the latter fraction is likely more important with depth in most of the sampling locations (Fig. 5). During spring coastal upwelling episodes, total integrated Chl-a is larger nearshore (Fig. 6c) because of the increase in phytoplankton cells abundance (Fig. 7), mainly the NM fraction (Fig. 6b). Nevertheless, Chl-a PN biomass is always higher at nearshore areas, and it increases through spring (Fig. 6a) as result of its higher growth rate (Linacre et al., 2012). In general, both Chl-a fractions showed a decrease from nearshore to offshore locations, which is more evident for the NM fraction (Figs. 6a and b). In the offshore zone phytoplankton biomass has a comparable contribution from both size-fractions, leaving/making total integrated Chl-a (~ 60 mg m-2) almost constant. This value can be considered as a threshold for the open ocean waters of the study area.
The main factors regulating phytoplankton size structure under different trophic conditions are still under consideration (Sherr et al., 2005; Irwin et al. 2006; Echevarría et al., 2009). Although small-sized phytoplankton cells are considered as characteristic of oligotrophic open-ocean systems (Li, 2002), they have been reported to be also abundant in coastal upwelling ecosystems (Montecino & Quiroz, 2000; Worden et al., 2004; Sherr et al., 2005; Linacre et al., 2012). The dominance of PN over NM fractions in a northern Baja California coastal location (González-Morales et al. 1993; Linacre et al. 2010) has indicated that an increase in total Chl-a is generally associated with an intensification in pico-plankton biomass. Our work shows that Chl-a PN fraction generally represents between 50 to 75% of the total phytoplankton Chl-a concentration. It also shows that Chl-a PN/NM ratios increase from nearshore to offshore waters and that temporal variability of NM fraction reaches higher values than that of smaller cells. This finding agrees with the following observations: a) phytoplankton usually shows a decrease in their cell-size from nutrient-sufficient coastal areas to poor-nutrient open ocean zones (Mouw & Yoder, 2005); b) the most variable portion in the phytoplankton size-abundance ranges is the microplankton fraction, and c) abundance of smaller cells (picoplankton) is rather constant and plays a minor role in the biomass variability (Rodríguez et al., 1998). Goericke (2011) pointed out that total phytoplankton Chl-a concentration usually declined from values up to 10 mg m-3 in eutrophic coastal regions to <0.1 mg m-3 in oligotrophic offshore regions of the California Current System. The lower offshore Baja California total Chl-a concentration and the dominance of PN fraction suggests this oceanic region to be a mesotrophic/oligotrophic environment.
In agreement with our Chl-a NM results, we have shown that the oceanic Baja California epipelagic environment is characterized by episodic pulses of large phytoplankton cells, particularly during the spring upwelling period. In the spring survey, dinoflagellates (mainly Heterocapsa spp., Prorocentrum spp., Ceratium spp.) were mostly observed. Some chain-forming diatoms (Pseudo-nitszchia spp., Chaetocerus spp., Rhizosolenia spp.) were less significant. These two groups represent about 70% of the total phytoplankton counts (cells >5 μm) in spring season, with ~3.6 and 2.6 times higher than those for winter and summer, respectively (Fig. 7).
Dominance of larger phytoplankton cells from winter/spring mixed water-column to summer stratified environment supports the recommendation that greater cell development is improved mainly by physical conditions (Echevarría et al., 2009). In general, dinoflagellate and diatom structure and abundance variability has been correlated with subsequent changes in the regional circulation associated with coastal upwelling events (Tilstone et al., 2000; Figueiras et al., 2004; Aguilera et al., 2009). Other authors likewise noted that phytoplankton biomass changes in the California Current were primarily driven by larger-size class's cells (Mullin, 1998; Anderson et al., 2008). High contributions of Chl-a grounded on large sized cells biomass are observed along the Baja California coastal waters, particularly in spring season (González-Morales et al., 1993; Millán-Nuñez et al., 2004, Millán-Nuñez & Millán-Nuñez, 2010; Linacre et al., 2012). Hernández-Becerril et al. (2007) described phytoplankton with relatively low species richness dominated by coccolithophorids for spring season off Baja California, together with nanoplanktonic centric and pennate diatoms.
During spring coastal upwelling events, colder and high salinity water conditions occur at nearshore locations as result of subsurface waters vertical advection. The raising of the pycnocline generates SCM formation at shallow depths, which is mainly constituted by large-size phytoplankton cells (Espinosa-Carreón etal., 2012). As we pointed out, vertical mixing conditions, mixing layer thickness, and phytoplankton cells advection from intermediate waters appear to be processes mainly affecting the SCM vertical position off Baja California (Espinosa-Carreón et al. loc.cit). Ruiz et al. (1996) argued that if phytoplankton cells with settling velocities >1.0 m d-1 were concentrated at the bottom of the mixed layer, larger-scaled turbulence events would recover cells and disperse them in the mixed layer resulting in a net upward transport. However, predominance of large phytoplankton cells in coastal upwelling regimes is not only a consequence of high turbulence, but also due to vertical advection (Rodríguez et al., 2001).
Likewise, because the mixed-layer is deeper offshore Baja California (Jeronimo & Gomez-Valdes, 2010), it increases settling particles velocities, forcing larger cells to settle below the euphotic zone. This is consistent with the findings of this work since PN cell contribution to SCM in open waters prevailed and is located deeper. This suggests that off Baja California, trophic status will determine not only the development but also the maintenance, depth, size-structure, and magnitude of the SCM. These results establish the importance of larger-sized phytoplankton cells producing the spring Chl-a maximum at nearshore zones, their occurrence at upper water-column layers, and the progressive increase of the importance of smaller size-cells towards open waters and at subsurface zones.
La Niña conditions were evident in the California Current region since summer of 2007 until the first part of 2009 (McClatchie et al., 2009). The main effects of the La Niña occurrence were stronger coastal upwelling events, with lowest sea surface temperature. Nevertheless, surface temperature (10-m depth) off Baja California was typically average, with phytoplankton chlorophyll above the mean (McClatchie et al., 2009). Because in this work we are only showing 2008-year chlorophyll data, it is not possible to demonstrate some large scale temporal tendencies as result of La Niña effect off Baja California. However, from the McClatchie et al. (2009) results, there is an apparent notorious increase in the total chlorophyll concentration during this particular year.
In regard to the questions posed earlier, we have shown that: 1- Phytoplankton biomass of small-sized cells (PN<8 μm) and large-sized cells (NM>8 pm) exhibit a spatial patchiness distribution off Baja California related with hydrographic variability. Further, an overall decline in Chl-a concentration in the upper 200 m water-column depth from nearshore to offshore waters is consistently observed as result of decreasing water-column dynamics offshore. 2- Water column averaged phytoplankton PN/NM ratios range from 2 to 8, except in spring nearshore locations. These ratios indicate the highest PN-fraction contribution to the water column, but with NM fraction being more significant with depth in most of the sampled transects. There is a homogenous phyto-plankton biomass vertical pattern during winter and summer, with spring Chl-a maxima in the upper 50 m depth particularly at nearshore zones. Phytoplankton Chl-a increase at these shallow depths appears to be more related with the onshore and offshore thermocline vertical position. 3- Seasonally, PN Chl-a concentration is less variable than the NM Chl-a fraction, and they maintain almost the same values offshore. Throughout the upwelling spring period at nearshore locations, the NM fraction is significantly higher than PN, with maxima for both large-size phytoplankton cells abundance (dinoflagellates and diatoms) and biomass. Dinoflagellates dominate the phytoplankton community through the three sampled seasons. 4- Subsurface Chl-a maximum averaged depth is located on shallow waters (~10-20 m) at nearshore zones. In contrast, lower concentrations and the position of the SCM at deeper levels (50-100 m) are placed offshore, particularly during spring season. Maxima Chl-a vertical positions appear to be related with the thermocline vertical location described for the region. 5- Factors controlling phytoplankton community size structure with dominance of larger NM cells and high biomass at nearshore zones may be coupled with coastal upwelling environments. Meanwhile, phytoplankton community size structure with dominance of PN fraction is most likely in the transitional (middle) and offshore zones.
Traditional knowledge has shown that small phytoplankton cells retain almost constant biomass levels and that autotrophs biomass variability is in general the result of large phytoplankton cells abundance. This seems to be the prevailing condition at the Baja California-IMECOCAL nearshore zone of the southern California Current region.
ACKNOWLEDGEMENTS
The first author (VMMA) thanks CONACYT (Consejo Nacional de Ciencia y Tecnología, México) for providing a scholarship as project assistant (Ref. V45813R and Ref. 48367). VMMA is also very grateful to IMECOCAL Project and CICESE's personnel for the laboratory and lodging facilities. Special thanks to Carmen Bazán, Martín De-la-Cruz, and José Luis Peña for their assistance. The authors gratefully acknowledge Captain Pedro Núñez Cota and crew of the R/V Francisco de Ulloa (CICESE), and all the colleagues involved in the cruises IM0801, IM0804, and IM0807 for their efficient help and cooperation at sea. We also thank to anonymous reviewers for their helpful comments that improved this manuscript. GGC, RD and JRLL are grant holders of the Sistema Nacional de Investigadores (CONACYT).
REFERENCES
Aguilera, V., R. Escribano & L. Herrera. 2009. High frequency responses of nanoplankton and microplankton to wind-driven upwelling off northern Chile. Journal of Marine Systems 78: 124-135. [ Links ]
Anderson, C. R., D. A. Siegel, M. A. Brzezinski & N. Guillocheau. 2008. Controls on temporal patterns in phytoplankton community structure in the Santa Barbara Channel, California. Journal of Geophysical Research 113: 1-16. [ Links ]
Barton, E. D. & M. A. Argote. 1980. Hydrographic variability in an upwelling area off northern Baja California in June 1976. Journal of Marine Research 38: 631-649. [ Links ]
Bienfang, P. K., J. P. Szyper & E. Laws. 1983. Sinking rate and pigment responses to light-limitation of a marine diatom: Implications to dynamics of chlorophyll maximum layers. Oceanological Acta 6: 55-62. [ Links ]
Daly K. L. & W. 0. Smith Jr. 1993. Physical-Biological interactions influencing marine plankton production. Annual Review of Ecology and Systematics 24: 555-585. [ Links ]
Durazo, R., A. M. Ramírez-Manguilar, L. E. Miranda & L. A. Soto-Mardones. 2010. Climatology of hydrographic variables. In: Gaxiola-Castro, G. & R. Durazo (Eds.). Dinámica del ecosistema pelágico frente a Baja California 1997-2007: Diez años de investigaciones Mexicanas de la Corriente de California. pp. 25-57. [ Links ]
Echevarría, F., L. Zabala, A. Corzo, G. Navarro, L. Prieto & D. Macías. 2009. Spatial distribution of autotrophic picoplankton in relation to physical forcings: the Gulf of Cádiz, Strait of Gibraltar and Alborán Sea case study. Journal of Plankton Research 31: 1339-1351. [ Links ]
Espinosa-Carreón, T. L., P. T. Strub, E. Beier, F. Ocampo Torres & G. Gaxiola-Castro. 2004. Seasonal and interannual variability of satellite-derived chlorophyll pigment, surface height, and temperature off Baja California. Journal of Geophysical Research 109: C03039. [ Links ]
Espinosa-Carreón, T. L., G. Gaxiola-Castro, E. Beier, P. T. Strub & A. J. Kurczyn. 2012. Effects of mesoscale processes on phytoplankton chlorophyll off Baja California. Journal of Geophysical Research 117: C04005. [ Links ]
Figueiras, F. G., U. Labarta & M. J. Fernández-Reiriz. 2004. Coastal upwelling, primary production and mussel growth in the Rías Baixas of Galicia. Hydrobiologia 484: 121-131. [ Links ]
Finkel, Z. V., J. Beardall, K. J. Flynn, A. Quigg, A. V. Rees & J. A. Raven. 2010. Phytoplankton in a changing world: cell size and elemental stoichiometry. Journal of Plankton Research 32: 119-137. [ Links ]
Gaxiola-Castro, G., R. Durazo, B. Lavaniegos, M. E. De-la-Cruz-Orozco, E. Millán-Núñez, L. Soto-Mardones & J. Cepeda-Morales. 2008. Pelagic ecosystem response to interanual variability off Baja California. Ciencias Marinas 34: 263 -270. [ Links ]
Gaxiola-Castro, G., J. Cepeda-Morales, S. Nájera Martínez, M. E. De-La-Cruz-Orozco, T. L. Espinosa-Carreón, R. Sosa-Avalos, E. Aguirre-Hernández & J. P. Cantú-Ontiveros. 2010. Phytoplankton biomass and production. In: Gaxiola-Castro G. & R. Durazo (Eds.). Dinámica del ecosistema pelágico frente a Baja California 1997-2007: Diez años de investigaciones Mexicanas de la Corriente de California. pp. 25-57. [ Links ]
Goericke, R. 2011. The structure of marine phytoplankton communities-Patterns, rules and mechanisms. California Cooperative Oceanic Fisheries Investigations Report 52: 182 - 197. [ Links ]
González-Morales, A. T., G. Gaxiola-Castro & J. R. Lara-Lara. 1993. Daily photosynthetic parameters and biomass from size-fractionated phytoplankton off Baja California. Estuarine Coastal and Shelf Science 36: 147-158. [ Links ]
Hernández-Becerril, D. U., E. Bravo-Sierra & J. A. Ake-Castillo. 2007. Phytoplankton on the western coasts of Baja California in two different seasons in 1998. Scientia Marina 71 (4): 735-743. [ Links ]
Iriarte, J. L., G. Pizarro, V. A. Troncoso & M. Sobarzo. 2000. Primary production and biomass of size-fractionated phytoplankton off Antofagasta, Chile (23-24°S) during pre-El Niño and El Niño 1997. Journal of Marine Systems 26 (1): 37-51. [ Links ]
Irwin, A., Z. V. Finkel, 0. M. E. Schofield & P. G. Falkowski. 2006. Scaling-up from nutrient physiology to the size-structure of phytoplankton communities. Journal of Plankton Research 28: 459-471. [ Links ]
Jerónimo, G. & J. Gomez-Valdes. 2010. Mixed layer depth variability in the tropical boundary of the California Current, 1997-2007. Journal of Geophysical Research 115: C05014. [ Links ]
Kerr, S. R. & L. M. Dickie. 2001. The Biomass spectrum. A predator-prey theory of aquatic production. Columbia University Press, New York, USA. [ Links ]
Kiørboe, T. 1993. Turbulence, Phytoplankton cell size, and the structure of Pelagic food webs. Advances in Marine Biology 29: 1-72. [ Links ]
Legendre, L. & J. Le Fevre. 1989. Hydrodynamical singularities as controls of recycled versus export production in oceans. In: Berger, W. H. (Ed.). Productivity of the ocean: present and past. Wiley, New York, pp. 49-63. [ Links ]
Li, W. K. W. 2002. Macroecological patterns of phytoplankton in the northwestern North Atlantic Ocean. Nature 419: 154-157. [ Links ]
Linacre, L. P., M. R. Landry, J. R. Lara-Lara, J. M. Hernández-Ayón & C. Bazán-Guzmán. 2010. Picoplankton dynamics during contrasting seasonal oceanographic conditions at a coastal upwelling station off Northern Baja California, México. Journal of Plankton Research 32: 539-557. [ Links ]
Linacre, L., M. R. Landry, R. Cajal-Medrano, J. R. Lara-Lara, J. M. Hernández-Ayón, R. R. Mouriño-Pérez, E. García-Mendoza & C. Bazán-Guzmán. 2012. Temporal dynamics of carbon flow through the microbial plankton community in a coastal upwelling system off northern Baja California, Mexico. Marine Ecology Progress Series 461: 31-46. [ Links ]
Longhurst, A. R. 1998. Ecological Geography of the Sea. Academic Press: San Diego, pp. 398. [ Links ]
Lynn, R. J. S J. J. Simpson. 1987. The California Current System: The seasonal variability of its physical characteristics. Journal of Geophysical Research 92: 12947-12966. [ Links ]
Marañón, e., P. M. Holligan, R. Barciela, N. González, B. Mouriño, M. J. Pazó S M. Várela. 2001. Patterns of phytoplankton size structure and productivity in contrasting open-ocean environments. Marine Ecology Progress Series 216: 43-B6. [ Links ]
McClatchie, s., R. Goericke, F. B. Schwing, S.J. Bograd, W. T. Peterson, R. Emmett, R. Charter, W. Watson, N. Lo, K. Hill, C. Collins, M. Kahru, B. G. Mitchell, J. A. Koslow, J. Gomez-Valdes, B. E. Lavaniegos, G. Gaxiola-Castro, J. Gottschalk, M. L'Heureux, Y. Xue, M. Manzano-Sarabia, E. Bjorkstedt, S. Ralston, J. Field, L. Rogers-Bennett, L. Munger, G. Campbell, K. Merkens, D. Camacho, A. Havron, A. Douglas S J. Hildebrand. 2009. The state of the California Current, 2008-2009: Cold conditions drive regional difference. CalCOFI. Rep. B0: 43-68. [ Links ]
Millán-Núñez, e., M. E. Sieracki, R. Millán-Núñez, J. R. Lara-Lara, G. Gaxiola-Castro S C. C. Trees. 2004. Specific absorption coefficient and phytoplankton biomass in the southern region of the California Current. Deep-Sea Research II B1: 817-826. [ Links ]
Millán-Núñez, E. S R. Millán-Núñez. 2010. Specific Absorption Coefficient and phytoplankton community structure in the southern region of the California Current during January 2002. Journal of Oceanography 66: 719-730. [ Links ]
Montecino, V. S D. Quiroz. 2000. Specific primary production phytoplankton size structure in the upwelling area off Chile (30°S). Aquatic Sciences 62: 364-380. [ Links ]
Mouw, C. B. S J. A. Yoder. 200B. Primary production calculations in the Mid-Atlantic Bight, including effects of phytoplankton community size structure. Limnology and Oceanography B0: 1232-1243. [ Links ]
Mullin, M. M. 1998. Biomasses of large-celled phytoplankton and their relation to the nitricline and grazing in the California Current system off Southern California, 1994-1996. California Cooperative Oceanic Fisheries Investigations Report 39: 117-123. [ Links ]
Platt, T., D. V. Subba Rao S B. Irwin. 1983. Photosynthesis of picoplankton in the oligotrophic ocean. Nature 301: 702-704. [ Links ]
Poulton, A. J., P. M. Holligan, A. Hickman, Y.-N. Kim, T. R. Adey, M. C. Stinchcombe, C.Holeton, S. Root S E. M. S. Woodward. 2006. Phytoplankton carbon fixation, chlorophyll-biomass and diagnostic pigments in the Atlantic Ocean. Deep-Sea Research II B3: 1B93. [ Links ]
Robles-Jarero, E. G. S J. R. Lara-Lara. 1993. Phytoplankton biomass and primary productivity by size classes in the Gulf of Tehuantepec, Mexico. Journal of Plankton Research 1B: 1341-13B8. [ Links ]
Rodríguez, J., J. M. Blanco, F. Jiménez-Gómez, F. Echevarría, J. Gil, V. Rodríguez, J. Ruiz., B. Bautista & F. Guerrero. 1998. Patterns in the size structure of the phytoplankton community in the deep fluorescence maximum of the Alborán Sea (southwestern Mediterranean). Deep-Sea Research I 45: 1577-1593. [ Links ]
Rodríguez, J., J. Tintoré, J. T. Allen, J. M. Blanco, D. Gomis, A. Reul, J. Ruiz, V. Rodríguez, F. Echevarría & F. Jiménez-Gómez. 2001. Mesoscale vertical motion and the size structure of phytoplankton in the ocean. Nature 410: 360-363. [ Links ]
Ruiz, J., C. M. García & J. Rodríguez. 1996. Sedimentation loss of phytoplankton cells from the mixed layer: effects of turbulence levels. Journal of Plankton Research 18: 1727-1734. [ Links ]
Sherr, E., B .F. Sherr & P .A. Wheeler. 2005. Distribution of coccoid cyanobacteria and small eukaryotic phytoplankton in the upwelling ecosystem off the Oregon coast during 2001 and 2002. Deep-Sea Research II 52: 317-330. [ Links ]
Stemmann, L., G. A. Jackson & G. Gorsky. 2004. A vertical model of particle size distributions and fluxes in the midwater column that includes biological and physical processes - part ii: Application to a three year survey in the NW Mediterranean Sea. Deep-Sea Research I 51: 885-908. [ Links ]
Stockner, J. G. & N. J. Antia. 1986. Algal picoplankton from marine and freshwater ecosystems: a multidisciplinary perspective. Canadian Journal of Fisheries and Aquatic Sciences 43: 2472-2503. [ Links ]
Tilman, D. 1977. Resource competition between planktonic algae: an experimental and theoretical approach. Ecology 58: 338-348. [ Links ]
Tilstone, G. H., B. M. Míguez, F. G. Figueiras & E. G. Fermín. 2000. Diatom dynamics in a coastal ecosystem affected by upwelling: coupling between species succession, circulation and biogeochemical processes. Marine Ecology Progress Series 205: 23-41. [ Links ]
Utermöhl, H. 1958. Zur Ver vollkommung der guantitativen phytoplankton-methodik. Mitteilungen Internationale Vereiningung fuer Theoretische und Angewandte Limnologie 9: 1-38. [ Links ]
Welschmeyer, N. A. 1994. Fluorometric analysis of chlorophyll a in the presence of chlorophyll b and pheopigments. Limnology and Oceanography 39: 1985-1992. [ Links ]
Worden, A. Z., J. K. Nolan & B. Palenik. 2004. Assessing the dynamics and ecology of marine picophytoplankton: The importance of the eukaryotic component. Limnology and Oceanography 49: 168-179. [ Links ]

