


 nueva página del texto (beta)
 Inglés (pdf)
 Artículo en XML
 Referencias del artículo
 Enviar artículo por email
 Citado por SciELO
  Similares en
SciELO
Similares en
SciELO 
 Permalink
INTRODUCTION
The Bajío region in the state of Guanajuato is one of the most productive agricultural regions in Mexico, contributing with 3.4% of the state’s Gross Domestic Product (GDP) (Zanor et al. 2018). However, industrial agricultural activity has caused the deterioration of cultivated soils, infertility, salinization, sodicity and water and wind erosion (IPLANEG 2019).
Soil degradation is of global importance due to its far-reaching negative impact on the economy, health, and socio-environmental aspects (Valbuena-Calderón et al. 2016). Degradation has increased because of using pesticides, herbicides, chemical fertilizers, and heavy machinery in industrial agriculture. To evaluate those effects, studies and methodologies have been developed by experts, based on visual indexes of quality and statistical weights (Sarmiento et al. 2018). Furthermore, the following remedies have been used to prevent or counteract the impact of agricultural activity: planting cover crops, not plowing the soil and applying organic amendments-biosolids, biochar, cow or sheep manure and addition of vegetable organic matter (OM) (Wu et al. 2021).
Biosolids have emerged as an amendment to improve soil properties and their advantages lie in the fact that waste product of the urban water treatment process-whose final disposal is mainly in sanitary landfills-is not wasted and instead is used to provide a high nutrient content to the soil, which improves soil quality and prevents contamination in landfills.
Various authors have carried out studies of the application of organic amendments in soils with different textures and salinity levels. López-Valdez et al. (2010), compared-in the short term-the mineralization of C and N sources in biosolids added to agricultural soils with low OM content and high content of salts. The results indicated a rapid mineralization of C due to the addition of biosolids, as well as a reduction in the availability of N due to biological and physical immobilization. For four years, Ouyang and Norton (2019), analyzed the effects that various organic fertilizers and amendments have on the composition of the microbial community and the mineralization of N in an agricultural soil. The results showed that the application of organic amendments modifies the structure of the microbial community, as well as the enzymatic activities of the soil. Wu et al. (2021), studied the changes in structure and concentration of C in saline-sodic soils when adding organic amendments, indicating that the addition of those increased the sequestration of C due to the charge distribution of the soil aggregates. Medina-Herrera et al. (2020), through C and N mineralization dynamics and microbial activity, analyzed for 56 days the effects of adding biosolids to sodic agricultural soils, concluding that the addition of biosolid increased the microbial activity as a result of adding easily degradable OM. Due to such antecedents, the importance of investigating the effects presented in sodic agricultural soils under the addition of organic amendments-such as biosolids-has been highlighted with the purpose of establishing the variability of soil quality based on mineralization of sources of added C and N.
In the context of monitoring methodologies, establishing SQIs has been the strategy for analyzing the conditions of agricultural soils and their recovery processes. However, these indexes are seldom applied in studies with a longitudinal short-term approach to analyze the behavior of soil quality. Moreover, these monitoring methodologies focused on soil conditions have not been used in mineralization dynamics of unconventional C and N sources, such as biosolids.
The objective of this study was to apply biosolids as an organic amendment to a sodic agricultural soil in the Bajío region of Guanajuato and to compare methodologies for the establishment of SQIs through the dynamics of C and N mineralization. It was hypothesized that the developed SQIs would allow for the differentiation of soil quality across treatments with respect to time.
MATERIALS AND METHODS
Soil of study and sampling
This study was carried out in the Bajío region of the state of Guanajuato where Chernozem-type soils predominate. The region has plains with altitudes between 1700 and 2000 m asl, an annual rainfall of 700 mm and an average annual temperature between 18 and 22 ºC (INAFED 2010). A sodic soil with agricultural activity was selected from the community “El Huizache” in the municipality of Cortazar (20º24´52.2´´ N, 100º57´0.42´´ W) (Fig. 1).
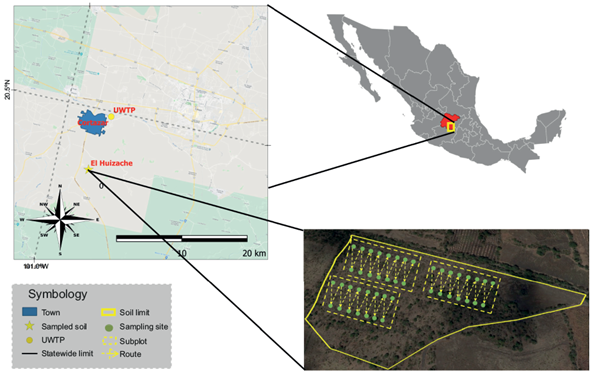
Fig. 1 Map of the study area. Sources of information: National Geostatistical Framework 2018; Land Use and Vegetation Chart Series V Guanajuato.
The sampling method was systematic in a zig-zag pattern, dividing the soil into three subplots of 600 m2. In each subplot, 15 subsamples of 2 kg were taken through excavations of 40 cm in diameter and 30 cm in depth (45 subsamples in total) (SEMARNAT 2002), obtaining a composite sample of 30 kg of soil. The subsamples were taken every 18 m using an auger and georeferenced using a Garmin® eTrex Legend® H.
Sampling of biosolids
The biosolids were obtained from an urban wastewater treatment plant (UWTP) in the municipality of Cortazar, Guanajuato (20º29´34´´ N, 100º56´03´´ W). The biosolids were produced through a treatment of activated sludge with extended aeration and a phase of aerobic digestion. At the end of the process, a dehydration of the biosolid was performed using belt press systems. Sampling of the biosolid was systematic, taking six samples from the pressing belt over a period of one hour. In each sampling, 5 kg of biosolids were taken, obtaining a final composite sample of 30 kg on a wet basis (85%).
Preparation of soil and biosolid samples
For biochemical analysis, soil and biosolid samples were taken to the laboratory under sterile conditions and kept at 4 ºC until their analysis (Rangel-Peraza et al. 2017). Another batch of samples was transported at room temperature for its physical and chemical analysis. Subsequently, the samples were air-dried and sieved using a mesh with a 2 mm diameter aperture. Once dried and sieved, they were stored in plastic bags at 4 ºC until their analysis (Vasu et al. 2016).
Soil and biosolid characterization
The soil and biosolid samples were characterized by analyzing all the indicators in triplicate. The potential of hydrogen (pH) was determined using the method of Thomas (2018), in a soil:water and biosolid:water ratio of 1:2.5 (w/v). The electrical conductivity (EC) was determined according to the method of Hendrickx et al. (2002), and was reported in dS/m. The texture analysis was reported in percentage of clay (cly), sand (snd) and silt (slt), using the method proposed by Bouyoucos (1962). For the establishment of the textural class, the texture diagram proposed by the USDA (1951) was used. The total organic C (TOC) was analyzed by oxidation reactions with potassium dichromate (Walkley and Black 1934), quantified colorimetrically at 660 nm in a Jenway 6305 spectrophotometer and reported in percentage. The OM content was determined by multiplying the TOC value by the Van Bemmelen factor (1.724) (Yilmaz and Sönmez 2017). The macronutrients (P, K, Ca, Mg and Na) and micronutrients (Fe, Cu, Zn, Mn, Cd, Ni and B) were analyzed by acid digestion using the microwave ICP method (Bettinelli and Baroni 1991) and reported in meq/100 g soil. The cation exchange capacity (CEC) of the soil was expressed in meq/100 g soil and was obtained using the methodology by Cottenie (1980). The exchangeable sodium percentage (ESP) and the sodium adsorption ratio (SAR) was established according to Webster (SEMARNAT 2002, Webster 2007). For the characterization of the biosolid, the total N (TN) was determined using the micro Kjeldahl method (Bremner 1996) and expressed in mg N/kg dry soil or dry biosolid. Faecal coliforms (FC) and number of helminth eggs (HE) were determined following the methodologies described by the Mexican regulation NOM-004-SEMARNAT-2002 (SEMARNAT 2003), reported in number of positive samples/g of dry biosolid and number of helminth eggs/g of dry biosolid, respectively.
Experimental design of C and N mineralization dynamics
A completely randomized experimental block design was utilized with three repetitions during the short-term mineralization dynamics of C and N soil/biosolid, with sampling on days 0, 3, 7, 15 and 30. The experimental units consisted of glass jars (900 mL) which had a glass bottle (125 mL) inside with 100 g soil/biosolid whose water holding capacity (WHC) was adjusted to 40% with sterile distilled water. The treatments consisted of soil without biosolid (T1 control), soil/biosolid in a ratio of 80:20 (w/w) (8.87 mg N/kg dry soil) (T2), and soil/biosolid in a ratio of 60:40 (17.75 mg N/kg dry soil) (T3).
Analyzed indicators in the mineralization dynamics of C and N
Physical and chemical indicators
The following indicators were analyzed in triplicate for C and N mineralization dynamics. For the determination of ammonium-nitrogen (N-NH4 +) and nitrates (N-NO3 -), a previous extraction of the soil solution was carried out by means of reciprocal mechanical stirring for two hours. During the extraction, potassium sulfate (0.5 M of K2SO4) was used as extractant in a ratio of 1:5 (w/v). After extraction, the extract was filtered using Whatman No. 2 filter paper and stored frozen at -4 ºC until analysis (Conde et al. 2005). For the quantification of N-NH4 +, a salicylic acid solution (5 % w/v) was used, determining the inorganic N colorimetrically at a wavelength of 660 nm (Alef and Nannipieri 1995). For the analysis of N-NO3 - a sulfanilamide solution (0.5 % w/v) was used, quantifying inorganic N colorimetrically at a wavelength of 540 nm (Alef and Nannipieri 1995). The evaluated forms of inorganic N were reported in mg N-NH4 +/kg dry soil and mg N-NO3 -/kg dry soil. The indicator referring to the rate of net mineralized inorganic N (Nmin) was obtained from the sum of the indicators N-NH4 + and N-NO3 -. The Nmin indicator was reported in mg N/kg dry soil. The global transformation efficiency or aerobic mineralization of organic N and its release-assimilation into inorganic N via nitrification was obtained from the ratio of the inorganic N indicators (N-NH4 +/N-NO3 -).
Biological indicators
The following indicators related to the mineralization of C and N sources over time were included, reflected in the production of evolved microbial C-CO2 and global hydrolytic enzymatic activities (AFDA), such as esterases, lipases and proteases. The microbial C-CO2 content was estimated from the aerobic mineralization of the various sources of organic C, quantified by capturing it in amber glass vials (20 mL) with an alkaline solution of NaOH 1.0 M (pH = 12), reported in mg C-CO2/kg dry soil. For the determination of AFDA, the colorimetric method consisted in the detection of hydrolyzed fluorescein, after incubation of the soil extracts for one hour at 35 ºC, at a wavelength of 490 nm, reported in µg fluorescein/kg dry soil/h (Green et al. 2006).
Statistical analysis
Statistical analyses were carried out using the R Statistical Software version 3.6.3 (R Core Team 2019). Statistical differences among the indicators were estimated using a two-way ANOVA, with a subsequent Tukey test with a level of significance p ≤ 0.05 (Johnson and Wichern 2014). To establish correlations among the indicators, a Pearson’s product-moment correlation matrix was used, considering r 2 ≥ ± 0.6 as a significant correlation (Muñoz-Rojas et al. 2016). A principal component analysis (PCA) was carried out, where a minimum data set (MDS) of the indicators was established. The PCA began with the normalization of the results obtained from the indicators using natural logarithms (y = ln(x)), followed by a Kaiser-Meyer-Olkin adequacy analysis (Johnson and Wichern 2014). The eigenvalue criterion was used to select the principal components (PCs); eigenvalue >1 (Yu et al. 2018). After establishing the PCs, the indicators that had a significant correlation with their PC (r 2 ≥ ± 0.60) were selected (Muñoz-Rojas et al. 2016), having a commonality of ≥ 0.60 with the PC (Villazón-Gómez et al. 2017). Subsequently, a redundancy reduction process was carried out among the indicators related to their PC, under the following criteria and in order of importance: number of significant interactions > belonging to PC (PC1 > PC2 > …> PCn) > correlation with their PC (Bai et al. 2018).
Development of SQIs
For the development of SQIs, three methodologies were selected: additive index (SQIAD), weighted additive index (SQIW) and unified weighted additive index (SQIU) (Sarmiento et al. 2018). For the establishment of SQIAD, equation (1) was used (Nabiollahi et al. 2018).
Where S i is the value of the indicator resulting from the redundancy reduction process and n is the number of indicators included in the SQI.
For the methodology of SQIW and SQIU, equation (2) was used. For the first one, the weights were established according to the function to which the indicators belong (indicator level 2, weight 0.333) (Lima et al. 2013). The weights that were used for the SQIU were established from the variance explained by the PCs (Yu et al. 2018).
Where W i is the weight-established by experts-of the indicator (SQIW) or the proportion of variance of the PC to which the indicator is correlated (SQIU). S i is the value of the indicator, which was obtained from the analyses of the soil samples.
For the indexes SQIAD, SQIW and SQIU, two versions were established. The first one using a non-linear indicator scoring equation (3) (Yu et al. 2018), and the second one using linear indicator scoring equations (4) and (5) (Nabiollahi et al. 2018). Equation (3) was used to score the indicators that have a non-linear behavior and their function in the soil is considered as “the more the better” or “the less the better”:
Where a is the maximum standardized value of the indicator, X m is the mean value of the indicator obtained from the soil analyses, X is the value of the indicator obtained from the soil analyses and b is the slope of the indicator’s scoring function (−2.5 and 2.5 for indicators whose functions are “the more the better” and “the less the better”, respectively).
Equations (4) and (5) were used to score the indicators that have a linear behavior and whose function in the soil is “the more the better” and “the less the better”, respectively.
Where X is the value of the indicator, l is the minimum value of the indicator and h is the maximum value of the indicator.
The objective of the SQIs was to obtain values between 0 and 1, with which the quality of the soil could be established according to the classification shown in table I (Hernández-González et al. 2018).
TABLE I SOIL QUALITY CLASSIFICATION (Hernández-González et al. 2018).
| Soil quality | Very high | High | Moderate | Low | Very low |
| Scale | 0.80 - 1.00 | 0.60 - 0.79 | 0.40 - 0.59 | 0.20 - 0.39 | 0.00 - 0.19 |
| Class | 1 | 2 | 3 | 4 | 5 |
RESULTS
Soil and biosolids characterization
The characterizations of the soil and biosolid are shown in table II. The soil was classified as clayey. In relation to the pH and EC indicators, the soil was classified as moderately alkaline and non-saline, respectively (SEMARNAT 2002, Webster 2007). The soil presented an ESP of 11.1%, classifying it as slightly sodic (So and Aylmore 1993, Webster 2007). Based on the indicators associated with mineralizable C and N sources, the soil was described as having a moderate, low, and very low content of OM, TOC and TN, respectively. The macronutrients presented concentrations within a range that was considered as moderate (P), high (K and Mg) and very high (Ca and Na) (SEMARNAT 2002, Webster 2007). However, the micronutrients presented concentrations considered to be in the range of very low (Fe, Cu and Zn) and low (Mn) (Table II) (SEMARNAT 2002, Webster 2007).
TABLE II CHARACTERIZATION OF THE SOIL SAMPLE FROM EL HUIZACHE AND BIOSOLID FROM THE URBAN WASTEWATER TREATMENT PLANT (UWTP).
| Indicators | Soil | Biosolid | ||
| Value | Interpretation | Value | Interpretation | |
| pH | 8.4 | Moderately alkaline | 6.6 | Neutral |
| EC | 0.57 | Non-saline | 1.15 | Non-saline |
| Texture | Clayey | --- | Sandy | --- |
| OM | 2.06 | Moderate | 0.22 | Low |
| TOC | 1.20 | Low | 0.13 | Low |
| TN | 14.1 | Very low | 44.37 | High |
| P | 0.03 | Moderate | 0.94 | Very high |
| K | 0.85 | High | 0.43 | Low |
| Ca | 21.02 | Very high | 1.01 | Very low |
| Mg | 4.90 | High | 1.40 | Low |
| Na | 3.38 | Very high | 0.47 | Moderate |
| Fe | 0.06 | Very low | 45.24 | Very high |
| Cu | 0.004 | Very low | 0.26 | Moderate |
| Zn | 0.005 | Very low | 1.21 | Moderate |
| Mn | 0.102 | Low | 0.92 | Low |
| Cd | --- | --- | 0.001 | Moderate |
| Ni | --- | --- | 0.007 | Very low |
| B | --- | --- | 0.99 | Very high |
| CEC | 30.34 | High | --- | --- |
| ESP | 11.1 | Slightly sodic | --- | --- |
| SAR | 0.66 | Low | --- | |
| FC | --- | --- | 2.75x10⁶ | High |
| HE | --- | --- | < 1 | Low |
pH = potential of hydrogen, EC = electrical conductivity (dS/m), OM = organic matter (%), TOC = total organic carbon (%), TN = total nitrogen (mg/kg), P = phosphorous (meq/100 g), K = potassium (meq/100 g), Ca = calcium (meq/100 g), Mg = magnesium (meq/100 g), Na = sodium (meq/100 g), Fe = iron (meq/100 g), Cu = copper (meq/100 g), Zn = zinc (meq/100 g), Mn = manganese (meq/100 g), Cd = cadmium (meq/100 g), Ni = nickel (meq/100 g), B = boron (meq/100 g), CEC = cation exchange capacity (meq/100 g), ESP = exchangeable sodium percentage (%), SAR = sodium adsorption ratio (%), FC = faecal coliforms (NPS = number of positive samples/g), HE = helminth eggs (number of helminth eggs/g).
The biosolid was classified in the category “C” according to the Mexican regulation NOM-004-SEMARNAT-2002 (SEMARNAT 2003). The pH and EC indicators presented a neutral range and low content of salts, respectively. The contents of OM and TOC were considered as low, but the TN was high. Regarding macro and micronutrients, they showed concentrations in the range of very high (P, Fe and B), moderate (Na, Cu and Zn), low (K, Mg and Mn) and very low (Ca and Ni) (Table II). However, all the nutrients were found within the maximum permissible limits according to the current national regulation (NOM-004-SEMARNAT-2002).
Mineralization dynamics of C and N
Analysis of variance
According to the information obtained with the two-way ANOVA test, there were significant differences among the analyzed indicators and the treatments tested over time (F ≥ 5.0, p ≤ 0.05) (Fig. 2), allowing for their comparison as a requirement for PCA.
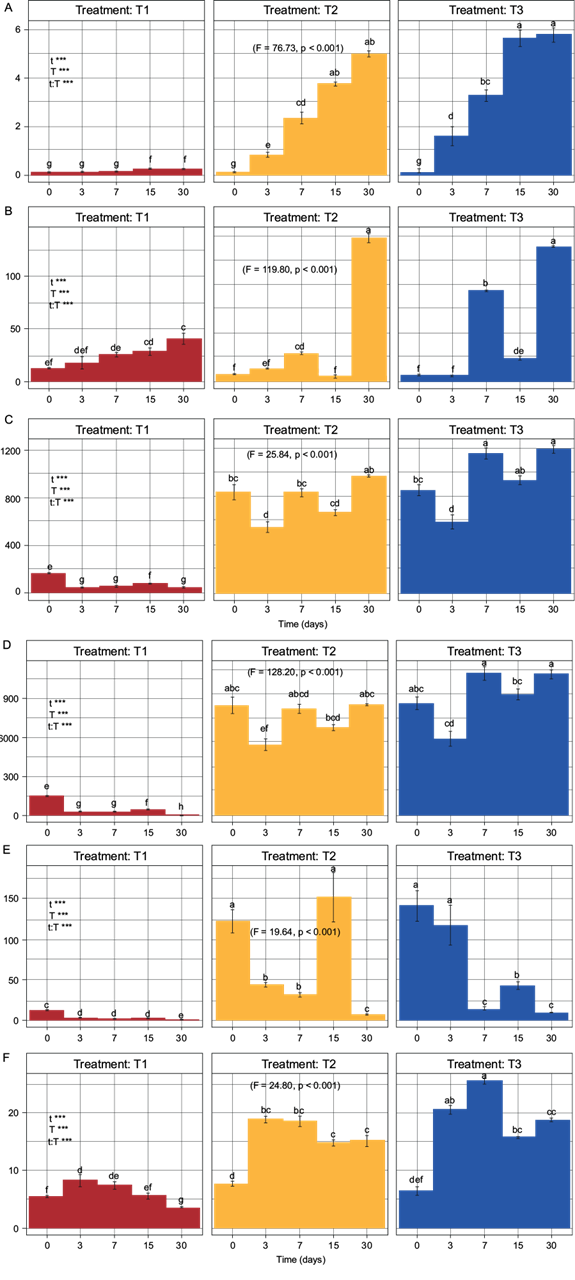
Fig. 2 Two-way ANOVA with subsequent Tukey test. T1 = treatment without biosolid, T2 = treatment with 80:20 soil:biosolid (8.87 mg N/kg dry soil), T3 = treatment with 60:40 soil:biosolid (17.75 mg N/kg dry soil), A) C-CO2 (mg C-CO2/kg), B) N-NO3 - (mg N-NO3 -/kg), C) Nmin (mg N/kg), D) N-NH4 + (mg N-NH4 +/kg), E) N-NH4 +/ N-NO3, F) AFDA (µg fluorescein/kg). Fisher values and probability values indicate the existence of a significant difference among the treatments using a two-way ANOVA with subsequent Tukey test.
The C-CO2 indicator show significant differences from day 3 onward (F = 76.73, p < 0.001) (Fig. 2A), however, the increase in T2 and T3 at the end of the dynamics was 20 and 23.2 times greater, compared to T1. Before day 7, T2 and T3 did not show significant differences between them.
The N-NH4 + indicator presented a behavior that differs in the three treatments. T1 showed a tendency to decrease, T2 a tendency to maintain its concentration and T3 a tendency to increase its concentration. At the end of the dynamics, the increase in N-NH4 + was 232.73 and 296.65 times greater in T2 and T3, compared to T1. T2 and T3 did not present significant differences between them. However, significant differences (F = 128.20, p < 0.001) were observed with respect to T1 from day 3 (Fig. 2D).
Regarding the N-NO3 - indicator, an increase in its concentration was observed over time in the three treatments. At the end of the dynamics, the increase in N-NO3 - was 3.35 and 3.16 times greater in T2 and T3, compared to T1. Additionally, it was observed that T2 and T3 showed significant differences with respect to T1 until day 30 (F = 119.80, p < 0.001) (Fig. 2B).
The N-NH4 +/N-NO3 - indicator showed higher values in all the treatments at the beginning of the mineralization dynamics than at the end, registering a concentration 69.11 and 93.44 times higher in T2 and T3, compared to T1. Likewise, T2 and T3 presented significant differences compared to T1 from the beginning of the dynamics to day 30 (F = 119.80, p < 0.001) (Fig. 2E).
Regarding the Nmin indicator, the concentrations over time showed a tendency to increase in T2 and T3, and a tendency to decrease in T1. At the end of the mineralization dynamics, a N concentration of 22.20 and 27.27 times higher was observed in T2 and T3, compared to T1. In the same way, since the beginning of the mineralization dynamics, T2 and T3 presented significant differences compared to T1, but not between them (F = 25.84, p < 0.001) (Fig. 2C).
About the dynamics of AFDA, this indicator showed an increasing behavior in its concentration in both T1 and T2 on day 3, and that increase continued until day 7 in the case of T3. After day 7, a tendency to decrease was observed in all the treatments. At the end of the mineralization dynamics, the AFDA concentration was 4.39 and 5.47 times higher in T2 and T3, compared to T1. Moreover, T2 and T3 presented significant differences with respect to T1 since day 3 (F = 24.80, p < 0.001), without significant differences between them except for day 7 in T3 (Fig. 2F).
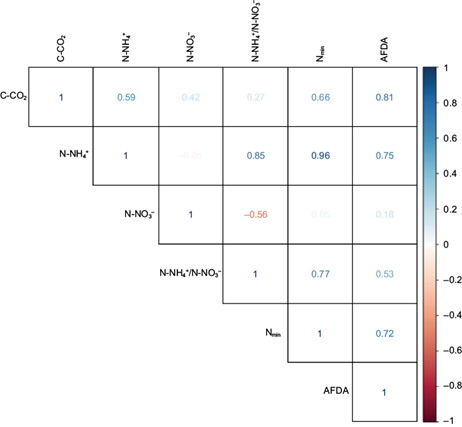
Pearson’s product-moment correlation matrix
Regarding the establishment of correlations among the indicators, the correlation matrix showed that the N-NO3 - was the only indicator that did not present significant correlations (r 2 < ± 0.60) whereas the remaining indicators presented at least one significant correlation (r 2 ≥ ± 0.60) (Fig. 3).
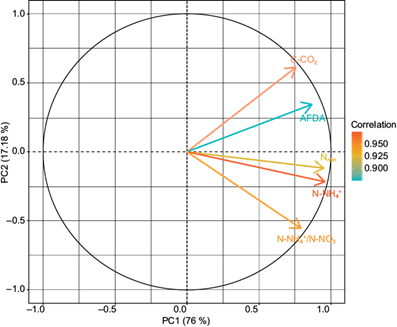
PCA
In the PCA, two PCs were obtained that explain 93.18% of the variability of the data, being distributed as follows: CP1 (76%) and CP2 (17.18%) (Table III). There were significant correlations (r 2 ≥ ± 0.60) among the indicators and the established PCs (Table IV). The relationship between the resulting indicators and the CPs are shown in figure 4. After the redundancy reduction process, the indicators were obtained for each one of the established PCs (Table V).
TABLE III PRINCIPAL COMPONENT ANALYSIS.
| Components | PC1 | PC2 |
| Eigenvalue | 3.80 | 0.87 |
| Proportion of variance | 0.76 | 0.17 |
| Cumulative variance | 0.76 | 0.93 |
PC = principal component.
TABLE IV WEIGHT OF THE INDICATORS IN THE PRINCIPAL COMPONENT ANALYSIS.
| Indicators | PC1 | PC2 | Commonality |
| C-CO2 | 0.76 | --- | 0.95 |
| N-NH4 + | 0.96 | --- | 0.95 |
| N-NH4 +/ N-NO3 - | 0.79 | --- | 0.97 |
| Nmin | 0.95 | --- | 0.97 |
| AFDA | 0.87 | --- | 0.96 |
The values above show significant correlations with their respective principal component (r 2 = > 0.06) and non-significant correlations were omitted.
Establishment of SQIs
The indicator N-NH4 + was established as the one that showed the closest relation to the quality of the analyzed soil. The N-NH4 + indicator was transformed using the scoring functions equations (3) and (4), considering the function “the more the better” for the indicator. Finally, the SQIs that were obtained were described as follows:
The values in the SQIs for the different treatments showed significant differences (F ≥ 5.0, p ≤ 0.05), except for SQIW and SQIU in their non-linear versions. The quality shown by SQIAD in its non-linear and linear versions was found in the range of very low (0.000) to high quality (0.737), and very low (0.001) to very high quality (0.913), respectively. The SQIW showed to be of very poor quality in both its non-linear and linear versions (0.000 and 0.043, respectively). For the SQIU in its non-linear and linear versions, the quality obtained was found in the range of very low (0.000) to moderate quality (0.561), and very low (0.001) to high quality (0.698), respectively (Fig. 5).
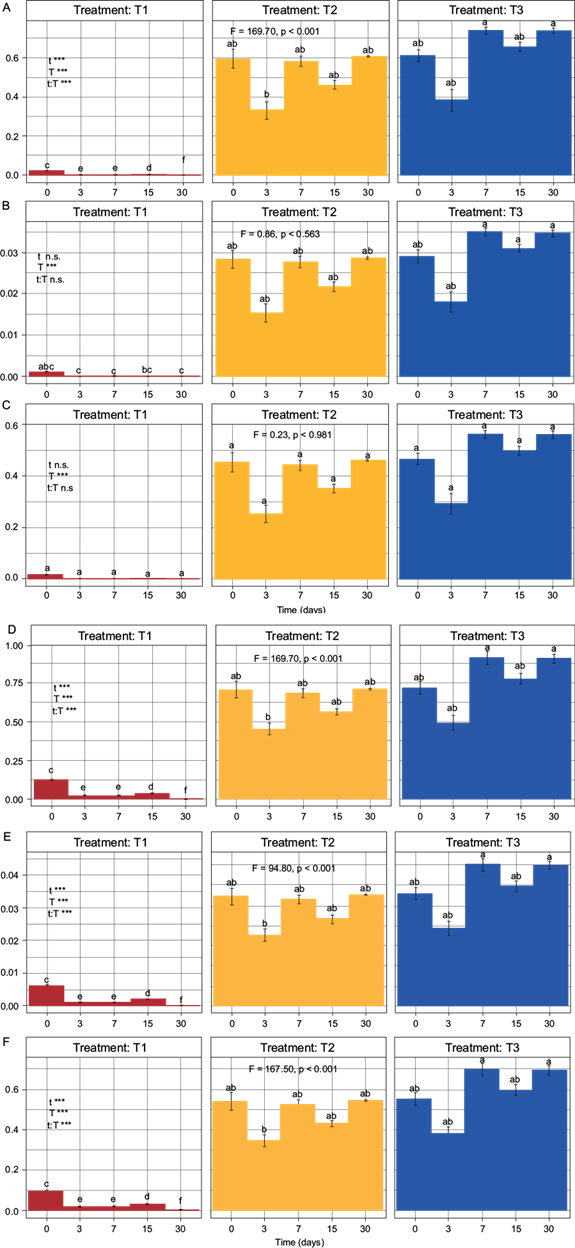
Fig. 5 Two-way ANOVA with subsequent Tukey test for elaborated indexes. T1 = treatment without biosolid, T2 = treatment with 80:20 soil:biosolid (8.87 mg N/kg dry soil), T3 = treatment with 60:40 soil:biosolid (17.75 mg N/kg dry soil). A) SQIADNL, B) SQIWNL, C) SQIUNL, D) SQIADL, E) SQIWL, F) SQIUL. Fisher values (F > 5.0) and probability values (p < 0.05) indicate the existence of a significant difference among the treatments using a two-way ANOVA with subsequent Tukey test.
DISCUSSION
Soil and biosolid characterization
The soil presented a slightly alkaline pH, possibly due to the irrigation practices that are characteristic of the region (Fatima et al. 2018), where well water with a high content of salts is used, which can affect the growth and yield of crops, the availability of nutrients and the OM content (Leogrande and Vitti 2019). The EC indicator was found within the range considered as non-saline, implying an insignificant effect on the structure and texture of the soil; however, its effect on OM mineralization and enzymatic and microbial activity should not be underestimated (Singh 2016). Regarding the texture of the soil, it was classified as clayey, presenting high contents of clay as an indicator of physical degradation. Nevertheless, Castelán-Vega (2019) refers to clayey soils as the ones with the highest quality for agricultural purposes (high clay fraction, CEC and OM). In reference to the indicators related to the nutritional capacity of the soil (OM, TOC, TN, macro, and micronutrients), it was possible to establish that there was a moderate amount of OM and low TOC, which are consistent values in agricultural soils that are at the threshold of physical damage (fertile soils when OM > 3 % and physically degraded when OM < 2 %) (Table II). The macronutrients were found in concentrations that range from moderate to very high, which may be due to the use of significant amounts of fertilizers, something that is possibly causing contamination with P and N in the soils (Dineshkumar et al. 2018). The micronutrients were found in very low and low concentrations, which could affect the development of crops due to a decrease in the enzymatic activity of the plant and reduction in the production of chloroplasts, causing a decrease in the photosynthesis process (Bouain et al. 2019). Nonetheless, these elements can be provided through the addition of biosolids, which differ from commercial fertilizers that often do not contain these micronutrients (Ammar et al. 2020). Regarding the CEC indicator, it was established as having a high capacity, possibly because of the high clay content in the soil and its moderate OM content (Table II) (Noll et al. 2019).
For the characterization of the biosolid, the pH indicator values were classified as neutral, which established that the biosolid was non-disruptive to soil reactions. The EC indicator was classified as non-saline; however, the concentration of salts in the soil must be considered when applying biosolids because of the possible spatio-temporal accumulation of salts (Reddy and Crohn 2019). The indicators related to the non-mineral nutritional capacity presented favourable conditions for the recovery processes of the soil (Segat et al. 2017). Moreover, the C/N was estimated to be low, which could allow for a faster mineralization process of OM in the soil (Legay et al. 2020). Regarding the macro and micronutrients, these were found in concentrations considered as adequate for application to agricultural soils, according to national and international regulations (Table II) (Parlamento Europeo 1984, SEMARNAT 2003, USEPA 1993) except for the indicators B and FC, which require further research and to analyze the soils prior to the application of biosolids. In summary, the analyzed biosolid represented -based on its characterization- a soil quality improver (Brevik et al. 2018).
Mineralization dynamics of C and N
Indicators related to microbial activity
The microorganisms that are present in the soil have represented a small fraction within the composition of the soil; however, the metabolic processes -nutrient cycling- carried out by them are of vital importance for the functions, quality, and health of the soil (Bünemann et al. 2018). The indicators related to microbial activities were C-CO2 and AFDA.
The C-CO2 indicator showed in the three treatments an increase over time (Fig. 2A). The C-CO2 indicator has been related to global microbial activity because it is involved in the mineralization of OM -diverse sources of C and organic N- through transformation into inorganic forms in the soil. Likewise, the microbial activity was reflected in the evolution of C-CO2 because the abiotic production of C-CO2 was discarded since the soil presented a pH of 8.4, which is higher than the threshold reported in the literature for the dissociation of carbonates of the soil (pH = 7.2) (Reddy and Crohn 2019). Additionally, this indicator is dependent on the sources of OM that were added to the soil, where it has been reported that added OM with high C/N ratios decreased the mineralization speed of C of the OM, possibly due to its high content and variety of C sources that are not so accessible to the microbial biomass -e.g., the presence of cellulosic material (Legay et al. 2020). The increase in the concentrations of C-CO2 is consistent with what other authors have reported about the application of biosolids, fertilizers and organic amendments (López-Valdez et al. 2010, Medina-Herrera et al. 2020).
The AFDA indicator presented an upward trend, after which the indicator had a generalized decrease (Fig. 2F). An increase in AFDA can be attributed to the general increase in microbial activity due to mineralization of OM in the soil (T1), but it can mainly be attributed to the addition of OM through the biosolid (T2 and T3) (Vasu et al. 2016). A decrease in AFDA in T1 could be due to a decrease in the accessible C and N of the OM, which is caused by salinity conditions in the soil and degradation of extracellular enzymes due to the action of proteases (Leogrande and Vitti 2019). On the other hand, the treatments T2 and T3 showed a tendency to maintain its concentration unchanged. This can be attributed to the clay fraction, which interacts directly with the OM of the biosolid and soil, improving the formation of micro and macro aggregates (Rivera and Bonilla 2020), also allowing for the stabilization of extracellular enzymes, and preventing their degradation due to the action of protease enzymes (Martínez et al. 2016).
Indicators related to the N cycle
The cycle of N in the soil is of vital importance for microorganisms -N of the biomass- and crops. The element N is required by crops for the development of their structures, as well as to carry out functions that are essential for the growth and development of plants, e.g., photosynthesis (Meng et al. 2020, Wendeborn 2020). The indicators related to the N cycle were N-NO3 -, N-NH4 +, N-NH4 +/N-NO3 - and Nmin.
The N-NO3 - indicator presented significant differences in T2 and T3 -compared to T1- from day 30 of the mineralization dynamics (Fig. 2B). The treatment T1 showed an upward trend of N-NO3 - production throughout the dynamics, possibly because of the mineralization per se of OM (Legay et al. 2020). Nonetheless, T2 and T3 showed a higher mineralization than T1. The treatment T2 presented a similar concentration to T1 throughout the dynamics, except on day 30 where the concentration of N-NO3 - presented a greater increase, which may be due to the mineralization of different nitrogenous compounds characteristic of biosolids. However, T2 and T3 showed a decrease in the N-NO3 - indicator on day 15, possibly due to temporary denitrification processes, structural changes in microbial biomass, denitrifying enzymatic activities or the mobility of N-NO3 -, which have been reported in saline and sodic soils (Reddy and Crohn 2019, Wang et al. 2019, Nannipieri 2020).
The N-NH4 + indicator showed a tendency to decrease in T1, whereas its concentrations remained unchanged in T2 and slightly rising in T3 (Fig. 2D). On the other hand, the observed dynamics of the N-NH4 + indicator in T2 and T3 could be attributed to the mineralization of nitrogenous compounds that are easily accessible to the microorganisms of the soil and biosolids (Ammar et al. 2020, Medina-Herrera et al. 2020).
With respect to the indicator N-NH4 +/N-NO3 -, all the treatments presented low values (Fig. 2E), where higher values would suggest a denitrification process, whereas low values would indicate a nitrification process (Legay et al. 2020). Nevertheless, the values of N-NH4 +/N-NO3 - rose in T2 on days 0 and 15, and in T3 on days 0, 3 and 15, showing possible trends toward denitrification processes (Wang et al. 2019). In general, the trend was a process of potential nitrification because there was no oxygen limitation that would make it possible to oxidize the N sources of OM (Zhang et al. 2018). The occurrence of denitrification processes has been associated with the addition of OM with high N and P contents, congruent with the characteristics of the biosolids used in T2 and T3 (Wang et al. 2019). However, indicators such as NH3 +, NO and NO2 - were not determined in this study to provide further argumentation and validation of the processes.
Regarding the Nmin indicator, it presented a tendency to decrease in T1 and a slightly upward trend in T2 and T3 (Fig. 2C). Low values of the indicator are related to processes of potential denitrification of N-NO3 -, whereas high values would be related to a process of nitrification of N compounds in the soil (Yang et al. 2017). The tendency to decrease in T1 shows a process of possible denitrification, coinciding with the tendency shown by the indicators N-NO3 - and N-NH4 + with respect to the same treatment. Nonetheless, the trends in T2 and T3 showed an increase in the mineralization of nitrogenous compounds and the slow progressive release of nitrogen sources of the OM provided by the addition of biosolid to the soil (Lehmann and Kleber 2015).
SQIs
To evaluate the effects of the applied treatments, indexes were developed to observe the evolution of the quality of the treated soil. The conformation of the SQIs from a single indicator allowed for a simple interpretation of results. The selection of the N-NH4 + as the indicator with the closest relation to soil quality may be due to two factors, i) it is the N component with the highest concentration in biosolids (Ammar et al. 2020) and ii) it has less mobility in the soil compared to N-NO3 -, allowing crops to use it more efficiently -using less energy- than N-NO3 - (Wendeborn 2020). In general, the inclusion of indicators related to the mineralization of N in the soil was in accordance with what was established in other studies as a reliable indicator of the quality of a soil (Beeckman and Beeckman 2018, Legay et al. 2020).
Regarding the methodologies used for the development of SQIs, these presented differences in the results of soil quality. The SQIs that were able to differentiate quality with respect to time, treatment and time-treatment interaction, were SQIAD in its two versions (Fig. 5Aand5D) and SQIU in its linear version; the nonlinear version could only differentiate quality with respect to treatments (Fig. 5Cand5F). SQIW could not differentiate quality in any of its versions (Fig. 5Band5E). The results of SQIW could be because the weighting of the N-NH4 + indicator did not show correlation with the function of the indicator in the analyzed soil, requiring a more detailed analysis by experts in order to modify the weights. The best option for representing soil quality was SQIAD in its two versions (F = 169.70, p < 0.001). However, there was no significant difference with respect to SQIU in its linear version (F = 167.50, p < 0.001). In fact, if the number of indicators integrated in the SQIs were modified, there could be a difference in the prediction shown by SQIAD and SQIU. The difference could lie in the fact that SQIAD presents a worse prediction as the number of indicators increases (Valani et al. 2020), whereas SQIU would present an inverse predictive behavior (Sarmiento et al. 2018). Regarding the analysis of the quality of the soil, a generalized decrease in the quality of T1 was observed, possibly due to the decrease in OM because of the activity of microorganisms. In contrast, the soil quality in T2 and T3 increased immediately and was maintained throughout the mineralization dynamics (Fig. 5).
CONCLUSIONS
The use of biosolids improved the quality of the agricultural soil. The SQIs developed with one single indicator present greater simplicity in the interpretation of results and at the same time allow to monitor the soil quality by applying complex organic amendments, such as biosolids in the analyzed soil. Finally, the SQIs that were developed are an applicable tool to evaluate the effects of the addition of complex organic amendments to agricultural soils with fertility problems or an imbalance in their physical, chemical, and biological properties.

