SciELO - Scientific Electronic Library Online

 
vol.33 número2Filatelia, historia y química: siglo XIXConstrucción de una “estrategia de aprobación de conceptos”, una idea de aprendizaje de química para evitar conceptos erróneos índice de autoresíndice de materiabúsqueda de artículos
Home Pagelista alfabética de revistas  

Servicios Personalizados

Revista

Articulo

Indicadores

Links relacionados

  • No hay artículos similaresSimilares en SciELO

Compartir


Educación química

versión impresa ISSN 0187-893X

Educ. quím vol.33 no.2 Ciudad de México abr. 2022  Epub 28-Nov-2022

https://doi.org/10.22201/fq.18708404e.2022.2.80070 

Didáctica de la Química

Understanding the electrochemical sensors’ figures of merit using a H2O2 sensitive, low-cost ferrite powder first generation electrode

Comprendiendo las figuras de mérito de los sensores electroquímicos mediante un electrodo de ferrita de primera generación sensible al H2O2

Octavio Garate1  * 

Lionel S. Veiga1 

Pablo Tancredi1  2 

Gabriel Ybarra1 

1 Nanomateriales Funcionales, INTI-Micro y Nanotecnologías, Instituto Nacional de Tecnología Industrial, San Martín, Buenos Aires, Argentina.

2 Laboratorio de Sólidos Amorfos, INTECIN, Facultad de Ingeniería, Universidad de Buenos Aires (UBA) - CONICET, Buenos Aires, Argentina.


Abstract

The development of electrochemical sensors capable of quantifying either chemical, biological, or environmental parameters of interest endorses both the increased academic and educational relevance of electrochemistry. As a result, understanding quantitative electrochemical sensing characterization and performance analysis through analytical figures of merit stands as a curricular requirement from both a theoretical and methodological standpoint as it involves the development of several skills which are highly transferable into further electrochemical education and professional practices. On the other hand, due to popular fields of applications such as non-invasive wearable electrochemical sensors for monitoring electrolytes in sweat on high-performance athletes, students are well-aware of its potential, increasing their willingness to partake in electrochemical activities. Addressing the aforementioned, the experience described herein is divided into two main sections. Firstly, a theoretical introduction regarding electrochemical sensors and electrochemical performance validation techniques known as electroanalytical figures of merit are proposed. Secondly, a hands-on experience using a H2O2 sensitive ferrite powder working electrode is carried out by performing voltammetric and chronoamperometric techniques so that students develop a basic understanding of the redox processes occurring at the working electrode surface and obtain analytical performance parameters that allow conclusions to be drawn regarding the ferrite powder sensing capabilities towards H2O2 reduction. As for implementation requirements, the proposed four-hour laboratory protocol is suitable for graduate/upper-level undergraduate physical or analytical chemistry courses and, due to its length, is recommended to be conducted in groups of two to three students.

Keywords: Electrochemistry; Electrochemical Sensors; Analytical Figures of Merit; Laboratory Protocol; Graduate Education; Upper-Division Undergraduate

Resumen

El desarrollo de sensores electroquímicos capaces de cuantificar parámetros químicos, biológicos o ambientales de interés avala la creciente relevancia académica y educativa de la electroquímica. Como resultado, comprender la caracterización cuantitativa de un sensor electroquímico y el análisis de su desempeño a través de las cifras analíticas de mérito constituye un requisito curricular tanto desde un punto de vista teórico como metodológico, ya que implica el desarrollo de múltiples habilidades que son altamente transferibles a futuras prácticas electroquímicas educativas y profesionales. Por otro lado, debido a su implementación en campos de aplicación populares, por ejemplo, a través de sensores electroquímicos portátiles no invasivos para monitorear los electrolitos en el sudor en atletas de alto rendimiento, los estudiantes son conscientes de su potencial, incrementando su predisposición a participar en experiencias electroquímicas educativas. Tomando en consideración lo anteriormente expuesto, la experiencia aquí descrita se divide en dos apartados principales. En primer lugar, se propone una introducción teórica sobre los sensores electroquímicos y sus correspondientes técnicas de validación de rendimiento conocidas como cifras de mérito electroanalíticas. En segundo lugar, se presenta el diseño de una secuencia práctica utilizando un electrodo de trabajo sensible al H2O2 tras su modificación con un polvo de ferrita comercial. El mismo permitirá llevar adelante técnicas voltamperométricas y cronoamperométricas para que los estudiantes desarrollen una comprensión básica de los procesos redox que ocurren en la superficie del electrodo de trabajo y obtengan parámetros de rendimiento analítico de la ferrita hacia la reducción de H2O2. En cuanto a los requisitos de implementación, el protocolo de laboratorio de cuatro horas propuesto es adecuado para cursos de posgrado o cursos de grado avanzados en fisicoquímica o química analítica y, dada su extensión, se recomienda que sea llevado a cabo en grupos de dos a tres estudiantes.

Palabras clave: Electroquímica; Sensores Electroquímicos; Cifras de Mérito; Protocolo de Laboratorio; Educación de Posgrado; Educación de Grado

Introduction

Among its extensive field of application that includes the development of batteries, fuel cells, supercapacitors and environmental remediation devices, electrochemistry has become a well-established topic of interest in academic and educational fields after the growing and constant development of electrochemical sensors (Eliaz y Gileadi 2019). Current electrochemical sensing systems present different structures whose properties allow professionals to quantify chemical, biological, and environmental parameters (Zhang et al. 2020; Kim et al. 2019; Kang et al. 2017). These devices, due to their prevalent application in healthcare are mainly focused on analytes such as oxygen (Rivas et al. 2020; Vaneev et al. 2020), glucose (Peng et al. 2021, Espro et al. 2020) and hydrogen peroxide (Patella et al. 2021; Dang et al. 2020; Garate et al. 2018) which are involved in several biological processes. Among the analytes, hydrogen peroxide sensing is one of the most reported in the literature as its determination does not require controlled measurement conditions like an inert atmosphere, implying that preliminary operational and performance laboratory tests can be performed with the simple preparation of a stock solution.

Due to the applications, an increasing number of practical/theoretical proposals regarding basic electrochemistry concepts and introductory electrocatalytic devices have been published as novel didactic resources for undergraduate/graduate levels (Elgrishi et al. 2018; Hendel and Young 2016; Saxena and Stasangee 2014). Previously referenced works set a solid foundation to continue expanding electrochemistry’s relevance throughout both graduate and undergraduate curriculum. Thus, an experiential practice that allows students to perform quantitative H2O2 electrochemical sensors characterization and performance validation through well-known analytical figures of merit (Justino et al. 2010) is a proposal that presents both continuity and conceptual enrichment, although certain implementation considerations must be considered.

Firstly, electrochemical sensing strategies to detect H2O2 dissolved in an electrolyte buffer differ according to the working electrode’s (WE) conformation. For example, first generation sensors (Gulaboski et al. 2019, Lyu et al. 2019; Sarhan et al. 2019; Yang et al. 2018) based on bare metal WE with nanoparticles attached to it differ completely from third generation ones (Xu et al. 2021; Soto et al. 2021; Gulaboski et al. 2019, Waifalkar et al. 2018), which present a sandwich structure containing a conductive surface, attached nanoparticles with an immobilized redox mediator and a H2O2 selective metalloprotein. This structural complexity translates into its functionality analysis as the presence or absence of interfacial nanomaterials and additional redox mediators can transform a simple solution electrode transfer process into a redox cascade mechanism. Secondly, the previously detailed differences between sensor generations have an impact on the instrumental demands, where the accessibility to nanomaterials, enzymes or surface functionalization reagents in laboratory courses may be limited. As a result, designing laboratory experiences involving electrochemical sensing should consider its conceptual complexity while minimizing the instrumental demands as much as possible, if one desires to guarantee its accessibility to broader students’ demographics.

This work presents an experiential learning proposal that allows students to understand from a theoretical and practical perspective the core concepts of quantitative electrochemical sensing characterization and performance analysis through obtaining analytical figures of merit, using an H2O2 sensitive low-cost ferrite powder first generation electrode. The proposed laboratory protocol is suitable for graduate/upper-level undergraduate physical or analytical chemistry courses and was designed to be conducted in groups of two to three students over a four-hour period, allowing the completion of theoretical background exposition, hands-on experience, and a closing questionnaire.

Equipment and Materials

All chemicals were of analytical grade and used without further purification. Using a three-electrode electrochemical cell scheme, a Pt foil with an area of 5 cm2 was used as the counter electrode (CE) and a silver/ silver chloride electrode (Ag|AgCl|1 M KCl) was used as a reference electrode (RE). Polyvinylpyrrolidone (PVP K30, Anedra, Argentina) and a commercial, technical grade ferrite powder (Pilar Aquarel, Argentina) mainly composed of a mixed iron oxide (Fe3O4) were used for the preparation of the working electrode (WE). Ferrite powder dispersions were mixed with a 20% w/v waterborne PVP stock solution to obtain a ferrite to PVP mass ratio of 1:10 and the ferrite/PVP formulation was drop-casted onto either a glassy carbon (GC) or platinum (optional) rotating disc electrode (5mm diameter) which were dried overnight at room temperature or after 5-10 minutes using a portable electric space heater.

Electrochemical voltammetric and amperometric measurements and data acquisition were carried out using a Teq4 potentiostat (NanoTeq, Argentina), while data processing was performed using OriginLab.

Hazards

All chemicals used are harmful if swallowed and cause eye and skin irritation on contact. H2O2 is an oxidizer, unstable and light-sensitive reagent so it must be stored in a refrigeration unit, away from the other chemicals. If a refrigeration unit were unavailable, any dark, cool, and dry space will suffice during the development of the experimental protocol. Under these considerations, students must read the respective reagents safety sheets via their preferred material safety data sheet (MSDS) database to guarantee their proper handling and are required to bring personal protective equipment including a lab coat, safety goggles and disposable latex gloves, which must be worn during the whole experimental procedure.

Reported Results Considerations

As stated before, reported experiments were carried out drop-casting 10 μL of a ferrite/PVP formulation onto a GC rotating disc electrode (5 mm diameter). Both working electrode’s face up and face down schemes are suitable to reproduce the proposed protocol without any issues. In case of wire-like working electrodes, further experimentation should be conducted to formulate a ferrite/PVP composite whose viscosity level guarantees both adherence to the electrodes’ surface and stability during the measurement process. Furthermore, considering the possible variability in the composition of commercial ferrites, the reported values may differ, requiring modifications in parameters such as the concentrations of hydrogen peroxide and interferents. Due to the aformentioned considerations, it is recommended to carry out a test run of the experiment before conducting the laboratory work with students.

Laboratory Protocol Overview

Figure 1 illustrates the overall scheme of the laboratory protocol which can be separated into two sections. The theoretical section (Fig. 1A) consists of a brief review of several electrochemical techniques including cyclic voltammetry and chronoamperometry to introduce H2O2 electrochemical sensing. Lastly, both concepts converge when presenting from theoretical and operational perspectives the electrochemical performance validation techniques known as electroanalytical figures of merit.

Figure 1 Flowchart illustrating the theoretical (A) and experiential (B) sections of the laboratory 

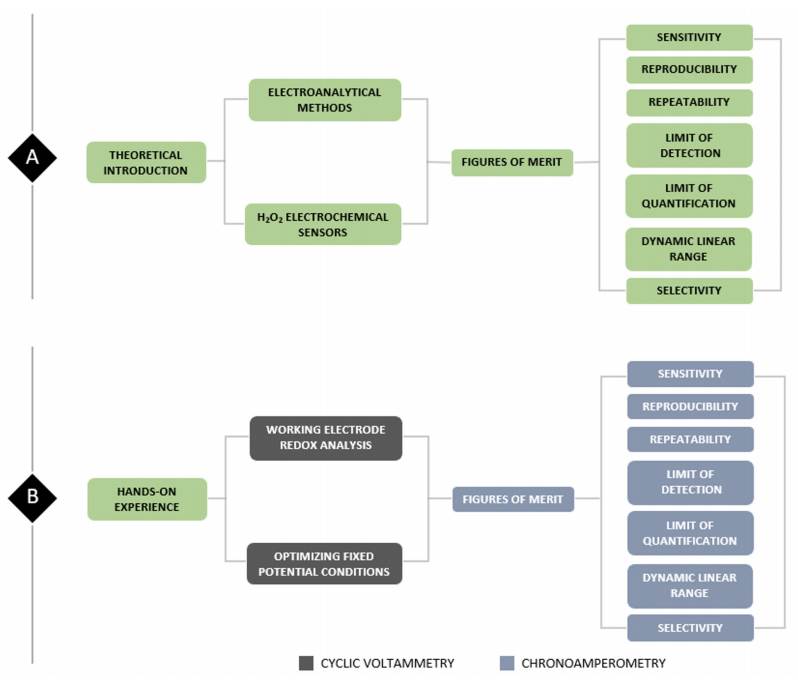
On the other hand, the experiential (Fig. 1B) section proposes a hands-on experience where students are required to implement the acquired theoretical background and develop technical and analytical skills regarding electrochemical sensors’ figures of merit. This section contains an additional resource called “Windows of Opportunity” (WO), which contains additional activities to conceptually enrich the laboratory experience and are put to the teacher’s consideration. Further guidelines about this additional resource can be found in the Supporting Info - Laboratory Protocol with Questionnaire Solutions file.

Theoretical Section

Designing this didactic proposal as a continuation of Hendel and Elgrishi works (Elgrishi et al. 2018; Hendel and Young 2016), students are required to present a solid background knowledge on electrochemical cells, cyclic voltammetry, electrode potential scanning and coupled chemical reactions. In case of a needed conceptual reinforcement adding extracts of Bard’s Electrochemical Methods: Fundamentals and Applications chapters 4 to 6 into the main texts is recommended (Bard and Faulkner 2001).

The introductory review focuses on two electroanalytical techniques, cyclic voltammetry (CV) and chronoamperometry (Behzad and Neda 2019; Choudhary et al. 2017), which measure faradaic current because of either oxidation or reduction processes of an electroactive analyte at the WE surface, allowing a quantitative and qualitative study to be carried out.

CV is one of the most common electrochemical techniques which measures current changes by sweeping fixed potential windows back and forth. The graphical information provided by CV (i.e., current vs. electrode potential plots called voltammograms) can be used to understand the WE basic electrochemical properties such as capacitive behavior and reversibility, or to identify anodic/cathodic redox peaks which imply that the analyte or material on the WE surface is going through oxidation and reduction processes respectively. On the other hand, chronoamperometry is a frequently reported amperometric method generally used alongside CV. In this technique, a pulse potential is applied to a working electrode establishing a fixed potential difference at the electrode/electrolyte interface and the associated current values are recorded versus time. Measured current shows fluctuations over time in response to the diffusion process of the analyte of interest at WE surface, allowing for an in-depth analysis of diffusion-controlled processes.

Before following with a general introduction of H2O2 electrochemical sensors, a moderate understanding of its redox chemistry and behavior is required. Under a neutral medium (pH 7) and versus a saturated calomel reference electrode (SCE), H2O2 two-electron half reactions can be described as follows:

The standard redox potential for the reduction of H2O2 to water [1] is considerably high. This, from a thermodynamic perspective, would imply that H2O2 can be reduced by a wide spectrum of materials. However, redox systems with H2O2 under neutral conditions are not thermodynamically driven but mainly kinetically (Winterbourn 2013). As a result, slow kinetics involved in electrochemical electron transfer leads to very high over-potentials during H2O2 sensing, and this fact is particularly evident at bare metal electrodes whose voltammetric profiles only show a single irreversible cathodic peak (Chen et al. 2013). Due to the kinetic restrictions, metal oxides and carbon structures are attached to the WE to accelerate the H2O2 redox process up to reversible or quasi-reversible conditions (Veiga et al. 2020; Zhang et al. 2011).

H2O2+2H++2e-2h2O    E=+1.531  V  vs  SCE [1]

H2O2+O2+2h+2e-    E=+0.440  V  vs  SCE [2]

The development of working electrodes whose composition eases H2O2 sensing led to the design of three standard structures classified by Gulaboski as first, second and third generation H2O2 electrochemical sensors (Gulaboski et al. 2019).

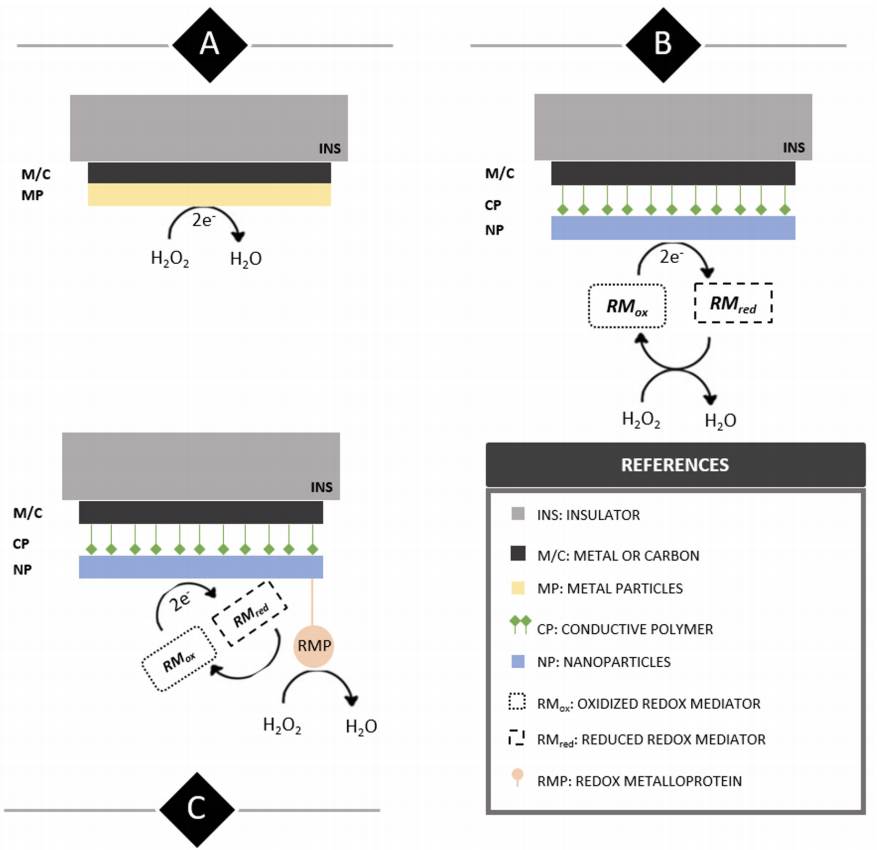
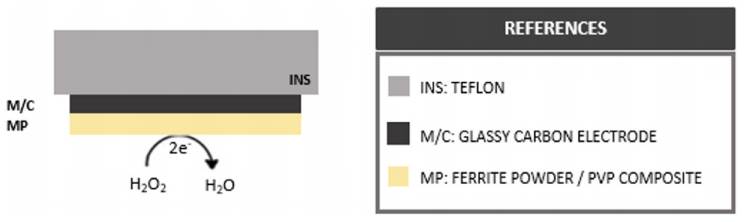
Figure 2 Illustrative side view display of structural and functional differences between first (A), second (B) and third generation (C) H2O2 electrochemical sensors. 

First generation electrochemical H2O2 sensors’ working electrodes present successive layers of an insulator (INS) such as polytetrafluoroethylene (PTFE) and a bare metal or carbon surface (M/C) modified with the addition of metallic or metal oxide particles (MP) to increase the electroactive area and analyte sensitivity. From a methodological perspective, analyte quantification is pretty much straightforward and involves performing amperometric or voltammetric techniques in an electrolyte buffer containing H2O2 . On the other hand, second generation working electrodes present surface modifications including a layer of conductive polymer (CP) such as polyaniline (PANI) to which nanomaterials (NP) like multi-walled carbon nanotubes (MWCNT) easily attach and increase the WE electroactive area. In this case, measurements are performed indirectly by the presence of a redox mediator added to the electrolyte buffer (RM) which partakes in a redox cycle under the presence of H2O2 and transfers the process-resulting electrodes to the WE surface.

Lastly, third generation sensors share the same components as those of second-generation ones, but their surface is further functionalized by adding a redox metalloprotein (RMP) such as horseradish peroxidase with high selectivity towards H2O2. Analyte measurements are generally carried out at a fixed potential and quantification is indirect through an electron transfer cascade that starts with the enzymatic reduction of H2O2 and continues via electron transfer thus reducing the redox mediator close to the WE surface.

Once the electrochemical sensors’ structural and functional characteristics are presented the next criteria to develop is what parameters are indicators of its quality and performance. According to Luong for an electrochemical sensor to be effectively transferred into its respective fields of application the device must meet three criteria: adjusting costs, reducing technological barriers, and presenting an adequate analytical validation (Luong et al. 2008). In analytical chemistry, validation is an essential procedure to guarantee closeness between an analyte’s unknown true value and the results obtained from the proposed method. Electrochemical methods can be validated by assessing their figures of merit, which are quantifiable related both to the methodology and analyte of interest (Olivieri et al. 2006). For the present didactic proposal, the determination of the following figures of merit has been selected: sensitivity, reproducibility, repeatability, dynamic linear range (DLR), limit of detection (LOD), limit of quantification (LOQ) and selectivity.

Sensitivity and selectivity are parameters used for assessing an electrochemical sensor’s reliability. The sensitivity towards a given analyte is defined as the slope of the analytical calibration curve, while from a method perspective this concept can be interpreted as a signal change after an analyte concentration variation within a linear regime. This linear regime is known as the dynamic linear range and extends from the LOQ up to the limit of linearity (LOL) where the measured signal does not present a linear dependency with the analyte concentration anymore. On the other hand, selectivity is defined as the ratio of the measured signal between the analyte of interest and a particular interferent. Under these criteria, a method is selective when it can accurately quantify the analyte of interest under the presence of interferences, whose contributions to the measured signal are negligible.

Repeatability and reproducibility, in terms of electrochemical sensors, refer to the proximity between the sensitivity results obtained from successive measurements of the same analyte under the same (repeatability) or different (reproducibility) conditions related to operators and instrumental (McNaught and Wilkinson 1997). Finally, and as closure for the theoretical section, the LOD refers to the minimum detectable concentration for a given analytical procedure, while the LOQ is the lowest analyte concentration that can be quantitatively detected with a considerable degree of accuracy and precision.

Experiential Section

Methodologically speaking, the hands-on experience is divided into two sections. Firstly, students are required to perform a voltammetric study of the working electrode allowing both a basic understanding of the redox processes occurring at the WE surface and selecting the appropriate fixed potential condition to continue with the electrochemical sensing of the H2O2 reduction. Secondly, previously detailed figures of merit will be obtained and analyzed by students via chronoamperometry. The information obtained from these determinations will allow a conclusion to be drawn regarding the ferrite powder/PVP sensing performance towards H2O2 .

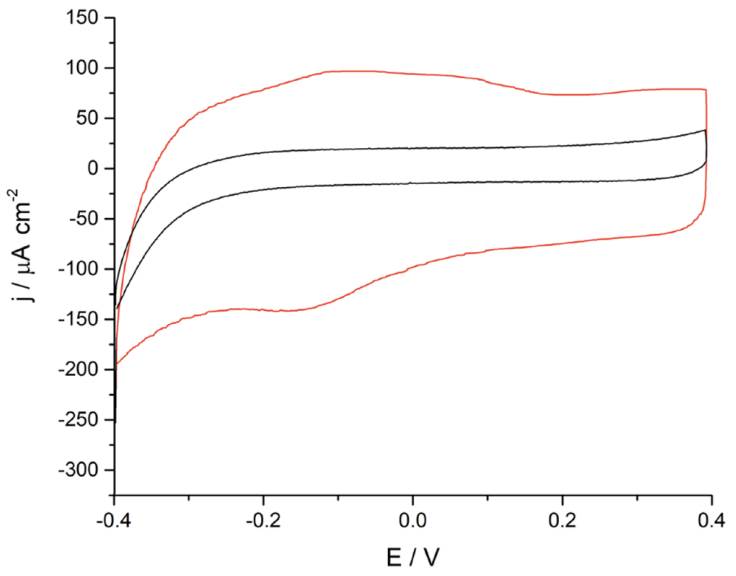
The voltammetric study begins as illustrated by Figure 3A where students compare the voltammetric profiles between a bare and a ferrite/PVP drop-casted glassy carbon electrode in 0.1 M phosphate buffer solution of pH 7.4 at a scan rate of 0.05 V s-1. A brief analysis of the graphical results shows that the ferrite/PVP electrode displayed an increased capacitive behavior due to its rectangle-shaped voltammogram and increased current values when compared to the bare GC electrode. Furthermore, the proposed WE shows an anodic peak around -0.1 V and a cathodic peak at -0.16 V, which considering the ferrite composition could be assigned to the oxidation of Fe2+ to Fe3+ and the further reduction of Fe3+ to Fe2+. These well-defined redox peaks allow students to construct a potential window map displayed in Figure 3B to select the appropriate chronoamperometry measurement conditions towards H2O2 reduction. In this case, an appropriate fixed potential selection is -0.25 V, as it is a constant region of the voltammogram where ferrite acts as a reducing agent, meaning that its preponderant redox species is Fe2+.

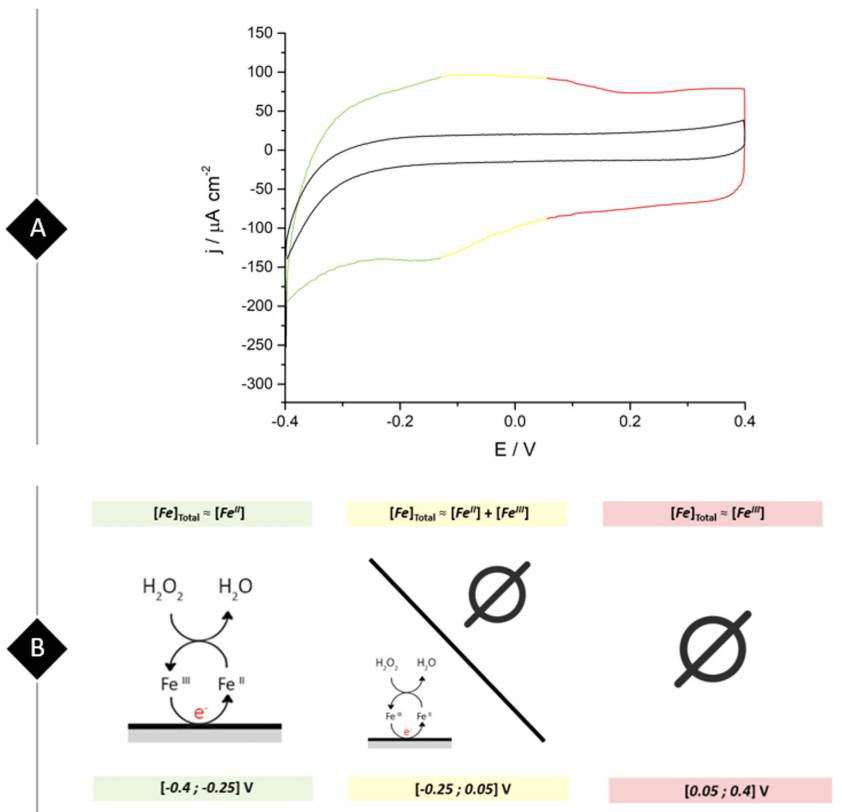
Figure 3 (A) Cyclic voltammogram obtained at a bare (black line) and ferrite/PVP (three-colored) drop-casted glassy carbon electrode in a 0.1 M phosphate buffer solution of pH 7.4 at a scan rate of 0.05 V s-1. (B) Potential-dependent working electrode redox behavior towards H2O2 reduction in correlation to the voltammogram colored regions. 

WO #1: Voltammetric analysis of the ferrite/PVP working electrode can be further developed. The selection of the fixed potencial for chronoamperometry can be performed by recording several voltammetric profiles after the successive addition of 0.1 mM H2O2 to analyze the evolution of the cathodic peak.

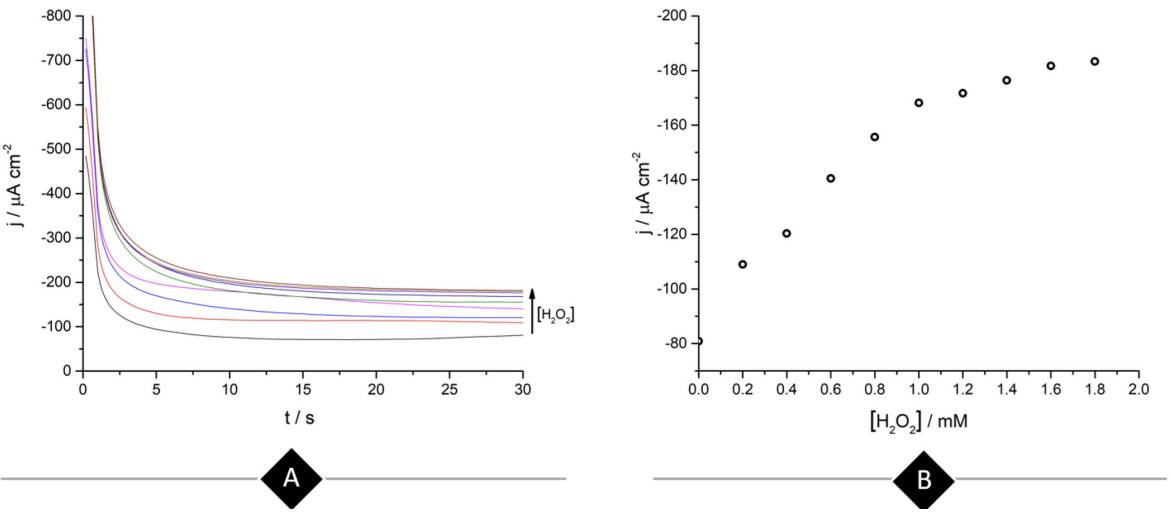
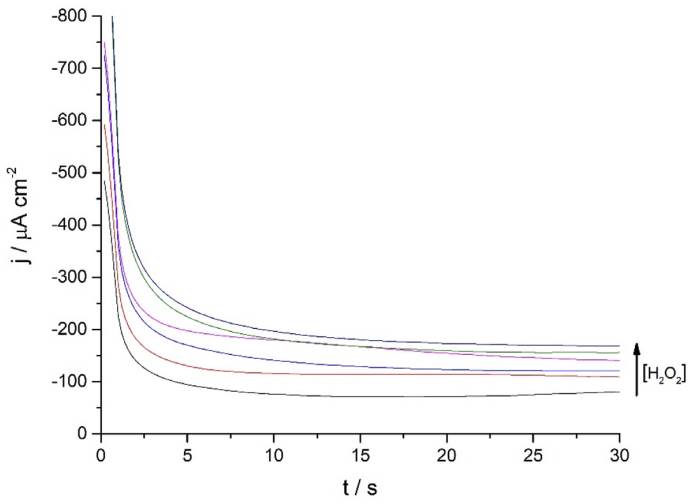
Continuing with the amperometric studies, students begin by analyzing the WE sensitivity, repeatability, and reproducibility. Figure 4A shows ferrite/PVP WE current density-time curves in a 0.1 M phosphate buffer solution of pH 7.4 at -0.25 V after the successive addition of 0.2 mM H2O2 up to 1mM. This analyte concentrations window was previously tested to guarantee the desired linear current concentration response up to the LOL (check Supporting Info - Additional Figures for further graphic information), facilitating students’ curve-fitting and sensitivity values calculation, expressed as µA cm2 mM-1.

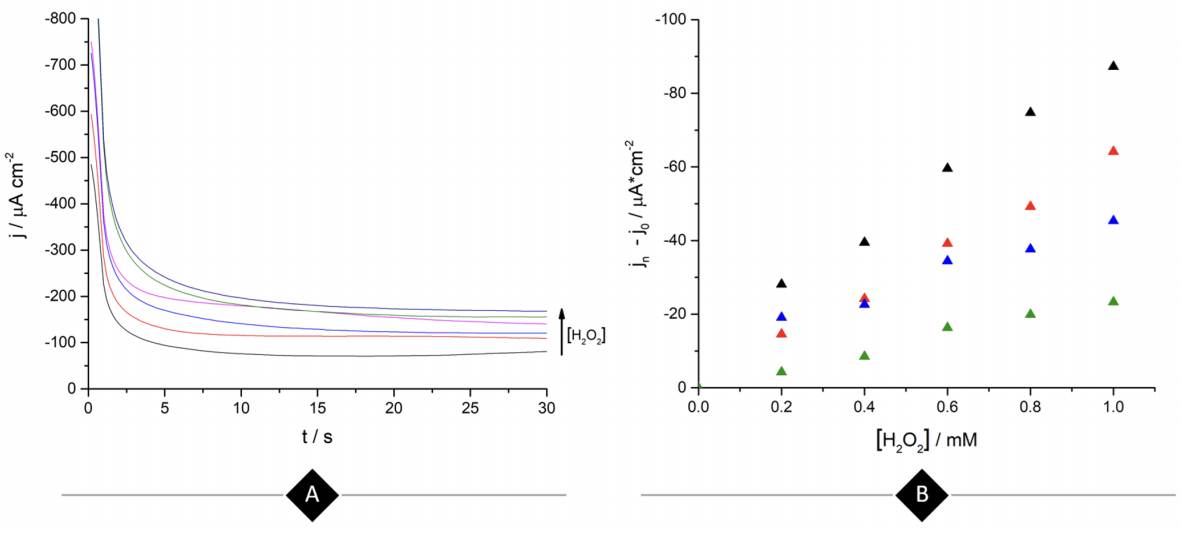
Figure 4 (A) Ferrite/PVP WE current density-time curves of 0.1 M phosphate buffer solution of pH 7.4 at -0.25 V after the successive addition of 0.2 mM H2O2 up to 1mM. (B) Repeatability of the ferrite/PVP WE studied by measuring the linear dependence of current density with H2O2 concentration at -0.25 V (Jn) adjusted by the blank’s current density values (Jo). Repetitions 1 to 4 are represented by black, red, blue, and green colored triangles, respectively. 

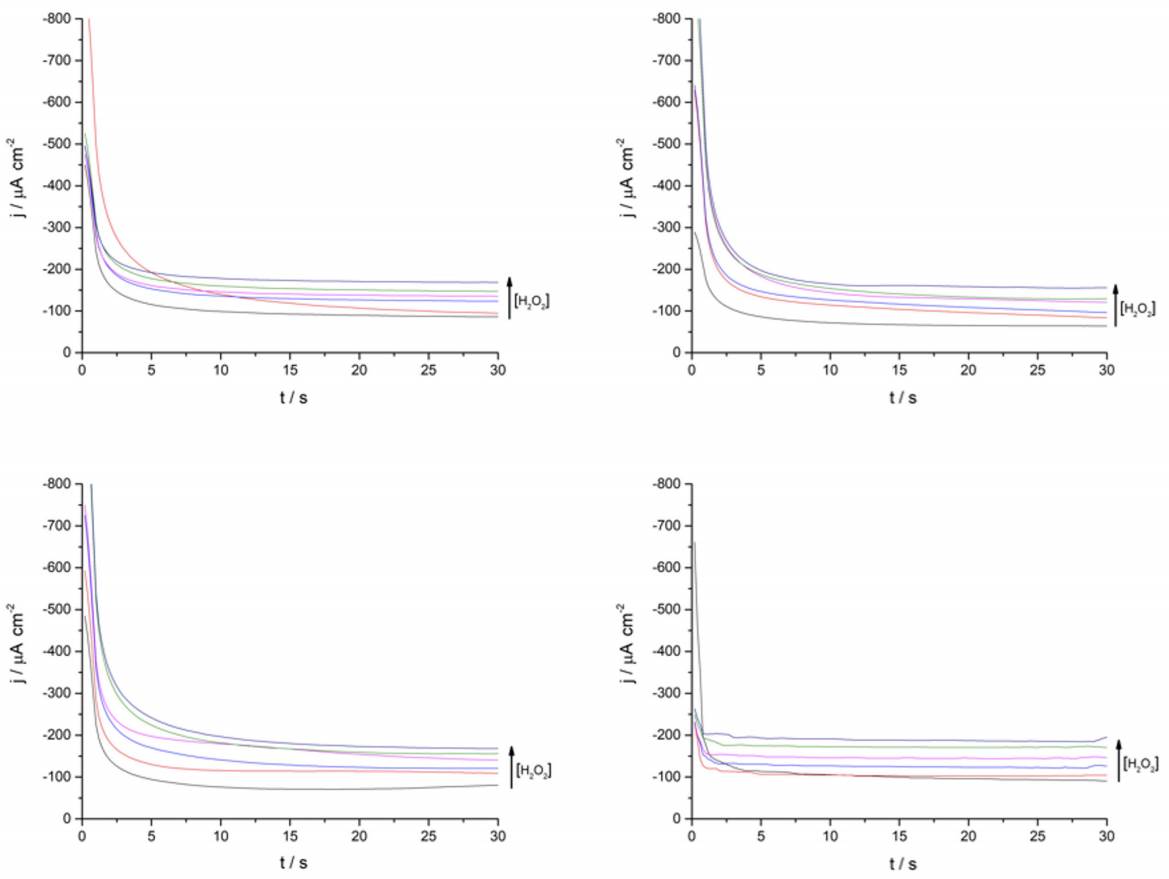
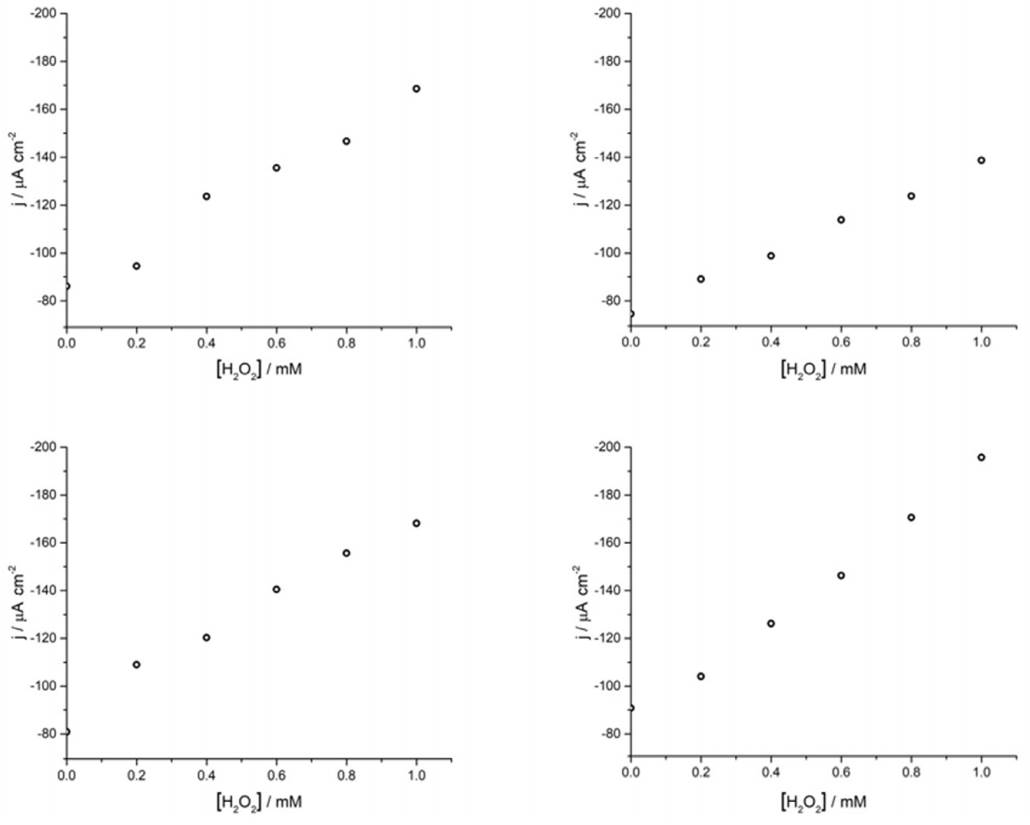
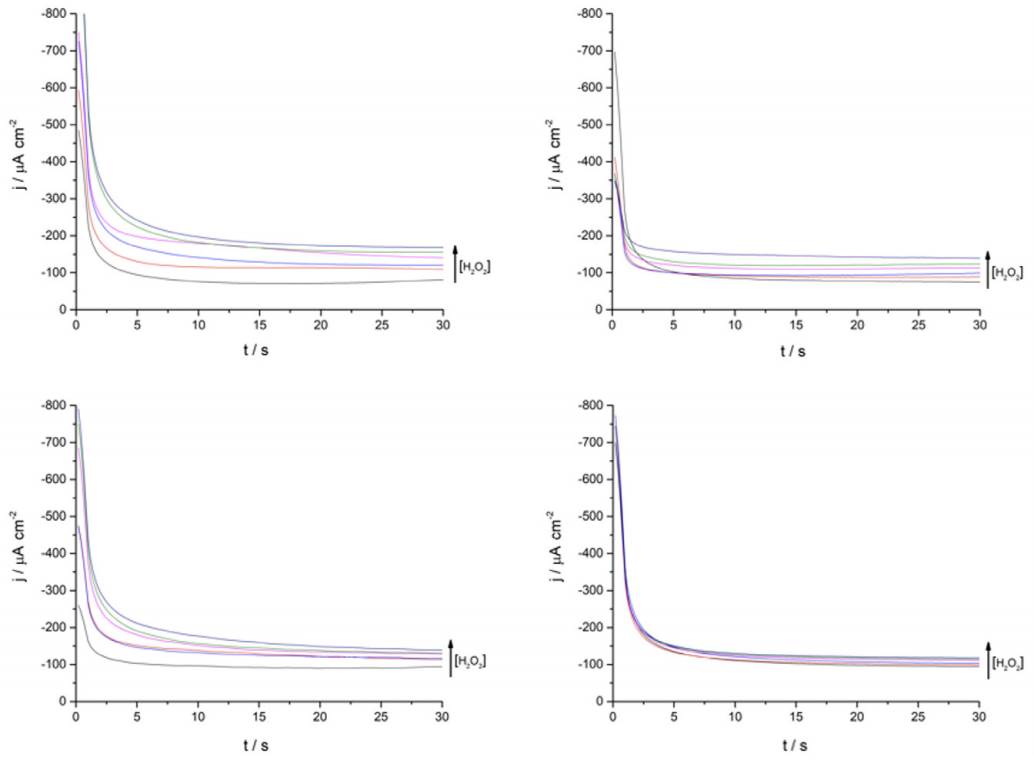
Later, students perform repeatability and reproducibility validations by simply repeating (n=4) the determination either by using the same drop-casted WE (repeatability) or cleaning the glassy carbon electrode after each measurement and drop-casting a new ferrite electroactive layer (reproducibility). Figure 4A displays repeatability essay results, showing a linear dependence between current density measured at -0.25 V with H2O2 concentration which presents students with a case of a gradual sensitivity loss percentage up to 73% when comparing successive sensitivity values obtained from linear regressions (Supporting Info - Additional Figures - Table 2). This can be attributed to the dissolution of particles from the electrode to the buffer solution after consecutive measurements.

WO #2: Chronoamperometric results show a typical transient response profile to an applied potential step, whit the particularity that rather than the current falling off to zero as predicted by the Cottrell equation, measured current flactuates around a steady current value (Bard and Faulker 2001). This could indicate eigther slow WE kinetics or well-mixed bulk solution that preserves a constant concentration of electroactive species. Obtained chronoamperometric data can be further analyzed from a theoretical transport/kinetic perspective.

To obtain the LOD and LOQ, students follow a simple signal-to-noise ratio procedure measuring the 10 chronoamperometric blank determinations at -0.25 V, which in this case refers to 0.1 M phosphate buffer solution of pH 7.4 and then perform a simple mathematical operation [3-4]. Here SD refers to the standard deviation of the blank determinations and m to the slope of the analyte calibration curve. With the figures of merit obtained so far and considering 1mM of H2O2 as the limit of linearity, students will be able to report the dynamic linear range (Miller and Miller 2005).

LOD=3SDBlanckmSensitivity [3]

LOQ=10SDBlanckmSensitivity [4]

Selectivity=Jn-J0InterferentJn-J0H2O2 [5]

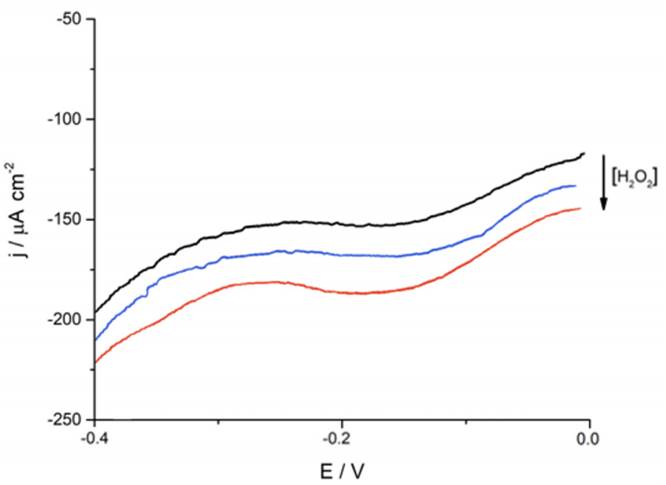
Consecutively, students carry out selectivity studies by comparing the current-potential curves of commonly reported interferents (He et al. 2019; Meng et al. 2015) such as KCl + Na2SO4, ascorbic acid and glucose against the analyte of interest (Fig. 5). For this essay to be representative the tested interferents’ concentration was ten times higher than that of H2O2 and sensitivity results were expressed as a ratio between the current density changes after the addition of 2mM of the tested interferent and 0.2 mM H2O2 [5].

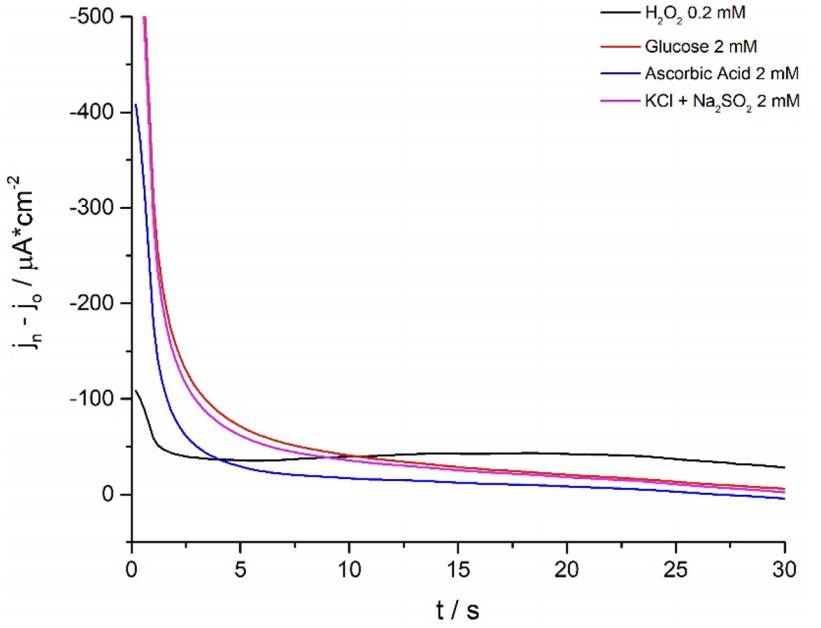
Figure 5 Ferrite/PVP WE current density-time curves of 0.1 M phosphate buffer solution of pH 7.4 at -0.25 V after the addition of 0,20 mM H2O2 (black line); 2,0 mM of KCl + Na2SO4, ascorbic acid and glucose (magenta, blue and red-colored lines, respectively). Results are expressed as the current density difference before (Jo) and after the addition of the respective analytes (Jn). 

Finally, the different groups of students share a brief report containing obtained parameters (Table 1), making comparisons, and analyzing possible differences with their peers. This simulated interlaboratory situation constitutes a space where students can discuss theoretical and technical aspects regarding the performed measurements, while a brief conclusion about the tested working electrode can be elaborated. As shown in Table 1, the proposed ferrite/PVP electrochemical sensor presents highly reproducible sensitivity values but due to the interference analysis and repeatability results its use is limited to one-use for samples previously treated for common interferences. Additional graphical information associated with the reported values is available in the Supporting Info - Additional Figures.

Table 1 Data report corresponding to the analytical figures of merit of a drop-casted ferrite/PVP glassy carbon working electrode. 

FERRITE/PVP ELECTROCHEMICAL SENSOR - ANALYTICAL FIGURES OF MERIT REPORT
Sensitivity / µA cm2 mM-1 LOD / mM LOQ / mM DLR / mM Selectivity
Reproducibility Repeatability KCl + Na2SO4 Asc. Acid Glucose
90.80 ± 10.63 54.81 ± 28.21 0.04 ± 0.01 0.13 ± 0.03 0.13 - 1 0.08 0.15 0.21

WO #3: Taking advantage of the acceptable H2O2 sensing performance of the electrochemical sensor studied, the proposed laboratory practice can be further contextualized through real-world applications. With this purpose, an additional activity consists of testing the ferrite/PVP electrochemical H2O2 sensing capabilities in commercial samples such as pharmaceutical hydrogen peroxide as a validation procedure towards reported concentrations.

Conclusion

Through the selection of electrochemical sensing as the topic of interest, this work responds to the need of contextualizing laboratory practices through real-world applications to hopefully provide teachers with instrumental, theoretical, and didactical resources to accompany their endeavor to implement electrochemical practices in both graduate and undergraduate curriculum. Presenting an integrative approach, comprising a theoretical introduction, experiential practice and post-lab results discussion, this protocol expects to facilitate the understanding of quantitative electrochemical sensing characterization and performance analysis. Basic electroanalytic concepts that students will be able to transfer effectively while performing future electrochemical practices.

References

Bard, A. J., Faulkner, L. R. (2011) Electrochemical Methods: Fundamentals and Applications, 2nd ed., Wiley: New York. [ Links ]

Behzad, R., Neda, I. (2019). Chapter 2: Electrochemical detection techniques in biosensor applications in Electrochemical Biosensors. Elsevier, 11-43; https://doi.org/10.1016/B978-0-12-816491-4.00002-4. [ Links ]

Chen, S., Yuan, R., Chai, Y. (2013). Electrochemical sensing of hydrogen peroxide using metal nanoparticles: a review. Microchim Acta., 180, 15-32; https://doi.org/10.1007/s00604-012-0904-4. [ Links ]

Choudhary, Y., Lavanya, J., Nageswaran, G. (2017). Chapter 2: Electrochemical Characterization in Spectroscopic Methods for Nanomaterials Characterization; https://doi.org/10.1016/B978-0-323-46140-5.00002-9. [ Links ]

Dang, W., Sun, T., Jiao, H., Xu, L., Lin, M. (2020). AuNPs-NH2/Cu-MOF modified glassy carbon electrode as enzyme-free electrochemical sensor detecting H2O2. Journal of Electroanalytical Chemistry, 856; https://doi.org/10.1016/j.jelechem.2019.113592. [ Links ]

Eliaz, N., Gileadi, E. (2019). Physical electrochemistry: fundamentals, techniques, and applications. Wiley-VCH: Germany. [ Links ]

Elgrishi, N., Rountree, K., McCarthy, B., Rountree, E., Eisenhart, T., Dempsey, J. (2018). A Practical Beginner’s Guide to Cyclic Voltammetry. J. Chem. Educ., 95 (2), 197-206; https://doi.org/10.1021/acs.jchemed.7b00361. [ Links ]

Espro, C., Marini, S., Guisi, D., Ampelli, C., Neri, G. (2020). Non-enzymatic screen-printed sensor based on Cu2O nanocubes for glucose determination in bio-fermentation processes. Journal of Electroanalytical Chemistry, 873, 114354. https://doi.org/10.1016/j.jelechem.2020.114354 [ Links ]

Garate, O., Veiga, L., Medrano, A., Longinotti, G., Ybarra, G., Monsalve, L. (2018). Waterborne carbon nanotube ink for the preparation of electrodes with applications in electrocatalysis and enzymatic biosensing, Materials Research Bulletin, 106, 137-143; https://doi.org/10.1016/j.materresbull.2018.05.015. [ Links ]

Gulaboski, R., Mircesky, V., Kappl, R., Hoth, M., Bozem, M. (2019). Review-Quantification of Hydrogen Peroxide by Electrochemical Methods and Electron Spin Resonance Spectroscopy. Journal of The Electrochemical Society, 166(8), 82-101; http://dx.doi.org/10.1149/2.1061908jes. [ Links ]

He, G., Gao, F., Li, W., Li, P., Zhang, X., Yin, H., Yang, B., Liu, Y, Zhang, S. (2019). Electrochemical sensing of H2O2 released from living cells based on AuPd alloy-modified PDA nanotubes. Anal. Methods, 11, 1651-1656; https://doi.org/10.1039/C8AY02743A. [ Links ]

Hendel, S.J., Young, E. (2016). Introduction to Electrochemistry and the Use of Electrochemistry to Synthesize and Evaluate Catalysts for Water Oxidation and Reduction. J. Chem. Educ., 93 (11), 1951-1956; https://doi.org/10.1021/acs.jchemed.6b00230. [ Links ]

Justino, C., Rocha-Santos, T., Duarte, A. (2010). Review of analytical figures of merit of sensors and biosensors in clinical applications, TrAC Trends in Analytical Chemistry, 29 (10), 1172-1183; https://doi.org/10.1016/j.trac.2010.07.008. [ Links ]

Kang, W., Pei, X., Rusinek, C., Bangel, A., Haynes, E., Heineman, W., Papautsky, I. (2017). Determination of Lead with a Copper-Based Electrochemical Sensor. Anal. Chem., 89 (6), 3345-3352; https://doi.org/10.1021/acs.analchem.6b03894. [ Links ]

Kim, H., Kim, J., Park, S., Kang, J., Kim, S., Choi, Y., Shin, U. (2019). Carbon nanotubes immobilized on gold electrode as an electrochemical humidity sensor, Sensors, and Actuators B: Chemical, 300; https://doi.org/10.1016/j.snb.2019.127049. [ Links ]

Luong, J., Male, K., Glennon, J. (2008). Biosensor technology: technology push versus market pull. Biotechnol Adv., 26 (5), 492-500; https://doi.org/10.1016/j.biotechadv.2008.05.007. [ Links ]

Lyu, Q., Zhai, Q., Dyson, J., Gong, S., Zhao, Y., Ling, Y., Chandrasekaran, R., Dong, D., Cheng, W. (2019). Real-Time and In-Situ Monitoring of H2O2 Release from Living Cells by a Stretchable Electrochemical Biosensor Based on Vertically Aligned Gold Nanowires. Anal. Chem., 91 (21), 13521-13527; https://doi.org/10.1021/acs.analchem.9b02610. [ Links ]

McNaught, A., Wilkinson , (1997). A. IUPAC/Compendium of Chemical Terminology (The ‘‘Gold Book’’), 2nd ed., Blackwell Scientific Publications, Oxford, UK. [ Links ]

Meng, L., Jiang, D., Xing, C., Lüa X., Chen, M. (2015). Synthesis and size-dependent electrochemical nonenzymatic H2O2 sensing of cuprous oxide nanocubes. RSC Adv., 5, 82496-82502; https://doi.org/10.1039/C5RA14373J. [ Links ]

Miller, J. N., Miller, J. C. (2005) Statistics and chemometrics for analytical chemistry. Harlow, England: Pearson/Prentice Hall. [ Links ]

Olivieri, A., Faber, N., Ricard J.F., Kalivas, J., Howard, M. (2006). Uncertainty estimation and figures of merit for multivariate calibration (IUPAC Technical Report) , 78 (3), 633-661; https://doi.org/10.1351/pac200678030633. [ Links ]

Patella, B., Buscetta, M., Di Vincenzo, S., Ferraro, M., Aiello, G., Sunseri, C., Inguanta, R., Cipollina, C. (2021). Electrochemical sensor based on rGO/Au nanoparticles for monitoring H2O2 released by human macrophages, Sensors, and Actuators B: Chemical., 327; https://doi.org/10.1016/j.snb.2020.128901. [ Links ]

Peng, L., Luo, H., Xiong, H., Yao, S., Zhu, M., Song, H. (2021). A Novel Amperometric Glucose Biosensor Based on Fe3O4-Chitosan-β-Cyclodextrin/MWCNTs Nanobiocomposite. Electroanalysis, 33, 723. https://doi.org/10.1002/elan.202060399 [ Links ]

Rivas, L., Dulay, S., Miserere, S., Pla, L., Marin, S., Parra, J., Eixarch, E., Gratacós, E., Illa, M., Mir, M., Samitier, J. (2020). Micro-needle implantable electrochemical oxygen sensor: ex-vivo and in-vivo studies. Biosensors and Bioelectronics, 153; https://doi.org/10.1016/j.bios.2020.112028. [ Links ]

Sarhan, M., El-Nagar, G., Abouserie, A., Roth, C. (2019). Silver-Iron Hierarchical Microflowers for Highly Efficient H2O2 Nonenzymatic Amperometric Detection. ACS Sustainable Chem. Eng., 7 (4), 4335-4342; https://doi.org/10.1021/acssuschemeng.8b06182. [ Links ]

Saxena, S., Satsangee, S. (2014). Offering Remotely Triggered, Real-Time Experiments in Electrochemistry for Distance Learners. J. Chem. Educ., 91 (3), 368-373; https://doi.org/10.1021/ed300349t. [ Links ]

Soto, D., Alzate, M., Gallego, J., Orozco, J. (2021) Hybrid nanomaterial/catalase-modified electrode for hydrogen peroxide sensing, Journal of Electroanalytical Chemistry, 880; https://doi.org/10.1016/j.jelechem.2020.114826. [ Links ]

Vaneev, A., Gorelkin, P., Garanina, A., Lopatukhina, H., Vodopyanov, S., Alova, A., Ryabaya, O., Akasov R., Zhang, Y., Novak, P., Salikhov, S., Abakumov, M., Takahashi, Y., Edwards, C., Klyachko, N., Majouga, A., Korchev, Y., Erofeev, A. (2020). In Vitro and In Vivo Electrochemical Measurement of Reactive Oxygen Species After Treatment with Anticancer Drugs. Anal. Chem., 92 (12), 8010-8014; https://doi.org/10.1021/acs.analchem.0c01256. [ Links ]

Veiga, L. S., Garate, O., Tancredi, P., Monsalve, L. N., Ybarra, G. (2020). Performance of cuprous oxide mesoparticles with different morphologies as catalysts in a carbon nanotube ink for printing electrochemical sensors. Journal of Alloys and Compounds, 847; https://doi.org/10.1016/j.jallcom.2020.156449. [ Links ]

Waifalkar, P., Chougale, A., Kollu, P., Patil, P.S., Patil, P.B. (2018). Magnetic nanoparticle decorated graphene based electrochemical nanobiosensor for H2O2 sensing using HRP. Colloids and Surfaces B: Biointerfaces, 167, 425-431; https://doi.org/10.1016/j.colsurfb.2018.04.042. [ Links ]

Winterbourn, C. (2013). The biological chemistry of hydrogen peroxide. Methods Enzymol., 528, 3-25; https://doi.org/10.1016/B978-0-12-405881-1.00001-X. [ Links ]

Xu, W., Sakran, M., Fei, J., Li, X., Weng, C., Yang, W., Zhu, G., Zhu, W., Zhou, X. (2021). Electrochemical Biosensor Based on HRP/Ti3C2/Nafion Film for Determination of Hydrogen Peroxide in Serum Samples of Patients with Acute Myocardial Infarction. ACS Biomater. Sci. Eng., 6, 2767-2773; https://doi.org/10.1021/acsbiomaterials.1c00242. [ Links ]

Yang, K., Zhong, h., Cheng, Z., Li, X., Zhang, A., Li, T., Zhang, Y., Liu, G., Qian, H. (2018) Magnetic Fe3O4 stacked sphere-like nanocomposite and its application as platform for H2O2 sensing, Journal of Electroanalytical Chemistry., 814, 1-6; https://doi.org/10.1016/j.jelechem.2018.02.040. [ Links ]

Zhang, J., Sun, Y., Li, X., Xu, J. (2020). Fabrication of NiCo2O4 nanobelt by a chemical co-precipitation method for non-enzymatic glucose electrochemical sensor application, Journal of Alloys, and Compounds, 831; https://doi.org/10.1016/j.jallcom.2020.154796. [ Links ]

Zhang, X., Ju, H., Wang, J. (2011). Electrochemical Sensors, Biosensors and their Biomedical Applications, Elsevier Science. [ Links ]

Cómo citar: Garate, Octavio, Veiga, Lionel S., Tancredi, Pablo e Ybarra, Gabriel. (2022, abril-junio). Understanding the electrochemical sensors’ figures of merit using a H2O2 sensitive, low-cost ferrite powder first generation electrode. Educación Química, 33(2). http://dx.doi.org/10.22201/fq.18708404e.2022.2.80070

Additional Figures

Understanding the electrochemical sensors’ figures of merit using a H2O2 sensitive, low-cost ferrite powder first generation electrode

Figure 1 H2O2 linear range and limit of linearity determination pre-lab test: (A) Ferrite/PVP WE current density-time curves in a 0.1 M phosphate buffer solution of pH 7.4 at -0.25 V after the successive addition of 0.2 mM H2O2 up to 1.8 mM. (B) Associated linear dependence between current density and H2O2 concentration at -0.25 V for a ferrite/PVP WE. 

Figure 2 Reproducibility Essay: ferrite/PVP WE current density-time curves in a 0.1 M phosphate buffer solution of pH 7.4 at -0.25 V after the successive addition of 0.2 mM H2O2 up to 1mM. This determination was performed in quadruplicate runs renewing the electroactive layer of ferrite/PVP in-between measurements. 

Table 1 Data report corresponding to the drop-casted ferrite/PVP glassy carbon working electrode reproducibility analysis. 

Working Electrode Number Sensitivity / µA cm2 mM-1
1 85.20
2 88.75
3 106.33
4 82.90
Average 90.80
Standard Deviation 18.63

Figure 3 Reproducibility Essay: Figure 2 associated linear dependence between current density and H2O2 concentration at -0.25 V for a ferrite/PVP WE. This determination was performed in quadruplicate runs renewing the electroactive layer of ferrite/PVP in-between measurements. 

Figure 4 Repeatability Essay: Ferrite/PVP WE current density-time curves in a 0.1 M phosphate buffer solution of pH 7.4 at -0.25 V after the successive addition of 0.2 mM H2O2 up to 1mM. This determination was performed in quadruplicate runs using the same electroactive layer of ferrite/PVP drop-casted onto a GC electrode. 

Table 2 Data report corresponding to the drop-casted ferrite/PVP glassy carbon working electrode repeatability analysis. 

Repetition Number Sensitivity / µA cm2 mM-1
1 90
2 62.80
3 42.06
4 24.42
Average 54.81
Standard Deviation 28.21

Table 3 Data report corresponding to the drop-casted ferrite/PVP glassy carbon working electrode selectivity analysis. 

Analyte Concentration / mM I jn - j0 I / mA cm-2 I (jn - j0)n / (jn - j0) H2O2 I
H2O2 0.2 28.09 1
Ascorbic Acid 2 4.26 0.15
Glucose 2 6.01 0.21
KCl + Na2SO4 2 2.40 0.08

Supporting Info. Laboratory Protocol with Questionnaire Solutions

Understanding the electrochemical sensors’ figures of merit using a H2O2 sensitive, low-cost ferrite powder first generation electrode

I. Safety Considerations

Prior to the practice development, students must read the respective reagents safety sheets via their preferred material safety data sheet (MSDS) database, to guarantee their proper handling. To partake in hands-on activities, participants are required to bring personal protective equipment including a lab coat, safety goggles and disposable latex gloves; which must be worn during the whole experimental procedure.

Furthermore, considering that determinations involve the passage of current through solutions, students should pay special attention to avoid making contact with any components of the 3-electrode electrochemical cell while measurements are performed and make sure that during cell-arranging the potentiostat is turned off.

II. Required Equipment and Materials

OVERALL INSTRUMENTATION
• Potentiostat and computer with control software (Teq4 - NanoTeq) and data processing tools (OriginLab or Excel).
• Standard electrochemical 3-electrode cell (operating volume 50 ml).
• Working electrode: glassy carbon (GC) or platinum disk electrode with a diameter of 5mm.
• Counter electrode: Pt wire or Pt foil with an area of 5 cm2.
• Reference electrode: Silver/ Silver Chloride electrode (Ag|AgCl|1 M KCl).
• Digital balance up to 3 decimal places.
• Volumetric materials: 500 ml, 50 ml and 25 ml volumetric flasks; P100 Micropipette or Plastic Pasteur Pipettes; 2 ml Eppendorf Tubes.
WATERBORNE STOCK SOLUTIONS
• Ferrite Powder (2%w/v).
• Polyvinyl Pyrrolidone - PVP K30 (20% w/v).
• Phosphate Buffer Solution 0.1 M, pH 7.4 (6.8g NaH2PO4 + 1.2g NaOH / 800 ml H2O).
• Hydrogen Peroxide (0.3% w/v). Glucose (7.2% w/v).
• Ascorbic Acid (7% w/v). KCl + Na2SO4 (8.7% w/v).

III. General Considerations

  • The experimental procedure assumes that fundamental electrochemical concepts have been read from the proposed main texts (Hendel and Young 2016; Bard and Fulkner 2001). Therefore, students present a high understanding of the following concepts: electrochemical cells, cyclic voltammetry, potential scanning and coupled chemical reactions.

  • All glassy carbon working electrodes’ surfaces should be previously polished thoroughly with a small piece of sandpaper and distilled water, following an eight-figure motion (Elgrishi et al. 2018). Then, the electrodes should be rinsed with water and ethanol 96% and, if available, an ultrasonic bath may be used for 5 minutes to remove any remaining particles.

  • The detailed protocol below assumes a 50 ml operating cell and further added reagent volumes are adjusted accordingly. In case of a different cell volume, perform the necessary modifications.

  • Unlike CV measurements, during the determination of figures of merit through chronoamperometry it is recommended that solutions are stirred in-between measurements to renew the solution layer near the electrode’s surface. It should be noted that the proposed working electrode lacks a highly adherent conducting polymer, such as multi-walled carbon nanotubes (MWCNT) to which particles easily attach. As a result, the stirring process must be gentle and can be performed using either a Pasteur/automatic pipette as far as possible from the working electrode’s surface.

IV. Laboratory Protocol Procedure

WORKING ELECTRODE ANALYSIS THROUGH CYCLIC VOLTAMMOGRAM
• Prepare the required stock solutions: 2 ml of ferrite powder (2% w/v), 2 ml of polyvinyl pyrrolidone - PVP K30 (20% w/v) and 500 ml of Phosphate Buffer Solution 0.1 M, pH 7.4.

• Check with the lab assistants if the glassy carbon working electrodes were previously polished. If not, carry out the process via a small piece of sandpaper and distilled water, following an eight-figure motion.

• Prepare the electroactive layer of the working electrode by mixing appropriate volumes of the ferrite and PVP stock in order in an Eppendorf tube to obtain a ferrite to PVP mass ratio of 1:10. Drop cast 10 μl of the resulting formulation onto a GC rotating disc electrode and let it dry close to a portable electric space heater during 5-10 minutes. Due to this process, the ferrite/PVP coated working electrode will show an intense and shiny black surface.

• Assemble the electrochemical cell containing 40 ml of Phosphate Buffer Solution 0.1 M, pH 7.4 paying special attention that the potentiostat is off while the working, reference and counter electrodes are connected to the correct clamps.

• Without stirring perform a Cyclic Voltammetry (CV) for the bare GC electrode and the ferrite/PVP coated one within a potential window of [-0.4, 0.4] V at a 0.05 V s-1 scan rate. Export the obtained results and process the data using either OriginLab or Excel. • Identify the redox processes happening at the ferrite/PVP working electrode surface and draw a small diagram in a piece of paper showing the predominant redox species potential dependence (Fe2+/Fe3+). Successively select an appropriate fixed potential condition to measure this electrochemical sensor performance towards H2O2 reduction (pay special attention to the available redox species and measured current profiles) and share your selection criteria with a lab assistant before starting the next section.

ANALYTICAL FIGURES OF MERIT DETERMINATION THROUGH CHRONOAMPEROMETRY
• Prepare additional required stock solutions: 25 ml of hydrogen peroxide (0.3 % w/v), 2 mL of glucose (7.2% w/v), ascorbic acid (7% w/v) and KCl + Na2SO4 (8.7% w/v).

• Following the previously detailed process, prepare the ferrite/PVP working electrode and the electrochemical cell.

• Sensitivity - Repeatability: Perform chronoamperometric measurements of 0.1 M phosphate buffer solution of pH 7.4 at the selected fixed potential (-0.25 V is recommended) after five successive additions, at 30 seconds intervals, of 0.2 ml of the H2O2 stock solution, up to a total volume of 1 ml (0.2 ml of the stock solution is an equivalent to 0.2 mM H2O2 in the electrochemical cell). The electrochemical cell solutions should be stirred gently by using either a Pasteur/automatic pipette after the addition of H2O2 as far as possible from the working electrode’s surface. Repeat the run at least another three times using the same electroactive ferrite/PVP layer drop-casted onto the GC electrode.

• Sensitivity - Reproducibility: Renew the electroactive ferrite/PVP layer drop-casted onto the GC electrode and perform chronoamperometric measurements of 0.1 M phosphate buffer solution of pH 7.4 at the selected fixed potential (-0.25 V is recommended) after five successive additions, at 30 seconds intervals, of 0.2 ml of the H2O2 stock solution, up to a total volume of 1 ml (0.2 ml of the stock solution is an equivalent to 0.2 mM H2O2 in the electrochemical cell). The electrochemical cell solutions should be stirred gently by using either a Pasteur/automatic pipette after the addition of H2O2 as far as possible from the working electrode’s surface. Repeat the run at least another three times, renewing the electroactive ferrite/PVP layer between each run. Remember to polish the GC electrode accordingly before drop-casting a fresh ferrite/PVP layer.

• Limit of detection - Limit of quantification: Determine the standard deviation of the measured current in a blank sample by performing 10 successive chronoamperometry of 0.1 M phosphate buffer solution of pH 7.4 at -0.25 V for a ferrite/PVP working electrode during 30 seconds. When doing calculations [1-2] remember to use the sensitivity value obtained from the reproducibility essays. This parameter has an associated standard deviation so remember to propagate errors when presenting obtained LOD and LOQ results.

• Selectivity: Renew the electroactive ferrite/PVP layer drop-casted onto the GC electrode and perform chronoamperometric measurements of 0.1 M phosphate buffer solution of pH 7.4 at -0.25 V after successive additions, at 30 seconds intervals, of 0.2 ml of the different stock solutions chosen for the selectivity study. It is recommended to follow the sequence: H2O2 → KCl + Na2SO4 → ascorbic acid → glucose (0.2 ml of the interferent stock solution is an equivalent to 2.0 mM of the interferent in the electrochemical cell). Carry out chronoamperometric measurements at -0.25 V of 0.1 M phosphate buffer solution of pH 7.4 after successive the addition of 0.2 mM H2O2; 2,0 mM of KCl + Na2SO4, ascorbic acid and glucose for a ferrite/PVP working electrode during 30 seconds (0.2 ml of each stock solution is the equivalent of the desired concentration in the electrochemical cell). Electrochemical cell solutions should be stirred gently by using either a Pasteur/automatic pipette after the addition of H2O2 and interferents as far as possible from the working electrode’s surface. To unify results presentation criteria between groups, sensitivity should be expressed as a ratio between the current density changes after the addition of 2.0 mM of the tested interferent and 0.2 mM H2O2 [3].


LOD=3SDBlanckmSensitivity [1]

LOQ=10SDBlanckmSensitivity [2]


Selectivity=Jn-J0InterferentJn-J0H2O2 [3]

• Export and process the obtained data for each analytical figure of merit and share your results accompanied with a brief conclusion about the overall performance of the tested ferrite/PVP electrochemical sensor towards H2O2 reduction. A suggested scheme to present your electrochemical results is attached below.

Table 1 Data report corresponding to the analytical figures of merit of a drop-casted ferrite/PVP glassy carbon working electrode. 

FERRITE/PVP ELECTROCHEMICAL SENSOR - ANALYTICAL FIGURES OF MERIT REPORT
Sensitivity / µA cm2 mM-1 LOD / mM LOQ / mM DLR / mM Selectivity
Reproducibility Repeatability KCl + Na2SO4 Asc. Acid Glucose

V. Closing Questionnaire

1- Compare the voltammetric profiles of a bare and ferrite/PVP drop-casted GC electrode in 0.1 M phosphate buffer solution of pH 7.4 at a scan rate of 0.05 V s-1. What can you identify regarding basic electrochemical properties?

2- Considering the structural and functional differences between first, second and third generation H2O2 electrochemical sensors, identify to which category the proposed ferrite/PVP working electrode belongs. Present an illustrative scheme accompanied by a brief explanation.

3- Data report corresponding to the drop-casted ferrite/PVP glassy carbon working electrode repeatability analysis (Table 2) presents a case of a gradual sensitivity loss percentage up to 73% that can be attributed to the dissolution of particles from the electrode to the buffer solution after successive measurements. Can this hypothesis be corroborated by electrochemical techniques? If so, indicate which technique you consider appropriate and what results would you expect to see.

Table 2 Data report corresponding to the drop-casted ferrite/PVP GC working electrode repeatability analysis. 

Repetition Number Sensitivity / µA cm2 mM-1
1 90
2 62.80
3 42.06
4 24.42

4- Regarding electrochemical sensors’ structure and analytical figures of merit determine if the following statements are true or false. In the latter case, justify properly.

  • a. An electrochemical sensor which sensitivity shows high reproducibility but low repeatability can be proposed as both a disposable single and multi-use sensing platform.

  • b. A common strategy involved in first generation sensors design is to increase its electroactive area by superficially attaching different nanomaterials. As a result, the electrochemical sensor displays a sensitivity increase.

  • c. For a second-generation sensor whose analyte limit of detection is 0.06 mM, its sensitivity linear range will include this concentration value.

  • d. In selectivity assays testing the appropriate ratio between the analyte and interferents concentration is critical. Because of this, results of a selectivity study towards H2O2 performed by contrasting current-potential curves at a scan rate of 0.05 V s-1 of 0.1 M phosphate buffer solution of pH 7.4 at -0.25 V after the addition of 0.20 mM H2O2, 0.02 mM KCl + Na2SO4, ascorbic acid and glucose, should be considered as inconclusive.

5- According to Gulaboski, third generation electrochemical sensors carrying native redox metalloproteins excel in fast interfacial electron transfer, high selectivity and sensitivity towards H2O2 when compared to first generation ones (Gulaboski et al. 2019).

  • a. Describe all the structural components of both first and third generation sensors, indicating what role does each component play during electrochemical sensing.

  • b. A comparative study carried out on first and third generation H2O2 electrochemical sensors yielded the following results (Table 3). Working electrodes were prepared one day in advance and left to dry in a convection stove (45 °C) overnight. Sensitivity determinations were performed by chronoamperometry of 0.1 M phosphate buffer solution of pH 7.4 after a stepwise increase of H2O2 concentration in intervals of 0.2 mM, up to a final concentration of 1 mM. What reason other than operator errors can lead to these anomalous results?

Table 3 Data report corresponding to the drop-casted ferrite/PVP GC working electrode repeatability analysis. 

Sensitive Layer Sensitivity / µA cm2 mM-1
Gold Microparticles 86.02 ± 10.25
Horseradish Peroxidase (HRP) 15.70 ± 3.90

VI. Questionnaire Solutions

1- Compare the voltammetric profiles of a bare and ferrite/PVP drop-casted GC electrode in a 0.1 M phosphate buffer solution of pH 7.4 at a scan rate of 0.05 V s-1. What can you identify regarding basic electrochemical properties?

Figure 1 Cyclic voltammogram obtained at a bare (black line) and ferrite/PVP (red line) drop-casted glassy carbon electrode in a 0.1 M phosphate buffer solution of pH 7.4 at a scan rate of 0.05 V s-1

A brief analysis of the graphical results shows that the ferrite/PVP electrode displayed an increased capacitive behavior due to its rectangle-shaped voltammogram and increased current values when compared to the bare GC electrode. Furthermore, the ferrite/PVP electrode shows an anodic peak around -0.1 V and a cathodic peak at -0.16 V, which considering the ferrite composition could be assigned to the oxidation of Fe2+ to Fe3+ and the further reduction of Fe3+ to Fe2+.

2- Considering the structural and functional differences between first, second and third generation H2O2 electrochemical sensors. Identify, presenting an illustrative scheme accompanied by a brief explanation, to which category the proposed ferrite/PVP working electrode belongs.

Figure 2 Ferrite/PVP working electrode illustrative scheme, presenting both structural and functional characteristics. 

The proposed working electrode presents the reported structural and functional characteristics of a first generation electrochemical H2O2 sensor. A bare GC electrode’s (M/C) surface is modified with iron metal oxide particles present in the ferrite powder (MP), assembling a stable and adherent layer due to the physical-chemical properties of PVP. While, from a functional standpoint, there is no need to add a redox mediator to improve H2O2 sensing as the Fe2+/Fe3+ ions on the electrode surface increase both the working electrode electroactive area and sensitivity.

3- Data report corresponding to the drop-casted ferrite/PVP glassy carbon working electrode repeatability analysis (Table 2) presents a case of a gradual sensitivity loss percentage up to 73% that can be attributed to the dissolution or loss of particles from the electrode to the buffer solution after successive measurements. Can this hypothesis be corroborated by electrochemical techniques? If so, indicate which technique you consider appropriate and what results would you expect to see.

There are several electrochemical strategies to corroborate the proposed hypothesis. Regarding electrochemical techniques applied in this work, performing cyclic voltammograms in 0.1 M phosphate buffer solution of pH 7.4 at a scan rate of 0.05 V s-1 after each repeatability run can indicate if the working electrode is losing electroactive area. If the hypothesis is correct successive voltammograms will show a decrease in both cathodic and anodic peaks indicating a lower availability of iron species.

4- Regarding electrochemical sensors’ structure and analytical figures of merit determine if the following statements are true or false. In the latter case, justify properly.

  • a. An electrochemical sensor which sensitivity shows high reproducibility but low repeatability can be proposed as both a disposable single and multi-use sensing platform. (FALSE)

An electrochemical sensor with high reproducibility means that different electrodes batches can perform similarly when used for the first time, a desirable feature when developing single sensing platform. Unfortunately, low repeatability results indicate that a single unit of the proposed sensor lacks the desirable after-use stability and cannot be employed on multiple determinations. As a result, a sensor with these characteristics is only suitable to develop a disposable single-use sensing platform and not a multi-use

  • b. A common strategy involved in first generation sensors design is to increase its electroactive area by superficially attaching different nanomaterials. As a result, the electrochemical sensor displays a sensitivity increase. (TRUE)

  • c. For a second-generation sensor whose analyte limit of detection is 0.06 mM, its sensitivity linear range will include this concentration value. (FALSE)

The limit of detection (LOD) is defined as the lowest analyte concentration that can be reliably detected by the electrochemical sensor. Unfortunately, this doesn’t mean that a sensor with a LOD of 0.06 mM will be able to quantify such analyte concentration and, as a result, this value is not present in the sensitivity calibration curve. Generally, the lower limit of the calibration curve should not be extrapolated below the limit of quantification (LOQ), a value higher than the LOD, that represents the lowest analyte concentration that can be quantitatively detected with a stated accuracy and precision.

  • d. In selectivity assays testing the appropriate ratio between the analyte and interferents concentration is critical. Because of this, results of a selectivity study towards H2O2 performed by contrasting current-potential curves at a scan rate of 0.05 V s-1 of 0.1 M phosphate buffer solution of pH 7.4 at -0.25 V after the addition of 0.20 mM H2O2, 0.02 mM KCl + Na2SO4, ascorbic acid and glucose, should be considered as inconclusive. (TRUE)

5- According to Gulabosky, third-generation electrochemical sensors carrying native redox metalloproteins can outperform first-generation sensors as a result of their better operating features, such as faster interfacial electron transfer, higher selectivity and higher sensitivity towards H2O2 (Gulaboski et al. 2019).

  • a. Describe all the structural components of both first and third generation sensors, indicating what role does each component play during electrochemical sensing.

First generation electrochemical H2O2 sensors present either a bare metal working electrode or a modification with the addition of metal/metal oxide nanoparticles attached to its surface in order to increase the electroactive area and analyte sensitivity. From a methodological perspective, analyte quantification is pretty much straightforward and involves performing amperometric or voltammetric techniques over an electrolyte buffer containing H2O2.

Third generation working electrodes on the other hand present surface modifications including a layer of conductive material with attached nanoparticles and a redox metalloprotein such as catalase or horseradish peroxidase with high selectivity towards H2O2. In this case, analyte measurements are generally carried out at a fixed potential and quantification is indirect through an electron transfer cascade that starts with the enzymatic reduction of H2O2 and continues via electron transfer reducing a redox mediator added to the electrolyte buffer close to the working electrode surface.

  • b. A comparative study carried out on first and third generation H2O2 electrochemical sensors yielded the following result (Table 3). Working electrodes were prepared one day in advance and left to dry in a convection stove (45 °C) overnight. Sensitivity determinations were performed by chronoamperometry of 0.1 M phosphate buffer solution of pH 7.4 after a stepwise increase of H2O2 concentration in intervals of 0.2 mM, up to a final concentration of 1 mM. What reason other than operator errors can lead to these anomalous results?

Despite third generation H2O2 electrochemical sensors outstanding performance, its enzymatic structure entails special care regarding its handling due to the influence of factors such as temperature, pH and electrolyte medium on enzyme stability. In this case, the anomalous results can be attributed, for example, to a temperature denaturation process that wipes out the HRP activity by generating a structural modification that inhibits the H2O2 molecules to bind to the enzyme active site.

VII. Windows of Opportunity

WO #1: Voltammetric analysis of the ferrite/PVP working electrode can be further developed. Despite -0.25V being an appropriate potential to carry out the analytical figures of merit determination, students can thoroughly select the fixed potential conditions for chronoamperometry by recording several voltammetric profiles after the successive addition of 0.2 mM H2O2 (Fig. 3) to guarantee that the selected potential constant profile is preserved.

Figure 3 Voltammetric profiles obtained at ferrite/PVP drop-casted glassy carbon electrode in a 0.1 M phosphate buffer solution of pH 7.4 at a scan rate of 0.05 V s-1 after the successive addition of 0.2 mM H2O2

WO #2: Chronoamperometry consists of promoting a redox process by applying a potential step perturbation which generates current variation with time. This current variation can be phenomenologically explained as the analyte diffusion across the WE diffusion layer, which increases after further consumption of reactant species. In other words, as time progresses the diffusion layer becomes thicker, the rate of analyte diffusive transport decreases and so does the observed current. Generally, current versus time profiles are analyzed through the Cottrell equation [3].

Where i(t) is the measured current, n is the number of hemi reaction electrons transferred, F is Faraday’s Constant (96,485 C/mol), A is the electrode area, D0 is the diffusion coefficient, CO is the initial concentration, and t refers to time.

As shown in Figure 4 chronoamperometric results show a typical transient response profile to an applied potential step, with the particularity that rather than the current falling off to zero as predicted by the Cottrell equation, measured current fluctuates around a steady current value. This could indicate either slow WE kinetics or a well-mixed bulk solution that preserves a constant concentration of electroactive species. Students can perform an extensive data analysis from the chronoamperometric curves testing the validity of the Cottrell equation and if so, obtain parameters such as H2O2 D0 and compare it against reported values (Tjell and Almdal 2018).

Figure 4 Ferrite/PVP WE current-potential curves of 0.1 M phosphate buffer solution of pH 7.4 at -0.25 V after the successive addition of 0.2 mM H2O2 up to 1mM. 

WO #3: Taking advantage of the acceptable H2O2 sensing performance of the electrochemical sensor studied, the proposed laboratory practice can be further contextualized through real-world applications. A simple approach consists of testing the ferrite/PVP electrochemical H2O2 sensing capabilities towards a sample of pharmaceutical hydrogen peroxide as a means of validating the reported analyte concentration. Pharmaceutical solutions contain H2O2 in a concentration range between 3 -10% w/v (American Chemistry Council, s.f.) and by selecting a variety of brands and sample conditions (Table 4) students must prepare the appropriate H2O2 stock solutions to guarantee that the measured concentration through chronoamperometry in 0.1 M phosphate buffer solution of pH 7.4 at -0.25 V for a ferrite/PVP working electrode during 30 seconds lies within the range of the calibration curve obtained during the ferrite/PVP WE sensitivity essays.

Table 4 Validation of hydrogen peroxide concentration reported in pharmaceutical samples using a ferrite/PVP glassy carbon working electrode. 

Pharmaceutic Sample Status [H2O2] Reported / %w/v [H2O2] Validated / %w/v
Drogal - H2O2 10 Vol. Brand New 3.00 2.30 ± 0.42
Farmacity - H2O2 10 Vol. Brand New 3.00 2.75 ± 0.57
Farmacity - H2O2 10 Vol. Opened in 2019 - Expired 3.00 0.77 ± 0.16

VIII. References

American Chemistry Council - Hydrogen Peroxide Fact Sheet. https://www.americanchemistry.com/ProductsTechnology/Hydrogen-Peroxide/What-is-Hydrogen-Peroxide.pdf (Consultado en Julio 2021) [ Links ]

Bard, A. J.; Faulkner, L. R. (2001). Electrochemical Methods: Fundamentals and Applications, 2nd ed.; Wiley: New York . [ Links ]

Elgrishi, N., Rountree, K., McCarthy, B., Rountree, E., Eisenhart, T., Dempsey, J. (2018). A Practical Beginner’s Guide to Cyclic Voltammetry. J. Chem. Educ., 95 (2), 197-206; https://doi.org/10.1021/acs.jchemed.7b00361. [ Links ]

Gulaboski, R., Mircesky, V., Kappl, R., Hoth, M., Bozem, M. (2019). Review-Quantification of Hydrogen Peroxide by Electrochemical Methods and Electron Spin Resonance Spectroscopy. Journal of The Electrochemical Society, 166 (8), 82-101; http://dx.doi.org/10.1149/2.1061908jes. [ Links ]

Hendel, S.J., Young, E. (2016). Introduction to Electrochemistry and the Use of Electrochemistry to Synthesize and Evaluate Catalysts for Water Oxidation and Reduction. J. Chem. Educ., 93 (11), 1951-1956; https://doi.org/10.1021/acs.jchemed.6b00230. [ Links ]

Tjell, A., Almdal, K. (2018). Diffusion rate of hydrogen peroxide through water-swelled polyurethane membranes, Sensing and Bio-Sensing Research, 21, 35-39; https://doi.org/10.1016/j.sbsr.2018.10.001. [ Links ]

Received: July 28, 2021; Accepted: September 12, 2021

*Author for correspondence: ogarate@inti.gob.ar

Creative Commons License This is an open-access article distributed under the terms of the Creative Commons Attribution License