


 text new page (beta)
 English (pdf)
 Article in xml format
 Article references
 Send this article by e-mail
 Cited by SciELO
  Similars in
SciELO
Similars in
SciELO 
 Permalink
1. Introduction
The water supply service of the Mexico City Metropolitan Area (MCMA) has to provide the vital liquid to a population of more than 20 million inhabitants (INEGI, 2018), for which an unsustainable exploitation of water sources is carried out (Birkle, 1998; World Bank, 2013). According to Soto and Herrera (2009), 2019), about 70% of the water consumed in the MCMA comes from the extraction of the local aquifer (SEMARNAT, 2018). If this process continues, the available water resources would be exploited to its exhaustion, which would generate unquantifiable negative social, environmental and economic consequences. On the other hand, since the 20th century, this fragile water supply system has faced a continuous and increasingly intense forced rise in the average global temperature of the planet derived from anthropogenic climate change.
Since human activities and the corresponding emissions for this century can develop in different ways, the Intergovernmental Panel on Climate Change (IPCC) indicates that, in the most optimistic scenario, there would be an increase of 1.5 ºC by the year 2100, and in the worst scenario, it could be of 4.8 ºC (IPCC, 2014). Although at this time the range of uncertainty associated with the final temperature is wide, all scenarios indicate the occurrence of extreme climatic events characterized by excessively high temperatures, torrential rains and severe droughts. This climatic disturbance will generate profound changes in the patterns of humidity and precipitation around the world, including the MCMA. However, there is great uncertainty in the time in which temperature increases and their corresponding effects on the Mexican Republic will occur (Sánchez, 2017). Climate estimates of what will happen on our planet over time and up to the year 2100 are made considering four scenarios or representative concentration trajectories (RCP). These are characterized by their time series of emissions and concentration of all greenhouse gases; aerosol sprays; chemically active gases; land use, and vegetation cover. The trajectories are: RCP2.6, RCP4.5, RCP6.0, and RCP8.5 (IPCC, 2013), in which the number refers to the radiative forcing that is achieved measured in Wm-2. The GFDL-CM3, HADGEM2-ES, and MPI-ESM-LR models considered from the Fifth Assessment Report (AR5) of the IPCC (2013), which present maps for the update of climate change scenarios projections (Fernández-Eguiarte et al., 2015), show that for the MCMA the representative concentration trajectories RCP4.5 and RCP8.5 project lower precipitation values compared to the base climatology of the period 1902-2010 (Fernández-Eguiarte et al., 2015). For both RCPs a decrease in precipitation is expected, for which it is estimated that with the increase in the planetary global temperature, the annual average precipitation over the MCMA will decrease.
The vulnerability (Adger, 2006) of the water supply service system for the MCMA will be aggravated by the effects of climate change (Escolero et. al., 2009; Soto and Herrera, 2019). It is urgent to resort to methods for exploring, in relatively short periods, the future scenarios that may arise. We have chosen to use the fuzzy cognitive map (FCM) framework to explore the effects that climate change will generate on the water supply service system of the MCMA because FCM allows working with data that may present great uncertainty and/or lack of precision.
Below we present the literature review of the role that FCMs have played in the environmental and climatological areas. Following that, we explain our method in detail, and include the results obtained when applying these mathematical models. We present a brief discussion of the results and focus our attention on detecting the elements that appear to be most affected in each of the three sectors (environmental, social and provider). An intervention action is proposed for each case. Finally, conclusions are presented.
2. Theoretical background
2.1 Fuzzy cognitive maps in the environmental and climatological areas
FCMs have been used in various fields. This has been illustrated in the modeling of simulated domains (Dickerson and Kosko, 1994); in the analysis of systems, to detect their failures and analyze their effects (Peláez and Bowles, 1996); in the creation of ecological models based on the knowledge of people (Özesmi and Özesmi, 2004); in modeling complex systems (Stylios and Groumpos, 2004); for decision-making and environmental management (Papageorgiou and Kontogianni, 2012); for developing land cover scenarios in the Brazilian Amazon (Soler et.al., 2012); for evaluating the future of water in the Seyhan basin (Cakmak et al., 2013); in the assessment of impacts and community preparedness to cyclones (Singh and Chudasama, 2017); for modeling the problem of high energy consumption in the construction sector considering the context of climate change (Mpelogianni and Groumpos, 2018); in modeling the behavior of the immediate consequence of high intensity rainfall in Kampala, Uganda (Nair et al., 2019); in sustainable agriculture (Bahri et al., 2020); and to analyze the causes and hazardous effects of malathion (organophosphorus insecticide and pesticide) in the environmental components (air, water, and soil) (Poomagal et al., 2021). However, its application in issues related to climate change and its effects has been very recent. Pioneering contributions arose with the work of Gay-García and Paz-Ortiz in the study of stability in terrestrial climate systems (Paz-Ortiz, 2011; Gay-García and Paz-Ortiz, 2014), in the modeling, simulation and evaluation of the terrestrial climate system based on a framework of planetary limits (Paz-Ortiz and Gay-García, 2014), as well as in the analysis of the impact that climate change will have on Mexico City’s water supply sources (Paz-Ortiz and Gay-García, 2013). It is worth highlighting that this last study utilized scenarios in which there was an increase or decrease of the average annual precipitation in Mexico City. In both cases the water supply sources were seriously compromised. The specific question for this study was how can we expand the field and apply FCMs to explore the repercussions that a decrease in average annual precipitation as a consequence of climate change will have on the water supply service of the MCMA. Based on the works carried out by Soto and Herrera (2009, 2019), we propose the environmental, social and supplier sectors as the basic and fundamental subsystems of the highly complex system that makes up the water supply service of the MCMA. Since all subsystems and their segments are closely interrelated with each other, any change generated in any subsystem will affect the other subsystems, and therefore, the system itself. These interactions occur in a non-linear and dynamic way, where circular or feedback processes occur, as well as a continuous exchange of energy and information between the components of the system and between the system and its environment. All these characteristics of a study system allow it to be identified as a complex system (Lara-Rosano et al., 2018).
2.2 Theory of fuzzy cognitive maps
The focus of the FCM is to consider that any system can be represented by means of cause and effect relationships between its different variables (Ross, 2010). The FCM graphically captures the causal relationships established between the different actors, which can be facts and things, processes and values, or policies and objects (Kosko, 1986). In this network, events affect others to some degree (Kosko, 1996) and the various actions affect the whole in an indissoluble way. Due to their characteristics, FCMs allow both quantitative and qualitative data to be combined, allowing to obtain a qualitative, panoramic and comprehensive understanding of the system, with the additional advantage of requiring light computing power, allowing the acquisition of results in short periods of time. Although the construction of an FCM starts from documented sources, it also exhibits a subjective nature due to the incorporation of information from the consultation of experts and the application of questionnaires. This ostensible disadvantage is its greatest quality, since the incorporation of more information allows for improving the model’s veracity (Dickerson and Kosko, 1994; Kosko, 1996). The structure of an FCM corresponds to that of a weighted diagram (Harary et al., 1965), whose nodes represent variable concepts and the arcs cause-effect relationships between the concepts (Fig. 1). The concepts are represented by fuzzy sets, so the values in this set are between zero and one (Zadeh, 1965).
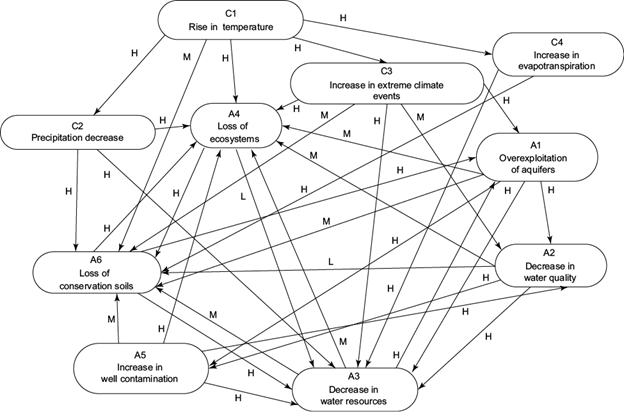
Fig. 1 Concepts and relationships between the environmental and climate subsystems. The linguistic weights of the causal relationships are denoted by H (high), M (medium) and L (low).
For an FCM of N concepts, these are identified with the labels C 1 , C 2 ,…, C N . The weighted arc (e.g., e ij ) indicates that the direction in the causal relationship begins on C i and ends at the concept effect C j . The values or weights assigned to e ij can be both numeric and linguistic values. Linguistic values allow us to take advantage of real world input in the FCM. A positive causal relationship from concept C i to concept C j is indicated by C i →+ C j ; that is, if the concept C i grows, so will the concept C j . Conversely, a negative causality denoted by C i →- C j means that if C i grows, the concept C j will decrease. In general these changes do not occur in an absolute linear fashion. For this reason, FCMs only allow answering questions like what if, that is, forward processes but never in the inverse. Due to this non-linearity, the model cannot explain exactly how the variables are altered (Kosko, 1996).
The fuzzy causal relationships established between the nodes of the FCM are indicated by means of the corresponding adjacency matrix E with fuzzy weights (Kosko, 1986, 1996). Since the flexible structure of an FCM allows adding, eliminating or modifying the concepts considered as the weights of the relationships in the network, we can explore an immense variety of different scenarios. The evaluation of an FCM is based on how well it reflects reality. To evaluate how good an FCM is, the information it provides is compared with the actual situation being modeled. If the results are contrary to what is known to be happening within the system, as it could be that without any intervention the water quality will increase, it is an indication that the FCM has been modeled in the wrong way.
2.2.1 Balance and normalization
Once the rules of causality have been established along with their respective weights, the FCM is activated by turning on one or more of its concepts. Starting from the vector that describes the initial state of the system C(0) = [C 1 (0), C 2 (0),…, C N (0)], it is multiplied by the corresponding matrix E. The vector resulting from this operation is multiplied by the adjacency matrix E and so on. Following this iteration process from the vectors obtained after each multiplication, one of the following three possibilities will be obtained: a state of equilibrium located at a fixed point; a limit cycle or a chaotic attractor (Kosko, 1996). The procedure described here corresponds to the Kosko inference rule (Kosko, 1986) and is the one applied in this work in Eq. (1). Since all the constituent elements of our subsystems interact, we do not have the independence condition, which is why for our subsystems it is valid to apply the Kosko inference rule (Nápoles et al., 2018). To ensure that after each iteration process the values of each of the concepts remain within the interval [0,1], a normalization process is applied.
Since FCMs can be seen as a type of neural network (Kosko, 1992), the logistic signal function is applied:
It is important to note that the iterations do not have a direct representation of time in reality, but they are rather relative to the other components of the systems.
2.2.2 Concept indexes
Within the theory of digraphs, there are three measures that quantify the importance of concepts in a network (Harary et al., 1965). On the one hand, the index od(C i ) measures the flow of causality that leaves the node C i to the network. From considering the matrix of absolute values of E, all the components of the i-th row are added.
The index id (C i ) measures the flow of causality that the node C i receives from the other concepts in the network. This is obtained by adding all the components of the i-th column.
The centrality of a node C i measures the importance of this concept in relation to the network; this measures is obtained by adding the values of its indices od(C i ) and id(C i ).
A node for which its index od(C i ) is null, and its id(C i ) > 0 is called the “receiver concept”. If instead the id(C i ) is null and the od(C i ) > 0, the concept will be a “transmitter”. If the od(C i ) > 0, and the id(C i ), the concept will be “mixed”.
3. Results
In the proposed model, the three illustrative diagrams represent the basic elements that make up each of the three subsystems -environmental, social and supplier- that encompass the water supply service of the MCMA as well as those of the climate system with which it interacts (Figs. 1, 2, 3).
Environmental concepts are included in Figure 1: exploitation of aquifers (A1); decrease in water quality (A2); decrease in water resources (A3); loss of ecosystems (A4); increase in contamination of wells (A5), and loss of conservation soils (A6).
Social concepts are included in Figure 2: industrial, population and tourism growth (S1); increase in water demand (S2); increased cuts in water supply (S3); decrease in water quality (S4); deterioration of health (S5), and increased vulnerability of communities (S6).

Fig. 2 Concepts and relationships between the social and climate subsystems. The linguistic weights of the causal relationships are denoted by H (high), M (medium) and L (low).
Provider and climatic concepts are included in Figure 3: increased exploitation of supply sources (P1); increased water sanitation costs (P2); increased deficiency in infrastructure for the distribution of drinking water (P3); decrease in the efficiency of the drainage system (P4); generation of social, political, economic and environmental problems (P5); increase in floods (P6); increase in temperature (C1); decrease in precipitation (C2); increase in extreme climate events, framed in a scenario characterized by an increase in the frequency and intensity of droughts (C3), and increase in evapotranspiration as an effect of the increase in temperature (C4).
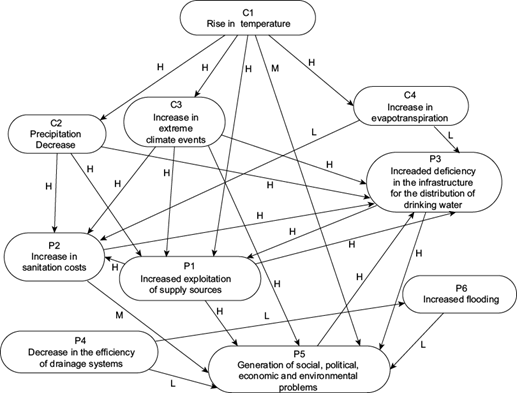
Fig. 3 Concepts and relationships between the provider and climate subsystems. The linguistic weights of the causal relationships are denoted by H (high), M (medium) and L (low).
3.1 Causal relationships
3.1.1 Climate subsystem
In the scenario in which an increase in temperature (C1) generates a decrease in the average annual precipitation received in a positive way by the active region, the following concepts are affected: there is a decrease in precipitation (C2); an increase in climate extreme events (C3), characterized by an increase in the frequency and intensity of droughts, and an increase in evapotranspiration (C4) (IPCC, 2007).
3.1.2 Environmental and climate subsystems
As documented by the IPCC (2007), increases in temperature (C1) have had a direct effect on the increase in loss of ecosystems (A4) and conservation soils (A6). The decrease in annual precipitation (C2) results in a decrease in the amount of water available for the recharge of dams, lakes and aquifers, thus directly generating a decrease in water resources (A3). The lack of rainfall (mainly in times of low water) generates the loss of ecosystems (A4) and conservation soils (A6). We consider that the increase in the occurrence of extreme climatic events (C3), such as stronger periods of drought, will have an impact on the quality of available water (A2), the reduction of water resources (A3), and the need for overexploitation of the aquifers (A1) to meet the population’s demand. When (A1) occurs, the groundwater levels in the aquifers decrease, which causes a horizontal flow inversion in some parts of the aquifer, such as occurs in Iztapalapa and Texcoco, resulting in a salinization of the water (Soto and Herrera, 2009), decreasing its quality (A2) or polluting it (A5), thus reducing the available water resources (A3), conservation soils (A6) and ecosystems (A4). Periods of frequent or intense droughts generate an increase in the loss of ecosystems (A4) and of conservation soils (A6). Currently the voracious growth of urban areas and immoderate tree felling (A6), generates an overexploitation of aquifers (A1), a decrease in water resources (A3) and a loss of ecosystems (A4). The increase in the loss of moisture from soils due to evaporation and transpiration of vegetation (C4) reduces the amount of infiltrated water to recharge the aquifers, generating a loss of conservation soils (A6) and a decrease in the available water resources (A3). In turn, (A3) generates an overexploitation of aquifers (A1), loss of ecosystems (A4) and loss of conservation soil (A6). If water in the aquifers is deficient (A2), or if contamination of wells is increased (A5), this contributes to the reduction of available water resources (A3), the loss of ecosystems (A4) and of conservation soils. In turn, an increase in contamination of the wells decreases the quality of water (A2). Good quality water indicates that there is a biological balance, so the loss of ecosystems (A4) contributes to the reduction of organisms necessary to keep the water in good condition, thus reducing water resources (A3) with loss of conservation soils (A6) (Soto and Herrera, 2009). The FCM associated with these cause-effect relationships is shown in Figure 1.
3.1.3 Social and climate subsystems
Faced with increases in temperature (C1) or in the occurrence of extreme weather events (C3), high temperatures cause the population to increase its water consumption (S2), as occurs when personal hygiene is done more than once a day. This generates an increase in the amount of required water, which is obtained from an increase in the exploitation of aquifers, generating a decrease in the quality of water (S4). Temperatures higher than usual contribute to the detriment of health (S5) and increase the vulnerability of communities (S6). We consider that the decrease in precipitation (C2) or the increase in extreme climatic events (C3) would negatively affect concept S1, which refers to industrial, population and tourism growth, because a decrease in precipitation or the presence of extreme climatic events hinder human activity as well as being factors that deteriorate health (S5). Both increase the vulnerability of communities (S6), favor greater water consumption (S2), and impact on reducing water quality (S4). An increase in the evapotranspiration process (C4) will have among its innumerable consequences a negative effect on farmland. We suppose that an increase in the reduction of water resources may lead to this phenomenon, contributing to migration towards the MCMA in search of the vital liquid (S1). Faced with a decrease in water resources, an increase in shortages of water supply is expected (S3), as well as a decrease in its quality (S4). From the study by Soto and Herrera (2019) it is known that industrial, population and tourism growth (S1) demands a greater amount of water to cover its needs (S2). In turn, this growth contributes to the deterioration of the population’s health in various ways (S5), whether in the emission of more pollutants into the atmosphere, water pollution, or contact with bacteria, among others. If we assume that the amount of available water is limited, and given the current conditions, to respond to the incessant increase in water demand (S2) it will be necessary to cut back on its supply (S3), in order to distribute it. To satisfy this demand for water, the population resorts to various means, such as renting pipes or buying jugs of water, which in many cases is of very poor quality (S4). We consider that an increase in cuts in water supply (S3) generates a decrease in its quality (S4). Both the water cuts (S3) and the decrease in its quality (S4) contribute to the deterioration of health (S5), increasing the vulnerability of the community (S6), a situation widely palpable in these times of the Covid-19 pandemic. In turn, the deterioration of health (S5) generates an increase in the demand for water (S2), and therefore an increase in the vulnerability of the community (S6). If vulnerability increases (S6), this has an effect on deteriorating health (S5). The FCM associated with these cause-effect relationships is shown in Figure 2.
3.1.4 Provider and climate subsystems
As well as the water supply service of the MCMA, increases in temperature (C1) will force the supplier to overexploit the supply sources (P1) to meet the growing needs of the population. On the other hand, it is assumed that changes in temperature will generate social, political, economic and environmental problems (P5). We consider that simply due to time issues, the presence of problems between the different sectors of society will affect the mechanisms that allow the implementation of better infrastructure for the distribution of drinking water, which is why this system will be more deficient (P3), as the many water leaks from the hydraulic system have shown. We assume that if the system is not very efficient, it will be necessary to resort to an increase in the exploitation of supply sources (P1), which in turn will contribute to generating social, political, economic and environmental problems (P5). A decrease in precipitation (C2) will generate a decrease in the amount of recharge water. Since the demand for the vital liquid never yields and is exacerbated by the increase in temperature, we assume that the exploitation of supply sources will increase (P1). As there is little water in the reservoirs, the amount of dissolved particles may be important in proportion, which would lead to an increase in the costs of water sanitation (P2). Given this condition, an increase in the deficiency of the infrastructure for the distribution of drinking water (P3) is assumed, such as the lack of running water or pipes. For the case in which extreme climate events occur in the region (C3), the same causal relationships will exist, with the additional factor that, under extreme climate conditions, the generation of social, political, economic, and environmental problems will increase (P5). In a similar way, a decrease in the amount of water due to an increase in evapotranspiration (C4) will generate increases in the costs of water sanitation (P2), as well as an increase in the deficiency of the infrastructure for the distribution of drinking water (P3). We consider that both the increase in the exploitation of supply sources (P1) and the increase in water sanitation costs (P2) generate an increase in the deficiency of the infrastructure for the distribution of drinking water (P3), as well as social, economic, and environmental problems (P5). For the water supply service to be efficient, it must have an adequate sewage collection system. A decrease in the efficiency of drainage systems (P4), for example due to damage to their infrastructure, or the fact that part of the population does not have this service leads to the generation of social problems (P5). Furthermore, as is already the case in many situations, during the rainy season, this service is exceeded, which causes severe flooding (P6). The increase in floods (P6) generates social, economic and environmental problems (P5). The FCM associated with these cause-effect relationships is shown in Figure 3.
3.2 Feedback process
The weights of the causal relationships can be worth {-1,0,1} (Kosko, 1992). In our maps, the only cases with negative values occur between the concept C2, C3 and S1. To study the feedback processes of the system, one or more concepts are turned on in the initial state vector and, without keeping them as forcing, the resulting vector after each iteration already normalized, applying Eq. (2), is multiplied by the adjacency matrix. This process is repeated until it is possible to analyze the equilibrium state that the system reaches (Kosko, 1986, 1996; Ross, 2010). For each of the three subsystems, two cases were considered, (a) the one in which extreme climate events do not occur, and (b) where they do occur.
Since in case (a) the three subsystems exhibit the same patterns as in case (b) below, we only show the results in a scenario in which there are extreme climatic events. The only difference between these two scenarios is when extreme events are triggered, being the result that there are higher values of the concepts from the first iteration. This indicates that the presence of extreme events accelerates the asymptotic growth of the values of the concepts.
In all cases, the first four components of the vector correspond to the climatic concepts and appear in the order in which they are numbered in each of the fuzzy cognitive maps. For example [C1 C2 C3 C4 A1 A2 A3 A4 A5 A6].
3. 2. 1 Environmental and climatic subsystems
We turn on the concept of extreme events (C3), along with (C1) and (C2). The initial state vector is v0 = [1 1 1 0 0 0 0 0 0 0], without these concepts remaining as forcing. After nine iterations, the vector N9 = [0.5 0.62245933 0.62245933 0.62245933 0.93215231 0.91824864 0.99861344 0.9984338 0.86417417 0.99915809] is obtained. The first point to highlight is that all concepts turn on even if concepts C1, C2, and C3 are no longer active, which indicates that the causal flow will continue to circulate through the cognitive map continuously. The most affected concept in this panorama is the loss of conservation soils (A6), followed by a decrease in water resources (A3), loss of ecosystems (A4), overexploitation of aquifers (A1), decrease in water quality (A2), and the increase in contamination of wells (A5) (Fig. 4).
3.2.2 Social and climate subsystems
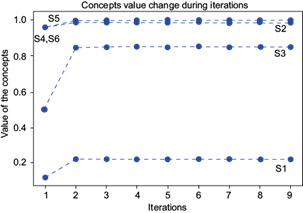
The initial state vector is v0 = [1 1 1 0 0 0 0 0 0 0]. For the ninth iteration, the state vector N9 = [0.5 0.62245933 0.62245933 0.62245933 0.34922232 0.95634201 0.82903469 0.9845228 0.99258827 0.9895543] is obtained. The deterioration in the health of the population (S5), the increased vulnerability of the communities (S6), the decrease in water quality (S4) and the increase in the demand for water (S2) are the concepts most affected by this scenario. On the other hand, in a unique way, industrial, population and tourism growth (S1) starts with a value lower than 0.3. One possible interpretation is that human activities will be affected in their response capacity, but later their resilience will increase, which however will stagnate, remaining constant. It is very important to highlight that, under this scenario, the health of the population and its vulnerability will be the most affected, and that all the concepts remain on even when the concepts (C1), (C2) and (C3) are turned off (Fig. 5).
3.2.3 Provider and climate subsystems
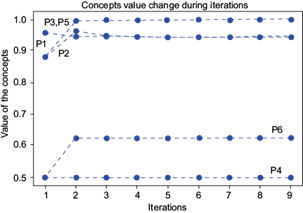
Given the initial state vector v0 = [1 1 1 0 0 0 0 0 0 0], at the end of nine iterations it leads to vector N9 = [0.5 0.62245933 0.62245933 0.62245933 0.93913417 0.94302672 0.99136783 0.5 0.9940503 0.62245933]. Figure 6 shows that the values of the concepts are displayed in the following decreasing order: generation of social, political, economic and environmental problems (P5), followed by an increase in the deficiency of the infrastructure for the distribution of drinking water (P3), an increase in water sanitation costs (P2), an increase in the exploitation of supply sources (P1), an increase in floods (P6), and a decrease in the efficiency of the drainage system (P4). The fact that concept P4 appears with the lowest relative and constant value among the concepts is explained by considering that the initial conditions consider a decrease in the annual average rainfall, so that problems derived from floods will not appear.
3.3 Hidden patterns
The weights of the causal relationships can be worth {-1,0,1} (Kosko, 1992). In our maps the only case with a negative value occurs between concepts C3 and S1. In all cases, for the analysis of the hidden patterns in each of the subsystems to be considered, the concepts that are turned on are forced to maintain that state (Kosko, 1988, 1996). Below we present the effects that climate change has on each system by maintaining its action continuously.
For each of the three subsystems, two cases were considered, (a) the one in which extreme climate events do not occur, and (b) where they do occur. Since in case (a) the three subsystems exhibit the same patterns as in case (b) below, we only show the results in a scenario in which there are extreme climatic events. However, the values obtained from the first iteration in case (b) are higher, which indicates a great sensitivity of the concepts to the presence of extreme events that remain forcing.
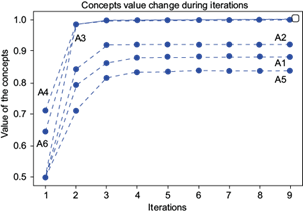
3.3.1 Environmental and climate subsystems
The initial state vector v0 = [1 1 1 0 0 0 0 0 0 0] leads in the ninth iteration to the state vector F9 = [1 1 1 0.73105858 0.95253982 0.94385435 0.99944518 0.9995759 0.86948287 0.99979575]. Figure 7 reveals that the concepts that tend asymptotically to 1 are: the loss of conservation soils (A6), the loss of ecosystems (A4), and the decrease in water resources (A3). To a lesser degree it is followed by the over-exploitation of aquifers (A1), the decrease in water quality (A2), and the increase in contamination of wells (A5). In this scenario, where an increase in temperature, a decrease in annual average rainfall, and the presence of extreme events persist as forcings, there is a loss of conservation soils and ecosystems and a decrease in water resources.
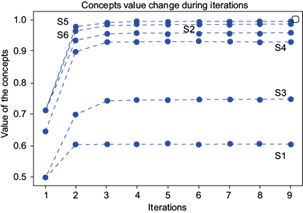
3.3.2 Social and climate subsystems
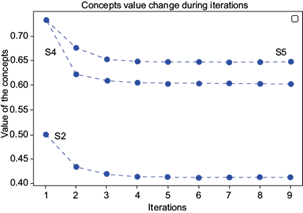
Starting from the initial state vector v0 = [1 1 1 0 0 0 0 0 0 0], after the ninth iteration, the state vector F9 = [1 1 1 0.73105858 0.21943852 0.98547297 0.84768154 0.99618204 0.99767198 0.99710403] is obtained. Figure 8 reveals that the concepts that tend asymptotically to 1 are: deterioration of health (S5); increased vulnerability of communities (S6); decrease in water quality (S4). To a lesser degree it is followed by increase in water demand (S2); increased cuts in water supply (S3); and industrial, population and tourism growth (S1). In a highly notorious way, in this scenario there is a situation in which the concept (S1) acquires the lowest relative and constant value with respect to the other concepts. This would indicate that the growth of the population’s activities would be seriously impacted in a negative way.
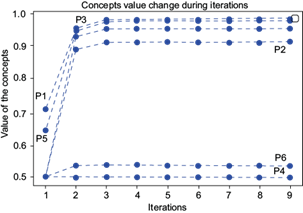
3.3.3 Provider and climate subsystems
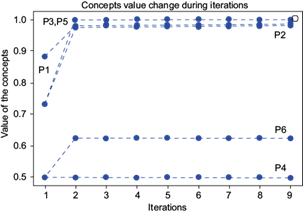
From the initial state vector v0 = [1 1 1 0 0 0 0 0 0 0], the state vector F9 = [1 1 1 0.73105858 0.98195402 0.97617747 0.99662137 0.5 0.99771069 0.62245933] is obtained in the ninth iteration. Figure 9 displays the relative values of the concepts in decreasing form: generation of social, political, economic and environmental problems (P5); increase in the deficiency of the infrastructure for the distribution of drinking water (P3); increase in the exploitation of the sources of supply (P1); increase in water sanitation costs (P2); increase in floods (P6), and decrease in the efficiency of the drainage system (P4). This last concept remains with a constant value of 0.5.
We consider that the coincidence between the results obtained for causes that occur for a certain period of time and for those that remain is due to the fact that each of the three subsystems is already in a highly vulnerable state even without considering the effects of climate change. The problems already present will be exacerbated by the new climatic conditions.
Until now, all interactions have been considered to have the same intensity; however, it is clear that in real life, there will be causal relationships that are more intense than others. To describe the intensity of causal relationships, based on the literature review carried out so far, we use a linguistic description to describe “how intense is the action of one concept on another”, since the intensities start from a linguistic assessment. Cognitive maps acquire a fuzzy character.
3.4 Fuzzy values
The intensity of the relationship between the different concepts is estimated through the linguistic variables high (H), medium (M) or low (L) (the causal relationships with linguistic values are observed in Figs. 1, 2, and 3). To analyze the behavior of each of the subsystems by means of the adjacency matrix, the interval [0,1] that describes the degree of belonging of a subset to a set is divided into three parts. For each subset a representative value is selected; in this case, a value of 0.3 is considered low (L), 0.6 as medium (M) and 0.9 as high (H). These values are fuzzy since they are within the interval [0,1]. On the other hand, they are very close to the values suggested by Papageorgiou et al. (2006): 0.25, 0.50, and 0.75, respectively. Due to the nature of fuzzy cognitive maps, experts can modify or assign the value of the weights based on what they consider best represents the interaction. To each subsystem a matrix with fuzzy values is constructed. For each of the three subsystems, concept C1 is turned on, keeping it as forcing, and the state vector of the system obtained in the ninth iteration is analyzed.
3.4.1 Environmental and climate subsystems
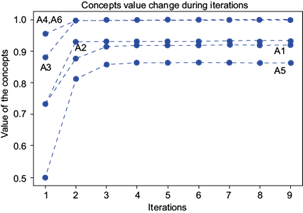
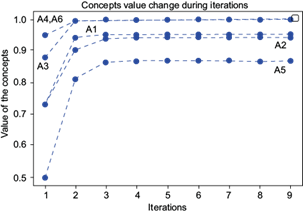
We turn on the C1 concept and keep it as forcing. From the initial state vector v0 = [1 0 0 0 0 0 0 0 0 0], the vector F9 = [1 0.7109495 0.7109495 0.7109495 0.91914398 0.88133865 0.99586773 0.99594413 0.83485498 0.99404144] is obtained for the ninth iteration. The evolution of the concepts’ values as a function of the number of iterations is shown in Figure 10. As it can be seen, after the first iteration, concepts A4, A3 and A6 quickly tend to 1. This indicates that, in the continuous presence of an increase in temperature, the most affected concepts in descending order are: loss of ecosystems (A4), decrease in water resources (A3), and conservation soils (A6). These three concepts correspond to those most affected in all the cases previously studied (Figs. 4 and 7)
3.4.2 Social and climate subsystems
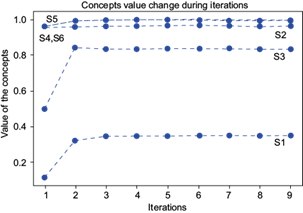
From the initial state vector v0 = [1 0 0 0 0 0 0 0 0 0], the state vector F9 = [1 0.7109495 0.7109495 0.7109495 0.60505425 0.9513964 0.74450973 0.92708948 0.98869984 0.98081253] is obtained in the ninth iteration. In a similar way to all the above-mentioned cases (Figs. 5 and 8), the four concepts that rapidly tend to 1 are: deterioration of health (S5), increased vulnerability of communities (S6), increased demand for water (S2), and decreased water quality (S4) (Fig. 11).
3.4.3 Provider and climate subsystems
The initial state vector of this system is v0 = [1 0 0 0 0 0 0 0 0 0]. After 9 iterations the vector F9 = [1 0.7109495 0.7109495 0.7109495 0.95539954, 0.91316077 0.98297375 0.5 0.97903095 0.53742985] is obtained. The three concepts with the highest growth in descending order are: increased deficiency in infrastructure for the distribution of drinking water (P3); generation of social, political, economic and environmental problems (P5), and increased exploitation of supply sources (P1) (Fig. 12). This same behavior is observed in all the previous cases (Figs. 6 and 9).
4. Discussion
The results obtained so far indicate that the final states of equilibrium for each of the subsystems considered are undesirable. The question that follows is: What can we do about it? We consider our results to answer this question.
4.1 Centrality and feedback
The centrality of each of the concepts is calculated in order to detect which nodes are most important within each network. From (3), (4), and (5) centrality values are obtained for each subsystem. The three concepts with highest centrality are considered. Each of these three concepts also affects the others mutually through a feedback process within each network.
4.1.1 Environmental and climate subsystems
The three concepts with greatest centrality are (in descending order): decrease in water resources (cen(A3) = 8.7), loss of conservation soils (cen(A6) = 8.7) and ecosystems (cen(A4) = 7.5). In turn, Figure 1 shows that these three concepts create a feedback process given by A3, A4, A6, and A3. At this point it is very important to mention that there are more feedback processes such as A4, A6, A4 or A1, A4, A3, A1, etc. We will try to intervene in the feedback process that has more weight on the network.
4.1.2 Social and climate subsystems
According to their centrality, the main nodes of this network in descending order are: deterioration of health (cen(S5) = 7.2), increased vulnerability of communities (cen(S6) = 5.4), and increased demand for water (cen(S2) = 5.4). However, as can be seen in Figure 2, the concept S6 is outside a feedback process, therefore it is excluded from the selection, and the next node in importance is considered, which is the concept S4 with cen(S4) = 4.8. From these concepts, the feedback process [S5, S2, S4] is established.
4.1.3 Provider and climate subsystems
For this subsystem, the three most important concepts in descending order are: increase in infrastructure deficiency for the distribution of drinking water (cen(P3) = 6.6), increase in the exploitation of supply sources (cen(P1) = 6.3) and generation of social, political economic and environmental problems (cen(P5) = 5.4). The feedback process between these concepts follows the process [P3, P1, P5, P3] (Fig. 3).
4.2 Intervention
Three interventions are proposed to decision makers in order to reduce the negative effect generated in the aforementioned feedback processes. Each proposed measure is based on what we consider most urgent. To analyze what happens with each of the systems, the values of the causal relationships are considered to be worth {-1,0,1}.
4.2.1 Environmental and climate subsystems
For the environmental subsystem, among many other measures, an increase in the effective monitoring and conservation of conservation soils is urgent (Paavola and Primmer, 2019). Although there is legislation regarding the territorial limit of conservation soils, in practice these are invaded, either by the increase of the original population or by migration to the MCMA. The extinction of conservation soils is destroying the remaining ecosystems in this region together with the possibility of recharging the aquifers, as the water infiltration process is hampered. The effect of concept I1 on the feedback process can be observed in Figure 13. We consider that the causal relationships for this subsystem have integer values, as shown in Figure 13. The figure first shows the initial state in which concepts A3, A4, A6 are turned on, indicating that the problem is already present (as is currently the case) together with concept I1. So, v0 = [1 1 1 1]. The last component corresponds to the value of concept I1, which is the only one that will remain as a forcing throughout the iteration process. After the ninth iteration, the resulting vector is F9 = [0.76393078 0.58693396 0.58693396 1], where it can be observed that the value of the concepts shows a decreasing behavior (Fig. 14).
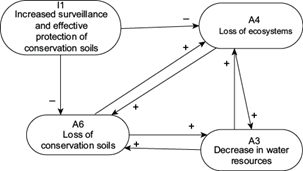
Fig. 13 Feedback process between concepts A3, A4 and A6 together with the action of intervention I1.
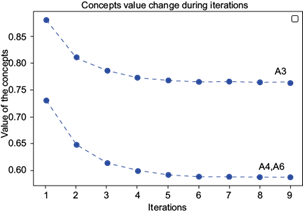
Fig. 14 The intervention concept I1: Increase in the surveillance and protection of conservation soils is enforced and maintained as a force.
The concepts that most benefited from the suggested intervention are loss of conservation soils (A6) and loss of ecosystems (A4), whose obtained value is approximately 58 % of the original one. For its part, even though this measure does not drastically reduce the decrease in water resources (A3), it does contribute to its mitigation. To have a greater effect on this concept, more measures should be carried out to reduce its value to the maximum.
4.2.2 Social and climate subsystems
As Soto and Herrera (2019) point out, the poorest population is more likely to obtain an unequal distribution of the liquid. The water supply in their homes is enabled for a few hours each week, in addition to the fact that the liquid is of poor quality. To cope with the shortage, it is common to store water as well as purchasing pipe and bottled water. These time and money factors disproportionately affect low income households.
From this study we have obtained that the deterioration in health due to lack of supply or lack of drinking water is one of the most urgent problems to be addressed. Figure 15 reconsiders the feedback process between concepts S2, S4 and S5, together with intervention I2. If we start from the initial state vector in which all concepts are on, and we maintain only I2 as forcing, the initial state vector is v0 = [1 1 1 1]. After the ninth iteration, the state vector is F9 = [0.4124232 0.60166935 0.64603877 1]. Figure 16 shows that the value of the concepts decreases, with S2 being the most benefited, followed by S3 and S5. If the intervention proposal we present is carried out, the amount of water required by the system would be significantly reduced (S2), which in turn would improve the quality of the water that the population consumes (S4), contributing positively to a reduction in deterioration of health (S5).
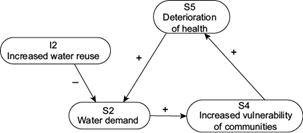
Fig. 15 Feedback process between concepts S2, S4 and S5 together with the action of the I2 intervention.
4.2.3 Provider and climate subsystems
According to Mexico City’s Water System (Sacmex), more than 40 % of the water that the city receives is lost in numerous leaks affecting the hydraulic system. Although the percentage will be different for the MCMA, this area faces great losses of the vital liquid due to damage to its infrastructure. The proposed I3 intervention aims to an increase in monitoring, supervision and effective control of drinking water leaks, for which it will be necessary to change the hydraulic network in areas with the greatest impact. Figure 17 presents the feedback process between nodes P1, P3 and P5, together with intervention I3. If we start from the initial state vector in which all the concepts are on and we keep I3 as a forcing concept, v0 = [1 1 1 1]. After the ninth iteration the state vector of the system is F9 = [0.34538251 0.3605633 0.42702804 1]. These values indicate that the values of concepts P1, P3 and P5 have decreased to 34, 36 and 42% of their original value, respectively (Fig. 18).
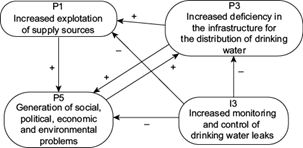
Fig. 17 Feedback process between concepts P1, P3 and P5 together with the action of intervention I3.
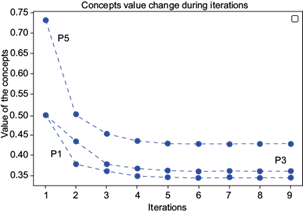
Fig. 18 The intervention concept I3 is enforced and maintained: Increase in the effective monitoring and control of drinking water leaks.
The concept that most benefited from this intervention is P1. The exploitation of supply sources would be reduced. This result has profound consequences, since projects are being carried out to bring water from more distant regions to meet the needs of the MCMA population. However, these solutions are far from being friendly to the environment, as well as being expensive. With this proposal, the aim is to make the most of the resources available, without disrupting other sources or endangering the current ones. For its part, a better infrastructure that does not present leaks will improve the distribution of drinking water, contributing in part to a reduction in social, political, economic and environmental problems.
5. Conclusions
Although the MCMA water supply service is a highly complex system, of which we ignore important information and where there are large ranges of uncertainty, through the use of fuzzy cognitive maps we have been able to qualitatively explore the possible effects of climate change on the environmental, social, and provider subsystems. This study has allowed us to determine which of the repercussions they will face from an increase in temperature and a decrease in precipitation are the most sensitive.
For the environmental-climatic subsystem, it was found that the most pressing problems are the decrease in water resources and the increase in the loss of conservation ecosystems and soils. The intervention that we recommend to decision-makers is to increase surveillance and effective protection of conservation soils and, where appropriate, recover invaded areas, so that both soils and the ecosystem may recover. If the proposed intervention is carried out, although the decrease in water resources and the loss of ecosystems and conservation soils will not be eliminated, the rate at which these processes occur will be reduced. If this intervention is strengthened with appropriate actions, the mitigation effect can be enhanced.
In the social-climatic system, the scenario constantly increasing temperature leads us to a state of equilibrium characterized by an increase in the of water by the population, a decrease in water quality and a deterioration in health. The intervention that we recommend to decision-makers is to work in mechanisms that permit the reuse of water in an efficient way.
For the provider-climate system, a sustained increase in temperature and a decrease in precipitation lead to an increase in the exploitation of supply sources and an increase in the deficiency of the infrastructure for the distribution of drinking water, with a consequent generation of social, political, economic and environmental problems. The control of water leaks will allow making the most of the available resource without wasting it, thus reducing the exploitation of supply sources of water. This will contribute to a state in which there are no social conflicts due to the lack of the vital liquid.

