


 nueva página del texto (beta)
 Inglés (pdf)
 Artículo en XML
 Referencias del artículo
 Enviar artículo por email
 Citado por SciELO
  Similares en
SciELO
Similares en
SciELO 
 Permalink
1. Introduction
Latin America exhibits the highest urbanization rate in the world, with more than 80% of its population living in cities and the fastest growth (Cohen, 2004; Sanchez-Rodriguez and Bonilla, 2007). These urbanization processes have not been accompanied by long-term urban planning strategies or robust environmental controls. Consequently, despite improvements made in the last decade, cities in the region still have an obsolete vehicle fleet and highly polluting industries within densely populated areas (Green and Sánchez, 2013; Henríquez and Romero, 2019; Huneeus et al., 2020; Sanchez-Rodriguez and Bonilla, 2007). Recent economic growth has exacerbated the problem by increasing motorization rates as a result of higher income per capita and, hence, intensifying traffic congestion and emissions (Mangones et al., 2019; Gómez Gélvez and Obando Forero, 2014).
Small towns and cities within large metropolitan areas or close to larger cities in the region are now following similar fast-growth processes as a result of urban sprawl, already suffering from poor air quality (Piña, 2014). As traffic congestion and other difficulties increase in large urban centers, part of the population and some businesses and industries decide to move to neighboring towns, leading to an unplanned growth. In other cases, these towns and cities have been providing goods and services to large cities for long periods but have not been able to benefit from their activity, owing to multiple factors, including corruption, lack of political will and weak institutions. As a result, they have suffered poverty and strong environmental degradation, including severe air pollution, driven by the fast growth of large cities (Pardo and Alfonso, 2013). However, their specific air pollution problems have been barely investigated.
Bogotá is Colombia’s capital and largest city, with ca. 8 million inhabitants. It is located in northern South America (4º 39’ N, 74º 06’ W) on a plateau at 2,600 m.a.s.l. in the middle of the oriental branch of the Colombian Andes. Air pollution has been monitored for more than 20 years, showing that particulate matter is the most important air pollutant, frequently exceeding the Colombian ambient air quality standards, higher than the WHO air quality guidelines (Green and Sánchez, 2013; Henríquez and Romero, 2019). Several studies have determined PM10 source contributions using receptor models and have estimated emission inventories. The city government, through its environmental agency, Secretaría Distrital de Ambiente (SDA), has partially implemented a ten-year pollution abatement plan that started in 2010, based on some of these studies. The contribution of different sources to particulate matter air pollution is fairly well understood in Bogotá. Vargas et al. (2012) and Vargas and Rojas (2010) have shown that mobile sources (60%), resuspended dust (9%), and secondary pollutants and long-range transport contribute to PM10 in a residential/commercial area, whereas industrial emissions (44%), mobile emissions (35%) and resuspended dust (21%) contribute to PM10 in an area with mixed activities (residential, commercial, industrial). In a longer study, (Ramírez et al., 2018a) found that 51% of PM10 was attributable to dust resuspension (28% to enriched fugitive dust and 23% to road dust), 23% to vehicle exhaust, 21% to secondary aerosol, and 5.1% to industrial sources (4.4% to ferrous smelters and 0.5% to Pb-related emissions) in a central urban background site. Analyzing the carbonaceous compounds at the same site and during the same period, (Ramírez et al., 2018b) found that Elemental Carbon was 9%, Primary Organic Carbon (POC) was 13.2% and Secondary Organic Carbon was 10.8% of PM10, and that the OC/EC ratio ranged from 1.66 in June to 4.88 in March. Primary sources (industrial and vehicle exhaust emissions) dominate the organic fraction of PM10 from June to August, whereas Secondary Organic Carbon (SOC), probably from different sources, dominates the organic fraction during the rest of the year. Note that even though PM2.5 has a higher association with morbidity and mortality of the population, source apportionment studies in Bogotá have been focused on PM10, and that no study has applied a Chemical Mass Balance model. Moreover, no study has been conducted to investigate in depth the organic fraction of the aerosol.
The metropolitan area of Bogotá includes additionally 3 counties (Sabana Centro, Sabana Occidente, and Soacha), with 12 municipalities and a population of ca. 1.5 million inhabitants (Figure S1), which are under the jurisdiction of a different environmental agency, Corporación Autónoma Regional de Cundinamarca (CAR). These counties have industrial areas and are currently facing a challenging growth process of their economy and their population, associated with Bogotá’s urban sprawl. Some of their towns have suffered air pollution impacts for several years and others are recently starting to experience them. Particulate matter has been identified as the most concerning pollutant of the area under the jurisdiction of CAR, frequently exceeding the Colombian ambient air quality standards. The Soacha county, with ca. 550,000 inhabitants, and the Sabana Occidente county, with ca. 420,000 inhabitants, are of special interest because of the presence of important industrial districts in the towns of Soacha, Mosquera, Funza, Madrid and Facatativá; mining for construction materials and clay in Soacha; and national roads that connect Bogotá with western and southern cities and the Pacific coast. This work will focus on these counties, with sites in Soacha and Mosquera. Figure S2 shows the map of the Sabana Occidente county and the location of the Soacha and Mosquera monitoring sites. Bogotá’s ten-year pollution abatement plan did not include these neighboring counties but only its main urban center, the Distrito Capital (Capital District). Source contribution to particulate matter is unknown in this area (Zafra Mejía et al., 2013). Therefore, in addition to improving emission inventories, the chemical characterization of airborne particulate matter and the application of receptor models are necessary and valuable to determine the source contribution to particulate matter, particularly PM2.5. This source contribution is essential to design an appropriate and prioritized air pollution abatement plan for these counties.
Given the importance of the carbonaceous fraction of PM10 in Bogotá found by Ramírez et al. (2018b), and the higher association of PM2.5 with health effects than PM10, the aim of this work was to determine the source apportionment to PM2.5 using molecular markers (Bullock et al., 2008; Huang et al., 2015; Lambe et al., 2009; Oros and Simoneit, 2000; Robinson et al., 2006; Schauer et al., 1996; Shrivastava et al., 2007; Stone et al., 2008; Villalobos et al., 2017, 2015) and to understand the incremental excess between two neighboring towns of Bogotá. Similar studies in Latin America have focused on the source contributions to fine particulate matter in Temuco and Santiago (Villalobos et al., 2017, 2015), and Mexico (Stone et al., 2010, 2008; Vega et al., 2004). On the other hand, McGinnis et al. (2014) examined PM2.5 concentrations, source contributions, and incremental excess across three sites in the same airshed in Wisconsin, USA.
This study will determine the chemical composition of PM2.5 in two sites adjacent to Bogotá and assess source contributions to PM2.5, based on the concentrations of molecular markers and the application of the chemical mass balance (CMB) model to better characterize the air pollution problem at the regional scale.
2. Methods
2.1. Sampling sites and strategy
Sampling sites were installed in Mosquera (in Sabana Occidente county) and Soacha (in Soacha county), western neighboring towns of Bogotá’s Capital District, both influenced by industrial activities and the transit of a high volume of trucks, buses, and vehicles. The sampling sites were separated 13.1 km. The Mosquera sampling site (4º42’9.75” N, 74º13’54.94” W) was located at a 7-m high monitoring platform regularly used for manual particulate matter monitoring, in the middle of the Villa Olímpica public sports fields. Mosquera has ca. 83,000 inhabitants and has an important industrial corridor, with food and beverage, metalwork, and plastics sectors contributing significantly. The Soacha sampling site (4º35’4.59” N, 74º13’11.62” W) was located on the roof of the 5-story Mario Gaitán Yanguas Public Hospital building. The hospital is on a narrow but congested street, with a medium volume of vehicles and small buses, at 620 meters from Autopista Sur, the main corridor connecting Bogotá with southern and western Colombia and one of the most congested highways in the country, particularly because of a massive volume of heavy-duty trucks. Soacha also has a large industrial corridor, with mining for construction materials a significant activity, which keeps growing at an alarming rate under insufficient planning provisions.
Simultaneous sampling of 24-h integrated PM2.5 filters was performed at each site between 12 September 2014 and 11 November 2014 using paired samplers. In Soacha, three 16.7 lpm speciation samplers (Rupprecht & Patashnick, USA), one loaded with a PTFE filter (Zefluor membrane, 2 µm, 47 mm, Pall Corporation, USA) and two loaded with quartz filters (QMA, 47 mm, Whatman, USA), were used. In Mosquera, one 16.7 lpm speciation sampler was loaded with a PTFE filter and one high volume sampler equipped with a brushless monitor (TE-1000, 200 lpm, Tisch Environmental, USA) was loaded with a 100-mm quartz filter, cut from a larger sheet (QM-A, 203.2 x 254 mm, Whatman, USA). PTFE filters were used to determine PM2.5 mass, ions and trace metals, and quartz filters to determine ECOC and organic tracer speciation. Before and after sampling, filters were stored and transported in Petri dishes, with internal aluminum foil holders and an external Teflon tape seal, refrigerated at -20ºC until chemical analyses.
To ensure an appropriate mass loading for chemical speciation, filters compositing was performed. Composites from stage 1 corresponded to 3 groups of consecutive days of the same week: Monday-Tuesday, Wednesday to Friday, and Saturday-Sunday, which were analyzed for WSOC and ions. Any differences in these components between weekdays and weekends could be detected in this way. Composites from stage 2 corresponded to weekly groups, which were analyzed for metals and organics. As a result, 25 composites from stage 1 and 9 weekly composites of each filter material at each site were formed.
2.2. PM 2.5 mass concentration and chemical analysis
Teflon filters used for gravimetric analysis were conditioned at 20±3ºC and 35±5% for 24-48 h before being weighed with a microbalance (MX5, ±1 µg, Mettler Toledo, USA). Each filter was weighed three times and re-weighed if a difference higher than 15 µg in consecutive weights was found.
Three samples per week from each site were analyzed for organic carbon (OC), elemental carbon (EC), Water-Soluble Organic Carbon (WSOC), and water-soluble inorganic ions (WSII). EC and OC were determined through the NIOSH thermal optical transmission method and flame ionization detection (FID) (Schauer et al., 2003) on a 1.0 cm2 quartz filter punch in a Thermal Optical Analyzer (Sunset Laboratories, Forest Grove, OR, USA). WSOC was determined using a TOC-V SCH Shimadzu total organic carbon analyzer on an extract of a quarter of each PTFE filter in 15 mL of Milli-Q water (Miyazaki et al., 2011; Yang et al., 2003). The difference OC - WSOC produced the Water-insoluble organic carbon (WIOC), with an uncertainty calculated by uncertainty propagation. WSII were analyzed using ion chromatography (IC) (Dionex ICS 2100 and Dionex ICS 100) (Wang et al., 2005). Seven ions were measured: sulfate, nitrate, chloride, sodium, ammonium, potassium, and calcium.
Weekly composites for each site with at least 500 μg of OC were prepared to analyze organic compounds by gas chromatography/mass spectrometry (GC-6980, quadrupole MS-5973, Agilent Technology). Isotopically-labeled standard solutions were used to spike the filter composites before the extraction using four alternate and equal volumes of dichloromethane and acetone, each one sonicated for 20 minutes. Solvents were evaporated in a rotavapor and reduced in volume by blowing ultrapure nitrogen. Two aliquots of each extract were analyzed by GC-MS. In the first one, diazomethane was used to derivatize carboxylic acids. In the second one, a silylating reagent derivatized hydroxyl groups (Nolte et al., 2002; Stone et al., 2008). A sample of SRM 1649a (Urban Dust, NIST) and a standard spike sample were analyzed together with each batch of samples for quality control. All concentrations were blank-corrected. Uncertainties were estimated using the detection limits of the instruments and the standard deviation of field blanks. Details on the analytical methods can be found elsewhere (Villalobos, 2015; Miyazaki et al., 2011; Stone et al., 2008; Wang et al., 2005; Schauer et al., 2003; Yang et al., 2003; Nolte et al., 2002).
2.3. Source apportionment
The EPA Chemical Mass Balance model software CMB v8.2 (Watson et al., 1984) was used to estimate primary source contributions to organic carbon (OC) for the eight weekly composite samples at each site. Organic compounds included in the model were selected for their stability and low volatility during their transport in the atmosphere (Schauer et al., 1996): polycyclic aromatic hydrocarbons (such as benzo(b)fluoranthene, benzo(k)fluoranthene, benzo(e)pyrene, indeno(1.2.3-cd)pyrene, benzo(ghi) perylene, ABB-20R-C27-cholestane, ABB-20R-C29-sitostane, ABB-20S-C29-sitostane) as tracers of vehicle emissions and biomass burning (Ravindra et al., 2008); picene as a tracer of coal combustion (Oros and Simoneit, 2000); hopanes (such as 17α(H)-22. 29. 30-trisnorhopane, 17α(H)-21β(H)-30-norhopane, 17α(H)-21β (H)-hopane) as tracers of gasoline, diesel, and fuel oil combustion (Rogge et al., 1997; Schauer et al., 1996; Shrivastava et al., 2007); and levoglucosan as a tracer of biomass burning (Bi et al., 2008; Fine et al., 2004; Huang et al., 2015; Pereira et al., 2019; Rincón-Riveros et al., 2020; Simoneit et al., 1999; T. Zhang et al., 2008; Zhang et al., 2007). Since no local source profiles were available, we selected published source profiles for the model: natural gas combustion (Rogge et al., 1993), diesel vehicles (Lough et al., 2007; Lough and Schauer, 2007), gasoline vehicles (Lough et al., 2007; Lough and Schauer, 2007), wood smoke (Fine et al., 2004) and residential coal burning (Zhang et al., 2008) assimilating small facilities. These sources have been used in Latin America by Villalobos et al. (2017; 2015) for source apportionment in Santiago and Temuco, Chile. Other source profiles such as meat cooking and vegetative detritus were included in preliminary runs of the model but were not found to produce acceptable results. Source contributions to OC from the CMB model were converted to PM2.5 contributions using specific OC/PM2.5 ratios for each source (Sheesley et al., 2007; Turpin and Lim, 2001; Zhang et al., 2008). As it will be shown, sources that were not resolved by the CMB model were assumed to be associated with secondary organic compounds and converted using an OC/PM2.5 ratio of 0.5 (Daher et al., 2012; Turpin and Lim, 2001; Utembe et al., 2009; Yin et al., 2010), even though there may be other unresolved sources such as meat cooking and trash burning.
2.4. Backward trajectories
Potential pollutant sources were identified based on cluster and 2D kernel density analysis of backward trajectories (BWT) of air masses during the sampling periods (weekly from 15 September 2014 to 9 November 2014). The HYSPLIT Lagrangian back trajectory model (Stein et al., 2015) was used to track the origin and location of air masses arriving at the sampling sites (Mosquera: 4º42’9.75” N, 74º13’54.94” W, and Soacha: 4º35’4.59” N, 74º13’11.62” W). The configuration used by Mendez-Espinosa et al. (2019) to calculate BWT was followed. BWTs were calculated eight times per day (starting at 1 UTC-5 <local time>, every 3 hours). Each trajectory was computed for 72 h to analyze short, middle, and long-range transport in the mesoscale (less than 600 km). The Global Data Assimilation System of 1º x 1º (GDAS1) was used as input gridded meteorological dataset since it is more suitable over complex topography and diversified land uses (Su et al., 2015), using SplitR v0.4 R-package by (Iannone, 2016). As the inaccuracy of BWT models could be directly proportional to shorter receptor heights given that local winds, turbulence processes, and frictional effects cannot be accurately represented (McGowan and Clark, 2008; Sapkota et al., 2005; Zielinski et al., 2016), BWT were calculated for two receptor heights: 500m, and 1000m above ground level (AGL). Receptor heights were set up below and near mixing height (~1500m/year) (Mendez-Espinosa et al., 2019). BWT were linked with pollutant species, hereafter, they were grouped according to their angle. Angular distance clustering was computed using the OpenAir package (Carslaw and Ropkins, 2012). The results are shown as concentration per chemical concentrations associated with clustering trajectories. Then, back-trajectories density maps were created by clusters to estimate the areas with the larger density of points related to the geo-location of air masses.
In the cluster analysis, a normality test (Shapiro-Wilk) was applied to the data. No dataset per cluster and pollutant was found to be normally distributed, and therefore, non-parametric Kruskal-Wallis tests (one-way ANOVA on ranks) were calculated to determine whether or not there was a significant difference (p-value <0.05) among clusters per observed pollutant.
3. Results and Discussion
3.1. PM 2.5 mass concentrations, bulk composition, and mass reconstruction
Daily PM2.5 concentrations, shown in Figure S3, during the sampling period were 31 ± 15 µg m-3 in Soacha (max. 78 µg m-3) and 26 ± 12 µg m-3 in Mosquera (max. 87 µg m-3). The percentage of samples exceeding the current Colombian Air Quality Standard (37 µg m-3) and the WHO guideline (25 µg m-3) was 30%, and 60% respectively in Soacha, 16%, and 45% respectively in Mosquera. Figure 1 shows daily scatter plot comparisons of PM2.5 and major constituents (3 samples per week were analyzed) between Soacha and Mosquera. For each chemical species, the Pearson correlation coefficient (r) and the Coefficient of Divergence (COD) between both sampling sites were calculated. The Pearson coefficient shows the degree of correspondence, so values close to 1 indicate that concentrations at both sites are proportional. The COD shows the heterogeneity, so values lower than 0.2 indicate that concentrations have a homogeneous spatial distributions between both sites and values close to 1 indicate that concentrations are heterogeneous (Xie et al., 2012; Yatkin et al., 2020). Nitrate (r = 0.75, COD = 0.29), sulfate (r = 0.66, COD = 0.27) and calcium (r = 0.70, COD = 0.27) concentrations showed the highest r, suggesting that there is some regional influence of secondary inorganic aerosols and dust, although their spatial distribution was heterogeneous. EC (r = -0.02, COD = 0.25), OC (r2 = -0.05, COD = 0.23) and PM2.5 (r = 0.12, COD = 0.25), are poorly correlated and heterogeneous, which suggests that the main sources of PM2.5 and its carbonaceous fractions are local at both sites.
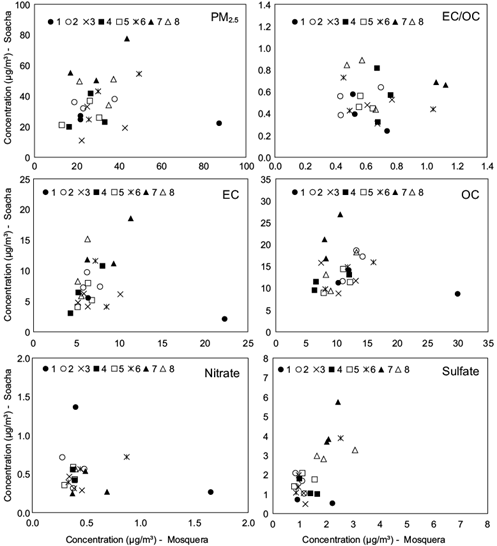
Fig. 1 Daily scatter plot comparisons of PM2.5 and major constituents between Soacha and Mosquera. 3 daily samples were analyzed per week. Different symbols represent different weeks.
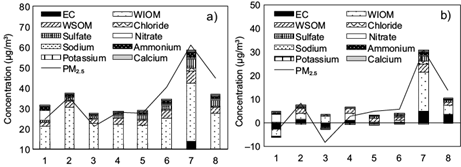
PM2.5 mass reconstruction was performed for the three samples per week analyzed from each site, by adding EC, Organic Material (OM) and WSII. OM concentrations were calculated using an OM/OC factor of 1.6 for both sites, as recommended by Turpin and Lim (2001) for urban aerosols. Reconstructed mass was 104 ± 25% and 103 ± 26% in Soacha and Mosquera, respectively. OM constituted a large fraction of PM2.5, with 68 ± 19% (22.3 ± 7.1 µg m-3) and 63 ± 19% (17.8 ± 7.6 µg m-3) in Soacha and Mosquera, respectively. EC represented 21 ± 5% and 25 ± 5% of PM2.5, respectively. The most abundant ion was Sulfate (5.7 ± 2.0% and 5.4 ± 2.8%), followed by ammonium (3.0 ± 1.3% and 2.9 ± 1.4%) and nitrate (1.5 ± 0.7% and 1.8 ± 0.3%). Chloride (1.5 ± 0.6% and 1.1 ± 0.6%) and Calcium (1.3 ± 0.8% and 1.5 ± 0.8%) contributions to PM2.5 are as high as nitrate. Figure S4 shows the PM2.5 mass reconstruction for all the samples analyzed at both sites: 3 samples per week for 8 weeks. Figure 2a shows the weekly average PM2.5 concentrations and bulk composition at Soacha. Figure 2b and Table SII show the incremental excess of PM2.5 concentrations and bulk composition in Soacha compared to Mosquera. An excess of PM2.5 was found in Soacha compared to Mosquera for most of the sampling period, excepting weeks 1 and 3. Similarly, an excess of the PM2.5 carbonaceous fractions (EC, WIOM, and WSOM) was found in Soacha compared to Mosquera, excepting EC in weeks 1, 3, and 5, and WIOM in week 1. A mixed situation was found for ions.
3.2. Molecular markers
Molecular markers used in the CMB model made up a small fraction of OM, but they are useful to identify and quantify the OM and PM2.5 sources. Table SI shows the weekly average concentrations of organic fractions and molecular markers with their corresponding uncertainties, and variability metrics for each species (median, interquartile range and standard deviation). Even though the sampling period was short, the observed concentration variability was reasonably good for the application of the CMB model.
Figures 2 to 7 show the weekly concentrations of EC + OC and molecular markers in Soacha (part a) and the incremental excess of EC + OC and molecular markers in Soacha compared to Mosquera (part b). EC + OC showed similar temporal trends to PM2.5 at both sites, with higher-than-average concentrations at Soacha during weeks 2 and, especially, during week 7 (Fig. 3a). There was a consistent incremental excess of EC at Soacha compared to Mosquera, with the only exception of week 1. The incremental excess of OC at Soacha compared to Mosquera (Fig. 3b) was negative in weeks 1, 3, and, to a lesser extent, 5, and positive for the rest of the weeks, with higher excess in weeks 7 and 8. OC/EC ratios were 1.91 ± 0.37 at Soacha and 1.60 ± 0.30 at Mosquera. These ratios can be considered as typical of urban aerosols with an influence of secondary aerosol formation (Blanchard et al., 2011; Khan et al., 2012). They were lower than the ratios measured in Santiago (Villalobos et al., 2015) and Temuco (Villalobos et al., 2017) - with a high influence of biomass burning for heating in winter. They were similar to the ratio found at Xalostoc industrial site and lower than those at La Merced commercial site and Pedregal residential site in Mexico City (Vega et al., 2004).
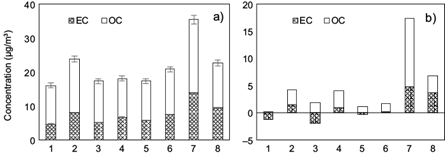
Fig. 3 a) Weekly EC and OC concentrations in Soacha and b) Incremental excess of EC and OC in Soacha compared to Mosquera.
Individual concentrations of PAHs in Soacha (Fig. 4a) were 1.98 ± 0.77 ng m-3 for benzo[b]fluoranthene, 1.69 ± 0.64 ng m-3 for benzo[k]fluoranthene and 1.69 ± 0.64 ng m-3 for benzo[e]pyrene). They were in a similar range to those measured in Temuco and lower than those in Santiago during winter (Villalobos et al., 2017, 2015), but 20 times higher than near an oil refinery in northeastern Mexico (Montaño-Soto et al., 2017), 10 times higher than in Monterrey, Mexico (Longoria-Rodríguez et al., 2020) and around 70%-80% of the levels found in Cuernavaca, México (Murillo-Tovar et al., 2018; Saldarriaga-Noreña et al., 2015). Incremental excess of all these compounds in Soacha compared to Mosquera (Fig. 4b) were negative in weeks 1, 3, 5, and, particularly, 8. The negative excess was consistent for benzo(k)fluoranthene for the rest of the period. There was also a slight negative excess of benzo(e)pyrene in week 2 for benzo(e)pyrene. Overall, the incremental excess in Soacha tended to be negative for these PAHs (Fig. 4b).
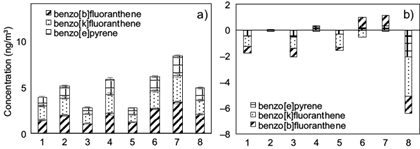
Fig. 4 a) Weekly PAH concentrations in Soacha and b) Incremental excess of PAH in Soacha compared to Mosquera.
Picene concentrations were around one half and 75% of those measured in Temuco (Villalobos et al., 2017) at Soacha (Fig. 7a) and Mosquera (0.37 ± 0.09 ng m-3 and 0.55 ± 0.13 ng m-3, respectively), showing that coal burning contributes to PM2.5 at both sites. Picene was not detected during week 3 at Mosquera. The incremental excess (Fig. 7b) was positive only for weeks 3, 4, and 7 (Fig. 7b). Overall, picene concentrations suggest that the impact of coal burning is similar at both sites.
Hopane concentrations were 1.27 ± 0.20 ng m-3 at Soacha (Fig. 5a) and 2.81 ± 0.24 ng m-3 at Mosquera, a similar range to that found in Santiago (Villalobos et al., 2015) and Mexico City (Stone et al., 2008), and higher than in Temuco (Villalobos et al., 2017). All the hopanes included in this analysis had a negative incremental excess in Soacha, showing a lower impact of gasoline vehicles compared to Mosquera (Fig. 5b).
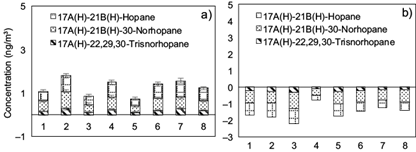
Fig. 5 a) Weekly hopanes concentrations in Soacha and b) Incremental excess of hopanes in Soacha compared to Mosquera.
The sum of concentrations of n-Alkanes from C27 to C33 were 34.2 ± 9.46 ng m-3 at Soacha (Fig. 6a) and 54.8 ± 5.86 ng m-3 at Mosquera, 1.8 and 3-fold the concentration measured in Temuco (Villalobos et al., 2017) and similar to those measured in Santiago before and after wintertime (Villalobos et al., 2015). For most of the sampling weeks, the incremental excess of n-alkanes in Soacha was negative, except for octacosane in week 4; heptacosane, octacosane, and nonacosane in week 7 (Fig. 6b). The Carbon Preference Index - CPI applied to the C28 to C33 n-alkanes had values of 0.82 to 0.99 at Soacha and 1.04 to 1.42 at Mosquera, indicating that n-alkanes in PM2.5 originate from anthropogenic sources.
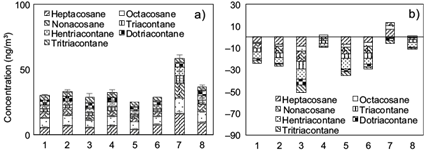
Fig. 6 a) Weekly alkanes concentrations in Soacha and b) Incremental excess of alkanes in Soacha compared to Mosquera.
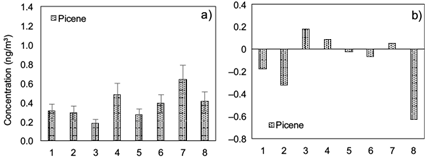
Fig. 7 a) Weekly picene concentrations in Soacha and b) Incremental excess of picene in Soacha compared to Mosquera.
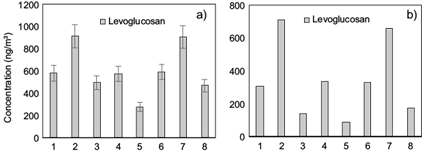
Levoglucosan concentrations were 599.7 ± 72.35 ng m-3 at Soacha (Fig. 8a) and 258.3 ± 28.5 ng m-3 at Mosquera, similar to those measured in Santiago between April and May (Villalobos et al., 2015), and 70% and 30%, respectively, of those measured in Temuco (Villalobos et al., 2017), a city that is known for its high wood-burning contribution to PM2.5 in winter. The incremental excess in Soacha was positive throughout the sampling period, indicating a much stronger impact of wood burning compared to Mosquera (Fig. 8b). The average Levoglucosan/PM2.5 ratio was slightly lower than that in Temuco in winter and Santiago from June to September at Soacha (0.018) and one half of that value at Mosquera (0.009). Levoglucosan had a similar trend to PM2.5 at Soacha, with a higher peak during week 2 and low concentration during week 5. At Mosquera, levoglucosan did not have strong variations and showed a fairly similar trend to PM2.5.
3.3. Chemical mass balance source apportionment to organic carbon
The sources that are more likely to contribute to organic carbon at the two sites are diesel trucks, gasoline vehicles, natural gas combustion, coal combustion in small facilities, and wood combustion in local bakeries. The ratio-ratio plots for Indeno(1,2,3-cd)pyrene x 1000/EC and benzo(g,h,i)perylene x 1000/EC in Figure S7, suggested by Robinson et al. (2006) as a useful tool to visualize the potential combination of sources, shows that all the ambient samples fell within the region formed by connecting the ratios of the source profiles selected for applying the CMB model. Ambient samples in Soacha (Fig. S7a) were close to the line connecting the ratios for wood combustion and diesel vehicles, whereas those in Mosquera (Fig. S7b) fell in the center of the polygon, showing that gasoline vehicles and coal combustion may have a higher contribution than in Soacha.
Considering the concentration/uncertainty ratios shown in Figure S6, and results from preliminary runs of the CMB model, the fitting species selected for the definite run were: EC, benzo(b)fluoranthene, benzo(k)fluoranthene, benzo(e)pyrene, benzo(g,h,i)perylene, 17A(H)-22,29,30-Trisnorhopane, 17A(H)-21B(H)-30-Norhopane, 17A(H)-21B(H)-Hopane, ABB-20R-C27-Cholestane, ABB-20R-C29-Sitostane + ABB-20S-C29-Sitostane, Levoglucosane and Picene.
CMB model results are shown in Table I, including the values for the fitting statistics r2 and χ2, and the percent of OC mass explained by the model. r2 values above 0.97 and χ2 values below 2.2 indicate a good fit between the selected sources and ambient measurements at both sites. The percent of OC mass explained by the model was within the accepted range (80% - 120%) for just half of the weekly samples at both sites and lower than 80% for the other half. The unexplained mass was considered to be due to “Other” source, which was calculated as the difference between the measured OC concentration and the sum of the calculated concentrations of the significant fitting sources. It is, therefore, a measure of unresolved sources. Wood combustion, diesel vehicles, and gasoline vehicles had significant contributions for all samples at both sites. Natural gas combustion was not significant during weeks 2 and 3 at both sites. Coal combustion at small facilities was not significant during weeks 1 and 3 at Soacha and was significant only during weeks 4, 7, and 8 at Mosquera. Other sources were not significant during weeks 2, 4, and 6 at Soacha, and during weeks 3 and 7 at Mosquera.
Table I Source contribution to OC at the study sites. Significant sources are shown in bold.
| a) Soacha | |||||||||
| Week | Wood burning µg m-3 | Natural gas µg m-3 | Diesel µg m-3 | Gasoline µg m-3 | Coal µg m-3 | Other µg m-3 | R2 | χ2 | % OC Mass |
| 1 | 5.66 ± 1.26 | 0.04 ± 0.02 | 1.40 ± 0.16 | 2.04 ± 0.23 | 0.06 ± 0.04 | 2.23 ± 1.24 | 0.97 | 1.89 | 80.9 |
| 2 | 8.88 ± 1.94 | 0.02 ± 0.03 | 2.48 ± 0.27 | 3.15 ± 0.34 | 0.12 ± 0.05 | 1.13 ± 1.90 | 0.98 | 1.1 | 92.9 |
| 3 | 4.81 ± 1.09 | 0.02 ± 0.02 | 1.61 ± 0.17 | 1.78 ± 0.20 | 0.04 ± 0.03 | 3.97 ± 1.07 | 0.97 | 1.74 | 67.8 |
| 4 | 5.78 ± 1.31 | 0.08 ± 0.03 | 2.13 ± 0.22 | 2.21 ± 0.28 | 0.18 ± 0.06 | 0.98 ± 1.30 | 0.98 | 1.26 | 91.4 |
| 5 | 2.80 ± 0.68 | 0.02 ± 0.01 | 1.94 ± 0.19 | 1.35 ± 0.16 | 0.09 ± 0.03 | 5.37 ± 0.69 | 0.98 | 1.36 | 53.6 |
| 6 | 6.05 ± 1.37 | 0.06 ± 0.02 | 2.36 ± 0.24 | 2.14 ± 0.25 | 0.23 ± 0.06 | 2.57 ± 1.35 | 0.99 | 0.65 | 80.8 |
| 7 | 9.37 ± 2.09 | 0.11 ± 0.04 | 4.58 ± 0.44 | 2.51 ± 0.31 | 0.23 ± 0.07 | 4.78 ± 2.07 | 0.98 | 1.33 | 77.9 |
| 8 | 4.80 ± 1.10 | 0.04 ± 0.02 | 3.21 ± 0.30 | 2.03 ± 0.24 | 0.17 ± 0.05 | 2.93 ± 1.11 | 0.98 | 1.15 | 77.7 |
| Average | 6.02 ± 1.35 | 0.06 ± 0.02 | 2.46 ± 0.25 | 2.15 ± 0.25 | 0.17 ± 0.05 | 3.86 ± 1.23 | |||
| b) Mosquera | |||||||||
| 1 | 1.96 ± 0.52 | 0.08 ± 0.03 | 1.59 ± 0.19 | 5.01 ± 0.53 | 0.08 ± 0.07 | 2.58 ± 0.58 | 0.97 | 2.02 | 77.7 |
| 2 | 1.46 ± 0.39 | 0.02 ± 0.03 | 1.71 ± 0.22 | 6.65 ± 0.71 | 0.08 ± 0.08 | 3.14 ± 0.67 | 0.96 | 2.13 | 76.6 |
| 3 | 1.46 ± 0.39 | 0.02 ± 0.03 | 1.71 ± 0.22 | 6.65 ± 0.71 | 0.08 ± 0.08 | 0.47 ± 0.54 | 0.96 | 2.13 | 96.4 |
| 4 | 1.70 ± 0.45 | 0.08 ± 0.02 | 1.69 ± 0.18 | 3.58 ± 0.41 | 0.17 ± 0.06 | 1.01 ± 0.43 | 0.98 | 1.18 | 87.7 |
| 5 | 1.36 ± 0.36 | 0.05 ± 0.02 | 1.77 ± 0.20 | 4.27 ± 0.46 | 0.08 ± 0.05 | 2.94 ± 0.54 | 0.97 | 1.71 | 72.4 |
| 6 | 1.85 ± 0.49 | 0.09 ± 0.03 | 2.11 ± 0.24 | 5.02 ± 0.55 | 0.06 ± 0.06 | 2.93 ± 0.62 | 0.96 | 2.18 | 76.1 |
| 7 | 1.76 ± 0.47 | 0.12 ± 0.03 | 2.86 ± 0.29 | 4.14 ± 0.51 | 0.22 ± 0.08 | -0.07 ± 0.47 | 0.98 | 1.39 | 100.8 |
| 8 | 2.12 ± 0.57 | 0.25 ± 0.05 | 1.51 ± 0.17 | 3.99 ± 0.51 | 0.40 ± 0.12 | 1.90 ± 0.53 | 0.98 | 1.35 | 81.3 |
| Average | 1.71 ± 0.46 | 0.11 ± 0.03 | 1.87 ± 0.21 | 4.92 ± 0.55 | 0.26 ± 0.09 | 2.42 ± 0.56 | |||
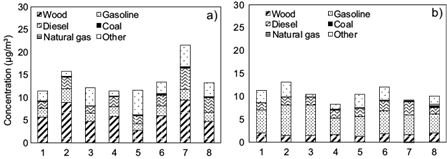
The main contributor to OC in Soacha (Fig. 9a) was wood combustion (6.02 ± 1.35 µg m-3) followed by diesel vehicles (2.46 ± 0.25 µg m-3), other sources (3.86 ± 1.23 µg m-3), gasoline vehicles (2.15 ± 0.25 µg m-3), coal combustion in small facilities (0.17 ± 0.05 µg m-3) and natural gas combustion (0.06 ± 0.02 µg m-3). In Mosquera (Fig. 9b), the main contributors were gasoline vehicles (4.92 ± 0.55 µg m-3), followed by other sources (2.42 ± 0.56 µg m-3), diesel vehicles (1.87 ± 0.21 µg m-3), wood combustion (1.71 ± 0.46 µg m-3), coal combustion in small facilities (0.26 ± 0.09 µg m-3) and natural gas combustion (0.11 ± 0.03 µg m-3).
The use of chemical source profiles from the USA in Colombia is indeed a source of uncertainty in determining source contribution by using the CMB model, especially regarding vehicle technologies and fuels. The vehicle emission profiles used here were developed from a wide range of technologies of the Californian fleet (1975-2001), in which the Colombian fleet can be considered to be included. On the other hand, Colombian fuels meet similar standards to those in place in California over that period. Therefore, the true emission profiles can be thought to be inside the range of the profiles documented by Lough and Schauer (2007).
3.4. Source apportionment to PM 2.5
Figure 10 shows the results of the source contribution to PM2.5, after applying specific OC to PM2.5 factors to the source contributions to OC and adding the concentrations of WSII. The main contributors at Soacha (Fig. 10a) were wood combustion (7.20 ± 2.59 µg m-3), diesel vehicles (6.05 ± 2.51 µg m-3), secondary organic aerosols (5.99 ± 3.21 µg m-3), coal combustion in small facilities (3.49 ± 1.87 µg m-3) and gasoline vehicles (2.77 ± 0.68 µg m-3). At Mosquera (Fig. 10b), the main contributors were gasoline vehicles (6.33 ± 1.52 µg m-3), diesel vehicles (4.58 ± 1.07 µg m-3), secondary organic aerosols (3.73 ± 2.49 µg m-3), coal combustion at small facilities (3.65 ± 2.91 µg m-3) and wood combustion (2.04 ± 0.32 µg m-3). The average undetermined mass was 8% of PM2.5 at Soacha (max 27%) and 11% of PM2.5 at Mosquera (max 30%). This fraction may be associated with dust and other industrial and commercial sources. Previous source apportionment studies in Bogotá had been made for PM10 (Ramírez et al., 2018a; Ramírez et al., 2018b; Vargas et al., 2012), not for PM2.5, and could not resolve the contributions of different types of vehicles.
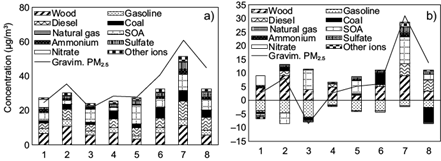
Fig. 10 a) Weekly source contribution to PM2.5 from molecular markers in Soacha and b) Incremental excess of source contributions to PM2.5 in Soacha compared to Mosquera.
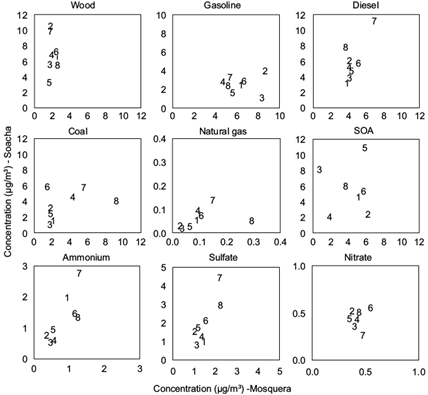
The scatter plot comparisons of source contributions between Soacha and Mosquera (Fig. 11) shows relatively high correlations for ammonium (r2 = 0.64) and sulfate (r2 = 0.72), associated with the regional contribution of secondary inorganic aerosols during the sampling period. The correlation was also high for the contribution of diesel exhaust, which can be attributed to similar behavior of the cargo fleet traffic at both sites. Natural gas contributions were well correlated between both sites most of the time, but a higher contribution in Mosquera in week 8 appears as an outlier. Other sources are not well correlated, indicating that they only have local influence. The high variability in the contribution of wood combustion in Soacha contrasts with the fairly constant contribution in Mosquera. The opposite is shown for the contribution of gasoline, more variable in Mosquera, and less variable in Soacha.
In summary, even though chemical source profiles were not developed in Colombia, these source apportionment results are reasonable when considering the characteristics and activities found around the sites and suggest that future emission inventories exercises should not underestimate the importance of wood and coal burning in small facilities, often neglected.
3.5. Backward trajectories
Back-trajectory kernel densities for both sites for the whole sampling period (Fig. 12) show three clusters. C1 corresponds to air masses arriving from the Orinoco basin, passing over Bogotá, with 64.6 % of the trajectories. C2 (24.7 %) has mixed trajectories from the Orinoco basin and influence of the Amazon rainforest in the South, arriving at the sites from the East, having passed over Bogotá. C3 (10.7 %) arrives from the Northwest, with air masses from the Magdalena Valley, between the Central and Eastern Colombian Andes, and the influence of the Pacific Coast.
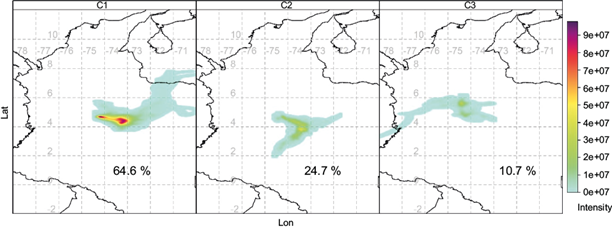
Fig. 12 Kernel densities of backward trajectories arriving at Soacha and Mosquera. Percentages correspond to the contribution of C1, C2, and C3 back trajectory clusters at each site.
For a more detailed view, weekly kernel densities are shown in Figure S8. Three clusters per week are plotted, and the percentage of trajectories represented by each cluster per week is indicated. The great majority of the air mass trajectories arrive at both sites from the eastern savanna, which is part of the Orinoco basin, having passed over Bogotá. In several weeks, two of the three clusters, or even the 3 clusters found do not differ significantly from each other. In week 7, clusters C1 and C2 arriving at Soacha can be associated with C1 arriving at Mosquera, while cluster C3 arriving at Soacha can be associated with clusters C2 and C3 arriving at Mosquera.
Higher wind speeds, and therefore longer trajectories, were observed during week 1 and, to a lesser extent, during week 8, for trajectories arriving from the East. Trajectories in cluster C3 in week 4 (21.4 % and 23.8 %), and week 6 (14.3 %) arrive from the North, at Soacha and Mosquera, respectively. Week 3 showed a slight influence of southeastern trajectories. Week 5 was the only week with a persistent influence of air masses arriving from the South/Southeast (69 % and 71.4 % of trajectories in cluster C2 at Soacha and Mosquera, respectively). It was during this week that a higher contribution of SOA was found at both sites; this may be due to the influence of emissions from rainforest vegetation.
In contrast, air masses from the Northwest (Magdalena Valley) were observed only in week 7. This was the week with the highest PM2.5 concentrations and the highest contribution of several sources, such as diesel combustion, wood combustion, and secondary inorganic aerosol compounds (sulfate and ammonium). Emission sources located along trajectories from the Northwest are few and weak when compared to those from the East (i.e. the city of Bogotá). This suggests that there was also poorer dispersion of local emissions associated with these Northwest trajectories and a contribution of transport of secondary inorganic aerosols from the Magdalena Valley.
The percentage of clusters per week was very similar for both sites, suggesting that both are influenced by similar air masses. However, the influence of Bogotá’s emissions or long-range transport of pollutants does not seem to have been dominant over the concentrations and compositions of PM2.5 of the sites during the sampling period. Therefore, the incremental excess in the concentrations of PM2.5 and its constituents, as well as in the source contribution to organic carbon and PM2.5, is mostly a consequence of local emissions.
4. Conclusions
This study apportioned OC and PM2.5 at two receptor sites, Soacha and Mosquera, located in Sabana Occidente in the greater Bogotá region, using molecular markers and the CMB receptor model, during 8 weeks between 15 September and 9 November 2014. To the best of our knowledge, this is the first study in Colombia that applies this approach of source apportionment to particulate matter. The model and the PM2.5 reconstruction derived from it were able to resolve the contributions of 6 sources to OC and PM2.5, namely: diesel and gasoline vehicles, natural gas and wood combustion, coal combustion at small facilities, and secondary organic aerosols. The main anthropogenic sources contributing to PM2.5 in Soacha were wood combustion (23%), diesel vehicles (19%), and coal combustion at small facilities (11%). The main contributors in Mosquera were gasoline vehicles (26%), diesel vehicles (19%), secondary organic aerosol (15%), and coal combustion at small inefficient facilities (15%). The contribution of regional secondary organic aerosol to PM2.5 was significant at both sites: 19% at Soacha and 15% at Mosquera, higher with southerly winds. Moreover, our results show that there was a regional contribution to secondary inorganic aerosols, higher when winds came from the Magdalena Valley.
The high contribution of wood combustion at Soacha, and coal combustion at both sites, show a different spectrum of sources in smaller towns when compared with the capital city. Wood is more frequently used at local bakeries and restaurants and may be used for cooking and heating at homes. Coal is used in ovens or kilns at small, inefficient industrial facilities. Stringent control of coal use in Bogotá has originated a migration of this kind of facility to neighboring towns, where emission controls are less rigorous.
Our results indicate that previous source apportionment results found in Bogotá would not generate the best set of measures to curb air pollution if applied in these neighboring towns. The regional environmental agency that has jurisdiction over them needs to strengthen their emission control strategies with different foci: promote improved wood stoves or ovens in commercial activities and homes; demand improved facilities for coal combustion or replace coal with natural gas at small industrial facilities; and, together with the National government, promote a faster upgrade of the vehicular fleet. Given the similarities among towns in the Sabana Occidente and Sabana Centro counties, in terms of climate, culture, level of development, and economic activities, these conclusions could be applied to the environmental management plans in the rest of the metropolitan area. However, specific source apportionment studies using organic molecular markers would be needed in towns with appreciably different features or sources, and other regions.
Supplementary material
Auxiliary information to aid the interpretation of this article is available at: https://www.revistascca.unam.mx/atm/SupplementaryMaterial/52986-Rojas-SupMat.pdf

