nueva página del texto (beta)
 Inglés (pdf)
 Artículo en XML
 Referencias del artículo
 Enviar artículo por email
 Citado por SciELO
  Similares en
SciELO
Similares en
SciELO 
 Permalink
1. Introduction
Urban centers concentrate population, resources, and a large variety of anthropogenic activities that result in poor air quality conditions. The World Health Organization (WHO) estimates that every year, more than six million premature deaths worldwide can be attributed to indoor and outdoor air pollution (WHO, 2018). In South America, the air quality problem is a growing concern as 80% of the population (i.e., 260 million people) lives in urban centers, demanding more energy, transport, and industrial development (Arsht, 2013). The main sources of air pollutants in urban zones are the anthropogenic emissions from the incomplete combustion of fossil fuels, road dust, and industrial activities (Teichmann, 2010). Additionally, biomass burning (BB) emissions originate from regional or local agricultural activities and wildfires. These emissions contribute to the increase of atmospheric gases such as volatile and semi-volatile organic compounds (VOCs), CO, NOx, CH2O, CH4, and SO2. Additionally, particulate matter (PM) also increases with important contributions of light-absorbing aerosol particles such as black carbon (BC), particle-bound polycyclic aromatic hydrocarbons (pPAHs), and organic carbon (OC), among others (Schultz et al., 2008; Andreae and Merlet, 2001; McDonald et al., 2018; Dignon, 1992; Aurell and Gullett, 2013; Jaffe and Wigder, 2012; Phuleria et al., 2005; Garcia-Hurtado et al., 2014; Kollanus et al., 2016). It has been reported that OC is an important by-product of BB, representing two-thirds of its mass (Duan et al., 2004; Cachier et al., 1995).
The impacts of BB on air quality has been evaluated in several South American countries such as Colombia (Mendez-Espinosa et al., 2019; Hernandez et al., 2019; Rincón-Riveros et al., 2020), Chile (Cuchiara et al., 2017; Rubio et al., 2015; Marín et al., 2017), Brazil (Oliveira et al., 2011; Urban et al., 2012; dos Santos et al., 2014), and Venezuela (Hamburger et al., 2013). These studies remark the degradation of air quality in urban centers due to the increased concentration of PM10, PM2.5, CO, and ozone during the BB season. It is also important to note that African dust is another important source of aerosol particles in northern South America (NSA), most frequently observed between February and August (Prospero et al., 2014; Kishcha et al., 2014; Ben-Ami et al., 2010). Dust outbreaks can increase PM10 by 27.5 μg m−3 in Cayenne (French Guiana) (Prospero et al., 2014), 50 μg m−3 in Medellín and Bogotá, Colombia (Méndez et al., 2018), and 26 μg m−3 in Balbina, Brazil (Formenti et al., 2001).
Long-range and regional transport of BB emissions constitutes one of the largest sources of transboundary pollution (Bergin et al., 2005; Adame et al., 2012; Castro Videla et al., 2013; Hamburger et al., 2013; Cottle et al., 2014; Donnelly et al.,2015; Kollanus et al., 2016). South America is the second-largest contributor of BB emissions in the world, after Africa, with 16% of the global emissions (Koch et al., 2007; Van Der Werf et al., 2010). In addition to air pollution degradation, BB has local, regional, and global climate effects such as changes in the land use, surface albedo, and the radiative budget, as well as the intensification of drought periods, and the modification of precipitation patterns, among others (Van Der Werf et al., 2010; Thornhill et al., 2018).
Most of the BB in the NSA region occurs in the Brazilian Amazon and the Venezuelan and the Colombian savannas (i.e., the Orinoco River basin, ORIB) (Dwyer et al., 2000; Armenteras-Pascual et al., 2011). The burned areas are a direct consequence of economic practices, such as change of land use for agriculture and human occupation (Pivello, 2011; Cordeiro et al., 2014). Every year, 1,355 tons of PM10 are emitted every month by BB in the ORIB, mostly during the dry season (Hernandez et al., 2019). These fires typically take place between December and May (Hamburger et al., 2013), with the highest fire activity observed between January and February for Colombia, and from January to May in Venezuela (Hernandez et al., 2019). Besides the BB activity during the dry season, the northeast trade winds intensify creating the so-called Orinoco low-level jet (OLLJ) (Torrealba and Amador, 2010; Jiménez-Sánchez et al., 2019), that can potentially transport emissions from Venezuela to Colombia as previously shown by Hernandez et al. (2019). This phenomenon occurs during boreal winter, i.e., December-April, as the InterTropical Convergence Zone (ITCZ) moves to its southernmost position while the North Atlantic subtropical high is closest to the Equator (Poveda et al., 2006; Jiménez-Sánchez et al., 2019). The ITCZ position determines the length of both the dry and the BB seasons (Pulwarty et al., 1998).
Recently, using off-line methods to determine the PM10 concentrations with a temporal resolution of 24 h, Hernandez et al. (2019) found that during the Venezuelan BB season, particles from the burned areas affect the air quality of two middle size cities in the Colombian ORIB (i.e., Yopal and Arauca) between April and May, 2015. The authors mentioned a possible connection between the transport of air pollutants and the OLLJ; however, they were unable to link it directly because their study was carried at the end of the OLLJ intensity peak and the beginning of the rainy season. Also, Mendez-Espinosa et al. (2019) found a direct link between high PM2.5 and PM10 concentrations in three Colombian Andean cities (i.e., Bucaramanga, Bogotá, and Medellín) and BB emissions originated in the ORIB, demonstrating the long-range transport of BB particles from Venezuela to Colombia.
In the present study, the influence of the long-range transport of BB emissions in the air quality of the largest city in the Colombian ORIB (i.e., Villavicencio) is evaluated for three consecutive years using online sensors. Additionally, the regional and the trans-boundary impact of the BB events from the ORIB region and the high importance of the OLLJ is assessed by combining model-integrated satellite data and back trajectory analysis.
2. Methods
2.1. Area of study
Air pollution levels in Villavicencio, Colombia were continuously monitored with two different air quality stations: La Esmeralda (LE) (4º9’41”N, 73º38’51”W) and Catumare (CA) (4º6’28”N, 73º39’19”W, 467 m a.s.l.). Villavicencio is a middle size city located in the Colombian savannas. The Colombian savannas have a low elevation (200-600 m a.s.l.) and an extension of ca. 250,000 km2 (Guhl, 2017). This vast region is surrounded by the Andes Mountains to the West, the Venezuelan savannas to the North, and the Guaviare River and the Amazon forest to the South (Goosen, 1971). Warm-humid climate predominates in the region with average annual temperature and relative humidity of 26 ºC and 60%, respectively (Blydenstein, 1967). Most of the annual precipitation (90%) falls during the rainy season (i.e., April to December) and contributes significantly to the mean annual accumulated precipitation of 1,500 mm (Goosen, 1971).
Villavicencio connects the Colombian savannas with the Colombian Andes as it is located in the piedmont of the Andes Mountains, 86 km away from Bogotá, the capital of Colombia, as shown in Figure 1. The city has 451,212 inhabitants (DANE, 2019) in 1,328 km2, being the most populated city of the Colombian savannas. It is the main collection and supply center of the region and the Capital of the main gas producer State in Colombia. The city transports 150,000 m3 of gas per day (Cámara de comercio de Villavicencio, 2013) and the Meta State produces 15,000 barrels of petroleum per day in three main extraction fields (Martinez and Delgado, 2018). Agriculture is another important activity of the surrounding (~20 km) small towns with rice, palm oil, and maize as the main products (Cámara de comercio de Villavicencio, 2013; Alcaldía de Villavicencio, 2016). Also, cattle raising is an important activity of the region that occupies more than 50% of the productive area (Cámara de comercio de Villavicencio, 2013).
Although there is no detailed emission inventory for Villavicencio, the main emission sources identified for the city include processing food industries, waste incineration, and fuel stations (Parrado, 2020). Additionally, the main mobile emission sources in the city are the private vehicles, mainly motorcycles (Ortíz and Ríos, 2019). The main pollutants identified in the Villavicencio include CO, VOCs, NOx and PM10. It is also important to note that coal is used in several industries as fuel, and therefore, it is responsible for most of the SOX emissions reported in the region (Parrado, 2020).
The annual mean precipitation of Villavicencio is 4,383 mm, with an average of 500 mm month−1 in the rainy season (i.e., April-November) and 100 mm month−1 in the dry season (i.e., December-March) (IDEAM, 2013). The average ambient temperature ranges between 23 ºC and 27 ºC, with maximum values of 34 ºC found during the dry season (IDEAM, 2013). The air quality monitoring in Villavicencio begun in October 2017 with the installation of three stations (LE, CA and Cofrem), funded and operated by Cormacarena, the regional environmental agency. Note that only two stations are used in the present study as the data reported by the Cofrem station is not continuous because the station suffered technical issues between November 2017 and March 2020.
2.2. In-situ air pollutants measurements
The hourly PM10 and O3 concentrations reported by the LE and CA stations were analyzed from November 2017 to March 2020. Both monitoring stations are located in urban spots, surrounded by houses and roads (Fig. 1). However, the LE station is close to the residual water treatment plant in the suburbs of the city and is expected to measure the background air quality of the city. Meanwhile, the CA station is located nearby the industrial zone of the city and 10 m away from a busy highway. Although both stations are located in the periphery of the city, they are able to capture the fresh and aged pollutants locally emitted along the day. Moreover, both stations may be sensitive to long-range transported air pollutants arriving to the city.
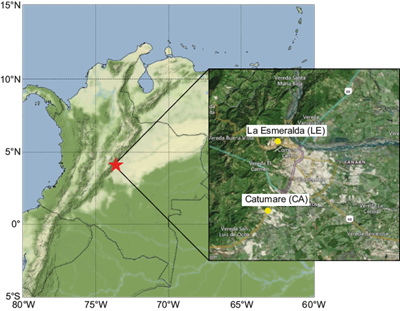
Fig. 1 Map showing the area of study including Villavicencio and the location of the two monitoring stations. The red star represents the location of Villavicencio and the yellow circles indicates the location of La Esmeralda (LE) and Catumare (CA) stations.
The PM10 and O3 analyzers used are the MP101M and O342M models from Environment S.A., respectively. The PM10 concentration is measured by the beta ray attenuation technique with continuous measurement at a flow rate of 1 m3 h−1 (Envea, 2020). Similarly, the operational principle of the O3 detector is based on the UV absorption technique (Envea, 2019). The raw data of both monitoring stations provided by Cocriteriarmacarena was filtered following the United States Environmental Protection Agency (USEPA, 2017) procedure to delete negative concentrations (<0 μg m−3). Also, the EPA filtering for PM10 and O3 data was followed. Abrupt changes in the pollution levels reported by the sampling sensors were detected from time to time after the instrument’s shutdown, and therefore, they are not considered in the analysis presented here. It is important to mention that O3 is only measured by the CA station. Also, after the data filtering, only the LE station has valid PM10 data that includes the dry and wet seasons for the analyzed years.
2.3. PM 10 composition
Model products from atmospheric reanalysis is an useful tool to study different variables of interest. The reanalysis products are four-dimensional fields of atmospheric variables that provide continuous spatio-temporal data, in contrast with the in-situ observations that could be sparse (Cohn, 1997; Kalnay, 2003; Schutgens et al., 2010; Rienecker et al., 2011). In this study, the NASA’s Global Modeling and Assimilation Office (GMAO) MERRA-2 (The Modern-Era Retrospective Analysis for Research and Applications, Version 2) reanalysis was used, as it is the first multi-decadal global reanalysis dataset that combines hyperspectral radiance, microwave data, GPS-Radio occultation data, ozone profile observations, and several other ground and satellite-based datasets, combining aerosol and meteorological variables with their interactions (Randles et al., 2017; Gelaro et al., 2017). The importance of MERRA-2 in this study is that it provides gridded output for aerosol diagnostics parameters not easily observed on a regional scale, with potential applications ranging from air quality forecasting to studies of aerosol-climate interactions (Bocquet et al., 2015; Gelaro et al., 2017).
We used aerosol species concentration from MERRA-2 to estimate monthly regional PM10 (spatial resolution of 0.5º x 0.625º) in Villavicencio from the M2I3NVAER database that comprises aerosol mixing ratios for 72 model-level fields on a hybrid-sigma coordinate (GMAO, 2015a). MERRA-2 simulates aerosol species’ concentration with the Goddard Chemistry Aerosol Radiation and Transport model (GOCART), which includes bias-corrected aerosol optical depth from NASA Moderate Resolution Imaging Spectroradiometer (MODIS), together with observations from MISR and AERONET (Chin et al., 2002; Provençal et al., 2017). GOCART treats the sources, sinks, and chemistry of 15 externally mixed aerosol mass mixing ratio tracers: dust (DS; five non-interacting size bins), sea salt (SS; five non-interacting size bins), hydrophobic and hydrophilic black and organic carbon (BC and OC, respectively; four tracers), and sulfate (SO4) (Randles et al., 2017; Buchard et al., 2017). Based on these species concentrations, it is possible to estimate particle total concentration with diameters below 2.5 µm and 10 µm (Chow et al., 2015). Based on GOCART species sizes, Provençal et al. (2017) proposes an estimate of PM10 by a combination of the tracer’s concentrations in μg m−3 given by
Equation 1 assumes that SO4, OC, and BC from GOCART are all in the form of PM2.5 (Buchard et al., 2016, Provençal et al. 2017). SO4 is multiplied by 1.375 since SO4 is assumed to be fully neutralized by ammonium (NH4) in the form of ammonium sulfate ((NH4)2SO4), and OC is multiplied by 1.8 to account for other organic compounds found in particulate organic matter (Provençal et al. 2017). The contributions from DS and SS are in the range higher than PM2.5 and lower than PM10, since MERRA-2 differentiates these components by particle size (Buchard et al., 2016; Randles et al., 2017; Provençal et al. 2017).
It is important to note that properties of aerosol species are not fully constrained by the observations and are principally determined by the underlying GOCART model (Gelaro et al., 2017). Notwithstanding this fact, MERRA-2 has shown considerable skill in simulating numerous observable aerosol properties worldwide (Buchard et al., 2017) and has been used to estimate PM10 and PM2.5 in Europe, the Middle East, and Asia (e.g, Provençal et al. 2017; Lasko et al. 2018; Song et al., 2018; Xiao et al., 2018; Mahesh et al., 2019; Ukhov et al., 2020; Navinya et al., 2020).
2.4. The Orinoco low-level jet
The annual cycle of the mean monthly horizontal winds between 1980 and 2020 was calculated using MERRA-2’s M2I3NPASM database (GMAO, 2015b), which gives horizontal winds at different pressure levels. This allows us to estimate the climatological wind patterns in the region and, in particular, the spatio-temporal structure of the OLLJ. To estimate the regional transport of aerosol particles and the influence of the OLLJ, we used the vertical profiles of aerosol mixing ratios from the M2I3NVAER together with horizontal winds (zonal and meridional winds) at each model-level from the M2I3NVASM database (GMAO, 2015c). From basic fluid dynamics, the horizontal flux of a quantity with a mixing ratio w i at an atmospheric layer of height Δp/g is given by wVΔp/g, where V is the horizontal wind vector at the atmospheric layer. Therefore, the vertically integrated horizontal flux of a certain quantity will be given by (Peixoto and Oort, 1992):
The horizontal low-level fluxes of OC, DS, and SS were calculated using Equation 2, where w i is the aerosol mixing ratio for each of the components: OC, DS, or SS. The integration is performed over the lowest part of the troposphere using 16 S-levels, i.e., approximately the layer between 1000 to 700 hPa in the regions of low topography.
To support the pollutants source analysis, back trajectories of the air masses arriving in Villavicencio (i.e., to the LE station, Fig. 1) were obtained with the hybrid single-particle lagrangian integrated trajectory (HYSPLIT) model of the National Oceanic and Atmospheric Administration (NOAA). This model uses meteorological data from different sources, such as the National Centers for Environmental Prediction-National Center for Atmospheric Research (NCEP-NCAR) reanalysis model (Stein et al., 2015). 72-hour back trajectories were retrieved for each day at 12:00 and 00:00 LT, between February and April 2018, 2019, and 2020 at 500 m a.g.l.
2.5. Biomass Burning activity
The Biomass Burning activity between 2018 and 2020 was assessed by the burned area inside the ORIB region. This was retrieved using the NASA Fire Information for Resource Management System (NASA FIRMS) through its online Fire Map (https://firms.modaps.eosdis.nasa.gov/). The FIRMS uses the MODIS global monthly fire location product MCD14ML that detects the burned area with 500 m MODIS surface reflectance imagery coupled with 1 km active fire observations from the Terra and Aqua satellites (Giglio et al., 2018). The final product includes the number of fires per month.
3. Results
3.1. Local air pollution sources
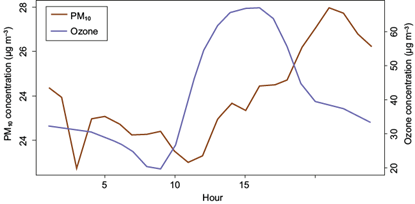
While the LE monitoring station captured the hourly variability of the PM10 concentration in Villavicencio, the CA monitoring station did the same for O3. The available data comprises three dry seasons (December-April) and two wet seasons (May-November), between 2017 and 2020. Figure S1 shows the diurnal cycle of the PM10 and O3 concentrations for the analyzed years, and includes the data of the dry and wet season. The daily average PM10 concentration was found to be 25 ± 4 μg m−3 with the highest average concentration (i.e., 28.0 μg m−3) observed at ca. 21:00 LT. These overnight high concentrations of PM10 are uncommon in most urban sites and could be related to emissions coming from the surroundings of Villavicencio. Alvarez-Ospina et al. (2021) found that the burning of solid waste can impact the air pollution levels overnight in Merida, Mexico. This deserves to be further studied to determine the source of the overnight PM10. The O3 daily profile showed a typical behavior for this pollutant with the highest average hourly concentration (i.e., 70.0 μg m−3) observed at 14:00 LT, which is the time of the day with the highest solar radiation.
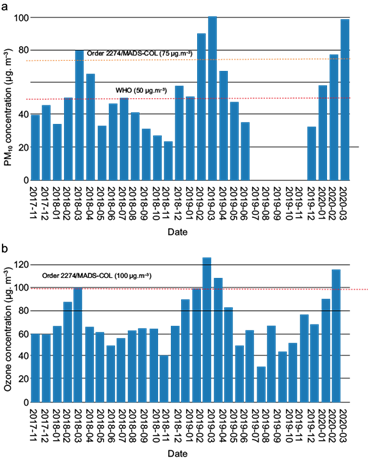
Figure 2(a) shows the time series of the monthly PM10 concentrations. A pronounced annual trend in the PM10 concentration was observed with higher concentrations observed between February and April (dry season) with a peak in the PM10 concentration found in March every year. The median PM10 concentration during the dry season is around 40 μg m−3, with maximum values of 250 μg m−3, observed in March 2020. The lack of PM10 data at the end of 2019 was due to technical reasons. Following the same trends observed for PM10, higher concentrations of O3 were found between December and April, with peak concentrations observed in March every year (Fig. 2b). It is important to note that O3 concentrations only take into account the daylight data (i.e., 06:00-18:00 LT).
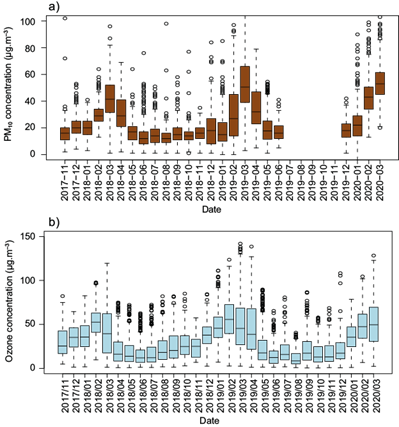
Fig. 2 Time series of the monthly distribution of the hourly concentration of a) PM10 for La Esmeralda station, and, b) O3 from the Catumare station, between November 2017 and March 2020. The top and bottom limits of each box are the 25th and 75th percentiles of the monthly concentrations, respectively. The monthly median concentration is represented by the horizontal line in the middle of each box. The top and bottom whiskers on each box indicate the maximum and minimum values, respectively. The open circles indicate outlier values.
The seasonal trends were evaluated to assess the impact of the dry season on the local air quality. As shown in Figure 3, the PM10 and O3 median concentrations are 18 and 21.4 μg m−3 higher in the dry season than in the wet season, respectively. Except for the dry season, the pollution levels along the year are below those indicated by the local and international air quality guidelines (Fig. S2). Therefore, this suggests that the high pollution episodes observed in Villavicencio during the dry season could be caused by external sources (see Section 3.2).
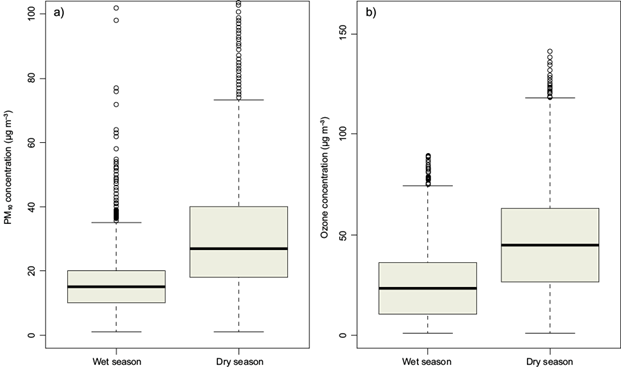
Fig. 3 Intercomparison of the mean hourly concentration of a) PM10 and b) O3 during the rainy and dry seasons for the entire sampling period. The whiskers represent the 5th and the 95th percentile of the PM10 and O3 concentrations.
In Villavicencio, 12 to 13% of the days (i.e., 18-19 days) of the dry season exceed the WHO recommendations for PM10 (i.e. 50.0 μg m−3) and O3 (i.e., 100.0 μg m−3) concentrations. In contrast, less than two days of the rainy season (<1%) exceeds the WHO allowable limits. The Colombian air quality standards set higher allowable limits than the WHO for PM10, i.e., 75.0 μg m−3 (Fig. S2). Therefore, throughout the year, less than 2% of the days exceed the Colombian normative (Fig. S2).
3.2. Regional air pollution sources
3.2.1. Biomass burning over the ORIB
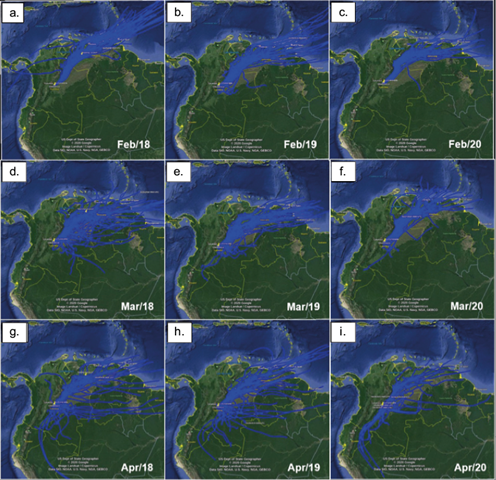
Every year during the dry season, hundreds of hectares are burned in the ORIB region. Figures 4(a), (b), and (c) show the location and the density of open fires in the Venezuelan and the Colombian savannas between February and April of 2018, 2019, and 2020, respectively. Figures 4(d) and (e) clearly show that between May and July, BB in the ORIB region is almost absent, in line with an increase in precipitation (Fig. S3). Although open fires were found in large densities in the ORIB region during the 2018 and 2019 dry seasons, in 2018 they were concentrated in the Colombian savannas and in 2019 in the Venezuelan savannas. Even though for 2020 the open fires information is only available for February, a trend similar to that found in the two previous years is observed.
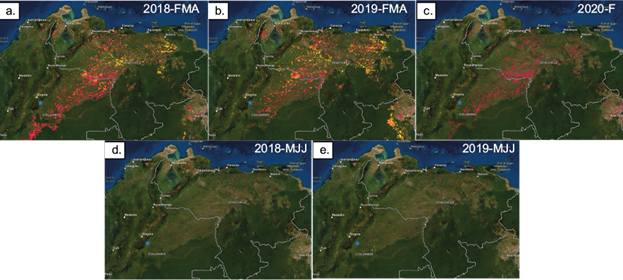
Fig. 4 Schematic representation of the fires in the ORIB region during the dry (a, b, and c) and rainy seasons (d and e) between 2018 and 2020. The red, orange, and yellow dots correspond to the fires found in February, March, and April, respectively. The green star represents the location of Villavicencio. FMA and MJJ refers to February-March-April and May-June-July, respectively. Retrieved using the NASA Fire Information for Resource Management System (NASA FIRMS).
3.2.2. The OLLJ and the transport of BB pollutants
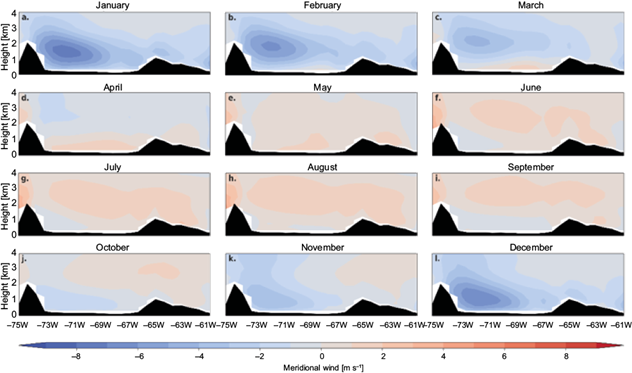
Figure 5 shows the annual cycle of mean monthly winds in the layer between 950-800 hPa for the period 1980-2019 estimated from MERRA-2. This figure corresponds to a climatology of the low-level wind patterns in the ORIB region. A particular feature in this climatology is the presence of a low-level jet of northeasterly winds coming from the Atlantic Ocean towards the interior of Colombia, also known as the OLLJ (Montoya et al., 2001; Torrealba and Amador, 2010; Jiménez-Sánchez et al., 2019). As shown in Figure 5, the OLLJ is active between November and March with its highest peak activity found in January with wind speeds higher than 8 m s−1, and crossing the entire Colombian ORIB region. Figure S4 shows a vertical cross-section at 4ºN from 75ºW to 61ºW showing the jet structure that is highly concentrated to the east of the Andes mountain range, in the lowest 4 km, and with a jet center about 1-2 km a.g.l.
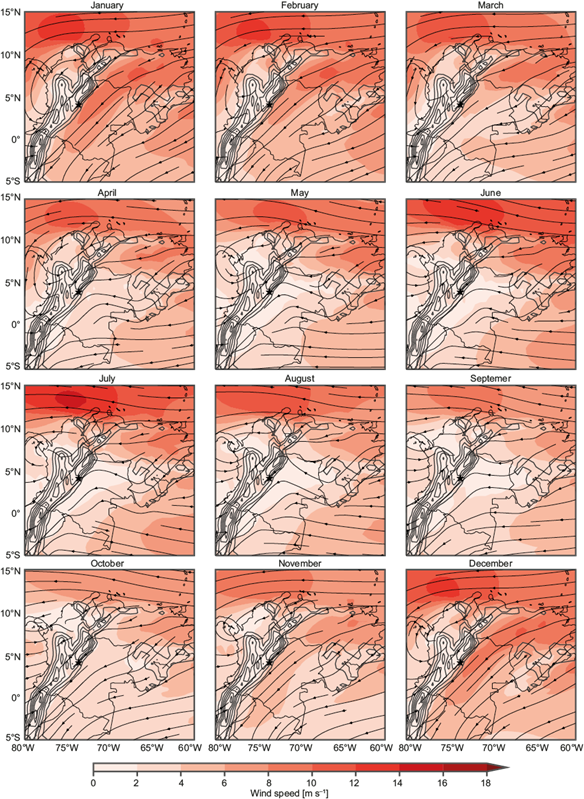
Fig. 5 Annual cycle of mean monthly winds in the layer between 950-800 hPa for the period 1980-2019. The lines correspond to streamlines pointing as the wind direction, and color contours correspond to wind speed. The topography is shown for reference as closed contours. Data from MERRA-2.
We retrieved HYSPLIT back-trajectories at 500 m a.g.l for February-April 2018, 2019, and 2020 as shown in Figure S5. The trajectories show paths consistent with the wind climatology shown in Figure 5, where the prevailing northeasterly winds are due to the presence of the OLLJ. For the three years, air masses consistently arrived at Villavicencio in February from the Atlantic Ocean, crossing the entire ORIB region. The March and April back-trajectories show a weakening of the OLLJ, where the winds have a pronounced easterly origin. However, some April’s back-trajectories show a southerly origin, showing an increasing contribution from the Amazon to the region as the ITCZ moves north.
Figures 4 and 5 show an overlap between the OLLJ and the BB activity during the period February-March in the Venezuelan and the Colombian savannas. These figures suggest that the OLLJ can transport BB air pollutants deep into the ORIB region. Additionally, Figure 5 suggests that OLLJ can transport other aerosol particles into the ORIB region, such as marine aerosol and African dust that can affect the air quality in this region. Figure 6 shows the average OC low-level flux given by Equation 2 during the BB season (i.e., February-April) compared with the beginning of the rainy season (i.e., May-July) of 2018 and 2019. Figure 6(a) shows that OC flux is higher than 0.15 g m−1 s−1 along the ORIB region, even reaching the Northeast of Ecuador. Also, Figure 6(b) shows a similar behavior for the 2019 BB season. However, the OC flux is mostly concentrated in the ORIB region with a flow rate higher than 0.25 g m−1 s−1. From Figures 6(c) and (d), it is evident that at the beginning of the rainy season, in both years, the transport of OC is absent.
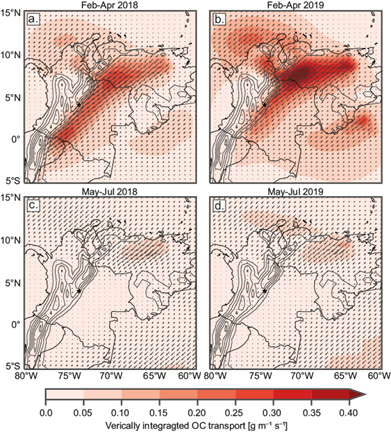
Fig. 6 Map of the northern South America region. Mean OC low-level flux for the period a) February-April 2018, b) February-April 2019, c) May-July 2018, and d) May-July 2019.
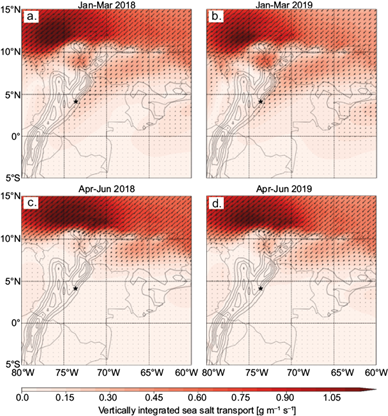
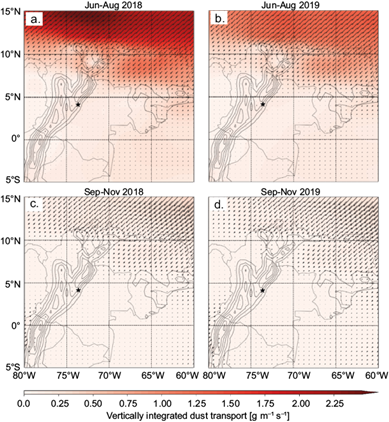
Similar to the OC flux by the OLLJ, fluxes of SS particles from the Atlantic Ocean into the ORIB region were observed (Fig. S6). This SS flux into the ORIB region is intense for the period January-March of 2018 and 2019 but not for the period April-June, suggesting the potentiality of SS transport into the region by the OLLJ. A DS flux into the ORIB region for the period June-August 2018 and 2019 was also observed, which is the period of high levels of African dust that reach the Caribbean and the NSA (Ben-Ami et al., 2010; Prospero et al., 2014; Kishcha et al., 2014), compared with the period September-November 2018 and 2019 (Fig. S7). Figure S7 shows that the trade winds can introduce DS into the continent; however, this intrusion is spatially restricted mostly to the NSA region because the OLLJ is not active during this time of year.
3.2.3. PM 10 composition
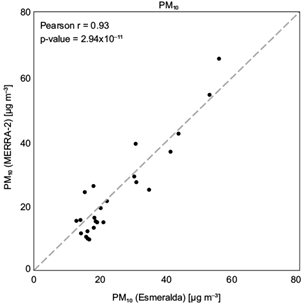
In Section 3.2.2 the regional transport of aerosol across the ORIB region was shown, as seen by the estimated low-level aerosol flux with MERRA-2. We evaluated the PM10 composition using Equation 1, to observe the impacts of this transport to the air quality in Villavicencio at the LE station. As we previously mentioned, the aerosol species’ concentration properties are principally determined by the underlying GOCART model used by MERRA-2. Therefore we must be cautious with the conclusions from MERRA-2’s PM10 estimates. To evaluate how PM10 from MERRA compares with in-situ measurements at the monthly level, we show in Figure 7(a) a comparison of the estimated PM10 with the ground-based observations. There is a high agreement between MERRA’s estimates and observations. This agreement is clear from the scatter plot of the monthly MERRA-2’s PM10 vs. ground-based observations in Figure 8, indicating that the monthly PM10 variability was captured adequately by the MERRA-2 reanalysis. This agreement supports the idea that the GOCART component of MERRA is reproducing the PM variability in the region. However, our conclusions should be validated by future field campaigns in the region.
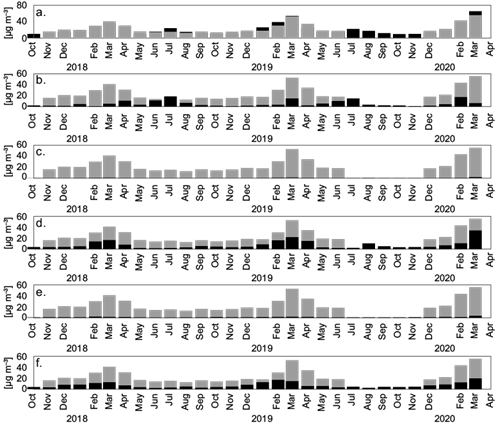
Fig. 7 Time series of the average monthly PM10 at the LE station (grey) compared with a) PM10 estimated from MERRA-2 (black) and with the different components of the Eq. 1 (also in black): b) DS, c) BC, d) OC, e) SO4, and f) SS.
Figures 7(b), (c), (d), (e) and (f) show the time series of the contribution of each of the aerosol mixing ratios to PM10 as given by Equation 1, against the measured PM10 concentration. It is evident that BC and SO4 are in very low concentrations (i.e., < 10 μg m−3) and do not contribute significantly to the PM10 concentration (Figs. 7[c] and 7[e]), suggesting that the air pollution observed in Villavicencio is unlikely to be originated by local sources.
In contrast to BC and SO4, the DS, OC, and SS concentrations were found to be important contributors to the PM10 in Villavicencio. While DS was found to report high concentrations around April and during the July-August period with the highest mixing ratio of 65.0 μg m−3 found in July 2018 (Fig. 7[b]); the SS and OC were found in higher concentrations during the dry season (i.e., December-April) with concentrations higher than 20 μg m−3. As shown in Figure 7(d), the estimated OC mixing ratio nicely follows the measured PM10 concentrations trend in all three dry seasons.
4. Discussion
The continuous monitoring of PM10 and O3 in Villavicencio was useful to evaluate air quality in this city and to corroborate that every year during the dry season air quality deteriorates coinciding with the BB season and the OLLJ activity. It is important to note that this is the first, continuous, and high temporal resolution monitoring system implemented in the Colombian savannas that covers four states and a total extension of 250,000 km2. The good air quality that the city experiences most of the year (i.e., average annual PM10 concentration of 15 μg m−3 and O3 concentration of 21 μg m−3 for the entire sampling period) can be explained by the relative low road traffic, the scarce industrial development, the relatively low population (ca. 500,000 inhabitants), and the flat terrain. The PM10 and O3 concentrations in two similar cities in the ORIB region, i.e., Yopal and Arauca, during the rainy season (considered as the baseline) were found to be three times higher than in Villavicencio (Hernandez et al., 2019). This difference could be explained in part by the higher precipitation rate reported in Villavicencio during the rainy season (i.e., a monthly average of 380 mm [IDEAM, 2013]) compared to the other two cities for the same period. While Arauca reports monthly average precipitation of 198 mm (IDEAM, 2000), the average precipitation rate for Yopal is 287 mm per month (IDEAM, 2012).
Opposite to the rainy season, the PM10 concentrations found in April in Villavicencio (i.e., close or above 50 μg m−3) were found to be comparable with the concentrations reported in Yopal and Arauca (i.e., 53 μg m−3 on average) for the same period (Hernandez et al., 2019). In all three cities, PM10 peak concentrations close to 100 μg m−3 were occasionally observed in April. The similarities in the PM10 levels of Villavicencio, Arauca, and Yopal during the dry season are indicative that there is an external source of air pollution that affects the cities located along the ORIB region.
The PM10 composition of Villavicencio assessed through the MERRA-2 reanalysis products was useful to understand the role of the local vs. the external air pollution sources. The relatively low concentrations of SO4 and BC (i.e., less than10 μg m−3) found between 2017 and 2020 are indicative that local sources are not the main contributors to the PM10 levels measured at the LE monitoring station, mainly in the dry season. As shown by several studies, SO4 and BC emissions are highly related to urban pollution, industrial activities, and road traffic emissions (Subramanian et al., 2010; Invernizzi et al., 2011; Srimuruganandam and Shiva Nagendra, 2011; Xu et al., 2012; Yin et al., 2012; Pereira et al., 2012; Lee and Hieu, 2013; Han et al., 2014; Targino et al., 2016).
In contrast to the rainy season, high concentrations of PM10 and O3 were found during the dry season, specifically between February and April. Figure 4 shows a large number of open fires in the ORIB region between February and April, in contrast to the rainy season (May-July) when open fires are mostly absent. The BB season fires from the Venezuelan and the Colombian savannas can negatively impact the air quality of different Colombian towns as shown before (Hernandez et al., 2019; Mendez-Espinosa et al., 2019). The climatology of the low-level wind patterns in the ORIB region clearly shows that the OLLJ is active between November and March (Fig. 5). Also, Figure 6 shows that there is an effective OC flux along the ORIB region during the BB season. The high OC concentrations found between February and April are related to BB particles transported across the ORIB region when the OLLJ intensifies (Figs. 5 and 6). Figure 7 shows a good relationship between the PM10 and the OC concentrations, indicating that the seasonal pollution levels observed in Villavicencio could be driven by the BB season in the ORIB region. Previous studies found that more than half of the particle mass of the BB emissions is classified as OC (Reid et al., 2005).
In summary, as shown in Figures 4, 5, and 6, the high pollution levels found in Villavicencio are likely related to the BB emissions from the Venezuelan and the Colombian savannas transported across the ORIB region by the OLLJ. Although the OLLJ was previously identified and studied through numerical modeling (Jiménez-Sánchez et al., 2019), ground base data (Torrealba and Amador, 2010), and reanalysis (Montoya et al., 2001), this is the first time that its climatological behavior and its impact in the transport of air pollutants is analyzed. As shown in Figures S6 and S7, besides OC, the OLLJ can transport biogenic aerosol particles such as African dust and SS from the Atlantic Ocean to Venezuela and the central-southern part of Colombia. Mineral dust can be transported by the trade winds coming from the African deserts towards the Caribbean and the NSA (Formenti et al., 2001; Prospero et al., 2014; Kishcha et al., 2014; Méndez et al., 2018). Those particles also have the potential to affect the air quality in Villavicencio and likely in the entire ORIB region (Fig. 7). The HYSPLIT back trajectories support the likelihood of effective transport of pollutants by the OLLJ from the Atlantic Ocean, and the Venezuela and the Colombian savannas towards Villavicencio and other cities along with the Andes mountains range.
5. Conclusions
Although Villavicencio is a medium-size town with no large-scale industrial activities, the local air quality was found to be poor during the dry season (i.e., February to April) with PM10 levels (i.e., 100 μg m−3) above the national and WHO guidelines, i.e., 75 μg m−3 and 50 μg m−3, respectively. Given that the likely source of the high PM10 levels found in Villavicencio is the BB events that occur in the Venezuelan and the Colombian savannas, the situation can be even worse if PM2.5 is monitored as they have a higher residence time.
The present results suggest that African dust and SS particles can potentially impact both the local and the regional air quality of the medium-sized towns located along the ORIB. The transport of the air pollutants generated by BB in the Colombian/Venezuelan savannas, together with SS particles and African dust towards these towns, is favored by the presence of the OLLJ. Besides the risk that the OLLJ represents for aviation safety in the ORIB region (Jiménez-Sánchez et al., 2019), the present study provides clear evidence that the OLLJ is a key driver in determining the air quality across the ORIB region. Also, our study suggests that in some cases, the OLLJ can transport air pollutants from the Atlantic Ocean, Venezuela, and Colombia to Ecuador. This needs to be confirmed by ground-based observations either in the southwest of Colombia or Northern Ecuador.
As shown in previous studies, BB emissions does not only have the potential to affect people living in populated towns, as they can also affect the flora and fauna of natural protected areas (e.g., Trujano Jiménez et al., 2021). Therefore, based on the results from the present study, several natural protected areas from Colombia such as Serrania de la Macarena, Parque Nacional Cueva de los Guachos, Parque Nacional Natural La Paya, and the Northern Amazon can be in danger by the combination of the BB emissions from the Venezuelan/Colombian savannas and the OLLJ.
There is an urgent need to improve the current understanding of the local and regional impacts of the long-range transport of BB emissions from Venezuela to Colombia to coordinate international collaborations to mitigate this problem. Therefore, the implementation of real-time air quality sensors in the Arauca, Yopal, Meta, and Putumayo states are recommended. The delivered data will be useful for policy makers to develop different programs to reduce fires density, and hence, the air pollution levels along the ORIB region.
Data availability
Data is available in SISAIRE-IDEAM web page http://sisaire.ideam.gov.co/ideam-sisaire-web/ and it is updated every six months IDEAM (2019).