


 nueva página del texto (beta)
 Inglés (pdf)
 Artículo en XML
 Referencias del artículo
 Enviar artículo por email
 Citado por SciELO
  Similares en
SciELO
Similares en
SciELO 
 Permalink
1. Introduction
During the second half of January 2020, thunderstorms, intense rainfall, and flooding were recorded in several areas of the Atacama Desert, damaging infrastructure, isolating populations, and leading to economic loss (ONEMI, 2020). The total rainfall accumulated in less than seven days was ~ 116 mm (Fig. 1a), including a large amount of precipitation in the climatologically dry pampas and along the coast. These rainfall amounts are striking for one of the driest deserts of the world (Rutllant et al., 2003; Garreaud et al., 2010; Rondanelli et al.; 2015). Total annual rainfall is less of 5 mm/year in coastal cities, while less than 0.05 mm/year are recorded in places in the middle of the desert (Middleton, 2003; Bozkurt et al., 2016). The hyperaridity of Atacama is related to a combination of oceanic and atmospheric conditions. The desert is located on the eastern edge of the Subtropical Southeast Pacific Anticyclone (Rodwell and Hoskins, 2001) that enhances stable and dry conditions in the area. The subtropical anticyclone also induces southern winds along the Peruvian-Chilean coast, transporting cold waters from higher latitudes toward the equator as well as forcing the cold upwelling of deep waters. Cold conditions in the marine boundary layer (MBL) contrast with warm and dry subsidence above it due to the anticyclone regime, producing stable and dry air masses that dominate the climate in the Atacama Desert.
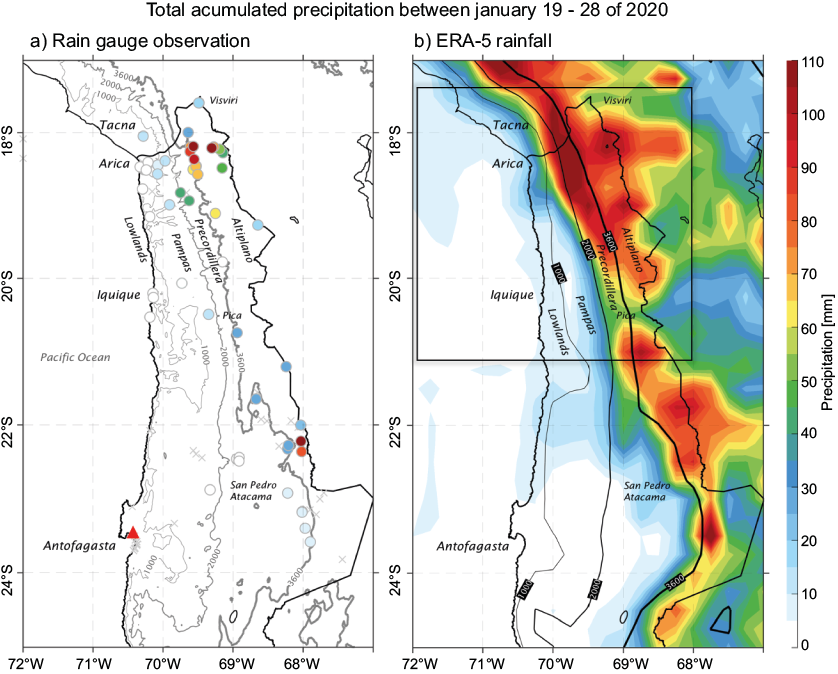
Fig. 1 Total accumulated precipitation (mm) between 19 and 28 January 2020. a) From surface rain gauge observations and height terrain elevation from ETOPO1. The X symbol indicates no precipitation and the red triangle indicates the Antofagasta weather station. b) Estimated total precipitation from ERA-5. In both panels gray/black contours indicate the different geographical areas: from 0 and 1,000 m (coast/lowlands), 1,000 to 2,000 m (pampas), 2,000 to 3,600 m (precordillera) and > 3,600 m (Altiplano). Black box in the right panel corresponds to the area where precipitation data was extracted and presented in Figure 5.
The Andes cordillera blocks most of the easterly winds advecting moist air from the Amazonas, conditioning mostly a warm-dry environment above the Atacama. Nevertheless, summer precipitation is observed over the high Andes (known as Altiplano, > 3600 m.a.s.l., Fig. 2a), with annual accumulation exceeding ~90 mm (Fig. 2a; Vuille and Keimig, 2004; Garreaud et al., 2010). Summer convection over the Altiplano basin, enhancing subsidence over the desert during the afternoon (Rutllant et al., 2003). This subsidence is also linked to an intense thermal inversion, which leads to very dry conditions ~1 km above sea level, contrasting with the well-mixed MBL off-shore.
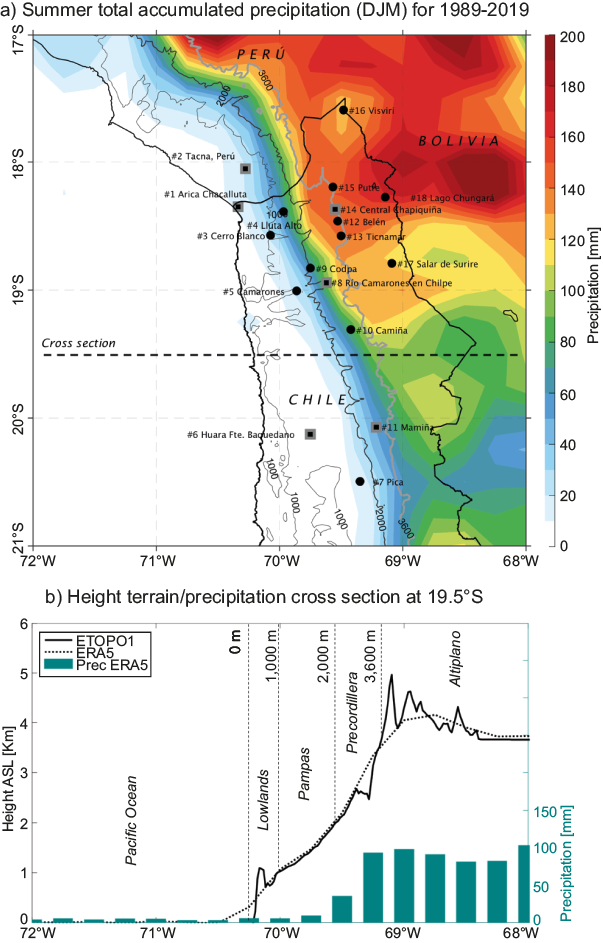
Fig. 2 a) Summer precipitation climatology (DJM), for the period 1989 to 2019 from ERA-5. Black circles indicate the location of weather stations listed in Table 1. Gray square indicates the location of weather stations listed in Table 2. Gray/black contours indicate the different geographical areas: from 0 and 1,000 m (lowlands), 1,000 to 2,000 m (pampas), 2,000 to 3,600 m (precordillera) and > 3,600 m (Altiplano). b) Vertical cross-section at 19.5ºS of height terrain elevation from ETOPO1 (black line), ERA5 (black dashed line) and total summer precipitation (green bars). [Data provided by Manuel Olivares, meteorologist from Research Office at the Chilean Weather Service].
The Atacama Desert hyperaridity is abruptly altered every few years by extreme precipitation events. Such events are associated with at least three distinct patterns: cold fronts, cut-off lows, and the summer monsoon. During austral winter, extended troughs associated with surface cold fronts can reach as far as north as Antofagasta (23ºS), resulting in heavy rainfall in the Lowlands and coastal cities, often leading to mudslides and flows of debris (Vargas et al., 2000). In late summer, autumn and spring, cut-off lows can also produce EP events. In March 2015 a cut-off low displaced equatorward (Barrett et al., 2016; Rondanelli et al., 2019) triggered large accumulated rainfall in less of 72 hrs between Antofagasta and Atacama Regions (22-25ºS), producing catastrophic flows that destroyed several cities (Sepúlveda et al., 2014). This event killed 50 people and produced damages for $2.6 billion dollars (Kreft et al., 2016). The almost unseen level of destruction in northern Chile stimulated meteorologists and scientists to study the mechanisms leading to major precipitation in the area. Thus, several studies (Barrett et al., 2016; Bozkurt et al., 2016; Jordan et al., 2019) identified the two main factors present during the March 2015 event: anomalously warm sea surface temperature off-shore the Atacama Desert and advection of anomalous precipitable water from the eastern tropical Pacific toward northern Chile.
Episodes of EP can occur over the Altiplano during austral summers linked with a synoptic feature known as the Bolivian High (BH; Lenters and Cook, 1999; Garreaud 1999) and monsoonal winds (Houston and Hartley, 2003). When the BH becomes stronger and is displaced poleward, the Altiplano region experiences moist conditions, favored by the moist easterly flow from the Bolivian/Amazonian jungle. The combined mechanism of local instability, moist boundary layer and forced ascent enhances thunderstorm activity and precipitation during the afternoon (Aceituno and Montecinos, 1993; Aceituno, 1998; Garreau, 1999; Garreaud, 2000; Garreaud et al., 2003; Vuille et al., 2003; Falvey and Garreaud, 2005).
Between 2017 and 2020, at least four episodes of intense rainfall occurred in the Atacama Desert during January and February that resemble the January 2020 event (DMC, 2017; DMC, 2019). The monsoon mechanism in the Altiplano could be a possible explanation for these EP events in Lowlands and Pampas of the Atacama Desert. According to Reyers et al. (2021), strong easterly winds above Atacama can lead to the displacement of convective storms from the Altiplano toward the coast. However, it must be considered the effect of above-normal sea surface temperature (SST) and anomalous precipitable water vapor along the Peruvian-Chilean coast, identified as key components in other previous events in the Atacama Desert, suggesting a thermodynamic potential connection with EP events in areas below 3600 m.a.s.l. Topography and forced ascent can also play an important role, since as Figure 2b shows, there is an abrupt increase in height from west to east due to the presence of Andes cordillera, from sea level to 4000 m in less of 1.5º of longitude (~300 km). Therefore, several questions arise about the source of humidity and instability triggering EP events in the Atacama Desert, and also about the local and synoptic mechanisms leading to summer precipitation in one of the driest deserts of the world.
Given these considerations, the purpose of this work is to analyze an EP event that occurred in late January 2020 to determine the processes that lead to major rainfall in the Atacama Desert in a synoptic, local and historical context. Data and methodology are described in section 2. Results of analysis in section 3. Section 4 discusses the main characteristics of this event and present the conclusions.
2. Data and methods
2.1 Surface-based and sounding observations
Daily total precipitation from 18 rain gauges (Table I) were obtained from Dirección General de Agua (DGA, 2020), Instituto Nacional de Investigaciones Agropecuarias (INIA, 2020), and Dirección Meteorológica de Chile (DMC, 2020). Additionally, total accumulated precipitation from 30 weather stations from Explorador Climático of the Centro del Clima y la Resiliencia (CR2, 2020)
Table I Location of weather stations as a function of elevation and institution owner. For locations in map, see Figure 2.
| # | Weather Station | Lat (º) | Lon (º) | Height ASL (m) | Geographic Area | Institution |
| 1 | Arica Chacalluta | -18,35 | -70,34 | 63 | Lowlands | DMC |
| 2 | Tacna, Peru | -18,05 | -70,23 | 469 | Lowlands | GHCN |
| 3 | Cerro Blanco | -18,58 | -70,07 | 525 | Lowlands | INIA |
| 4 | Lluta Alto | -18,39 | -69,96 | 895 | Lowlands | INIA |
| 5 | Camarones | -19,01 | -69,86 | 1090 | Pampas | INIA |
| 6 | Huara Fuerte Baquedano | -20,13 | -69,75 | 1100 | Pampas | DGA |
| 7 | Pica | -20,50 | -69,34 | 1325 | Pampas | INIA |
| 8 | Río Camarones en Chilpe | -18,94 | -69,62 | 1565 | Pampas | DGA |
| 9 | Codpa | -18,83 | -69,75 | 1870 | Pampas | INIA |
| 10 | Camiña | -19,31 | -69,42 | 2500 | Precordillera | DGA |
| 11 | Mamiña | -20,08 | -69,21 | 2730 | Precordillera | DGA |
| 12 | Belén | -18,47 | -69,52 | 3208 | Precordillera | INIA |
| 13 | Ticnamar | -18,58 | -69,50 | 3220 | Precordillera | INIA |
| 14 | Central Chapiquiña | -18,37 | -69,55 | 3350 | Precordillera | DGA |
| 15 | Putre | -18,20 | -69,56 | 3560 | Precordillera | DGA |
| 16 | Visviri | -17,60 | -69,48 | 4084 | Altiplano | DMC |
| 17 | Salar de Surire | -18,79 | -69,08 | 4269 | Altiplano | INIA |
| 18 | Lago Chungará | -18,28 | -69,14 | 4570 | Altiplano | INIA |
Daily data of sea level pressure at Antofagasta (23.5ºS, 70.5ºW) were computed averaging 0, 6, 12, and 18 UTC, obtained from DMC (2020).
Daily data of precipitable water vapor at Antofagasta were derived from soundings at 12 UTC of each day, available from the Atmospheric Sounding project at the University of Wyoming.
Hourly data of 2 m temperature, mixing ratio, zonal wind and precipitation were obtained from the DMC weather station Putre (located less than 1 km from Putre station listed in Table I) and Visviri (listed in Table I).
2.2. Reanalysis
Daily averages of 200 and 850 hPa geopotential height and wind fields at 1000, 850 and 700 hPa were obtained from ERA-5 (Hersbach et al., 2018). Daily precipitation fields were obtained from ERA-5 adding up hourly data for every grid point. Although ERA-5 is one of the newest reanalyses and its own ability to reproduce rainfall correctly should be assessed, a recent study suggests improvements compared to ERA-Interim (Nogueira, 2020) not only worldwide but specifically over the Andes Cordillera. This could help to complement surface-based weather stations information, that are mostly concentrated in the coast and northern part of the territory. In addition, daily and hourly precipitable water vapor (PWV) data were obtained from ERA-5 and from NCEP-NCAR Reanalysis (NNR1, Kalnay et al., 1996). Daily integrated vapor transport (IVT) was computed using the vertical integral of the product of specific humidity (q) and wind vector between in the layer of 900-800 hPa, following the work of Böhm et al. (2018).
Daily sea surface temperature (SST) fields from the NOAA Extended Reconstructed Sea Surface Temperature Version 5 (NOAA ERSST V5) were obtained from the CDC-NOAA.
2.3. Trajectory analysis
The Hybrid Single-Particle Lagrangian Integrated Trajectory model (HYSPLIT), developed by the Air Resources Laboratory at NOAA (Stein et al., 2015) is used to compute nine backward trajectories based on the GFS model at 0.25º x 0.25º horizontal resolution. Each modeled trajectory from 21 January at 20 UTC to 22 January at 20 UTC ends at 0, 1000 and 1500 m.a.g.l., above the locations of Arica, Mamiña and Putre. The model is freely available from NOAA.
2.4. Climatological context
In order to provide context for the anomalies observed in January 2020, daily climatological averages of all fields were computed for the (2008-2019) period, and then filtered with a 30-day smoothing average to reduce noise. Similarly, daily values of the 10th and 90th percentiles were computed.
2.5. Topography and main geographical areas
Topography data from Global Relief ETOPO1 (Amante and Eakins, 2009) which corresponds to a 1 arc-minute global relief model of Earth’s surface that integrates land topography and ocean bathymetry, was used.
This study identifies four main geographical features in Southern Peru and northern Chile. Areas near the coast below 1000 m.a.s.l. correspond to the Lowlands where main cities (e.g. Tacna in Peru and Arica, Iquique, and Antofagasta in northern Chile) are located, totaling ~1 million inhabitants. At elevations between 1000 and 2000 m.a.s.l. the geographical area is called Pampas, while between 2000 and 3600 m.a.s.l., it is called Precordillera and above 3600 m.a.s.l. it is called Altiplano. This classification is based on the routine weather forecast and warning system of the Chilean Weather Service. Figure 2a and b show the horizontal distribution and a vertical cross-section of these main geographical regions. Note that in less than 1.5º of longitude, the elevation changes from sea level to 4000 m in the Altiplano.
3. Results
3.1. Extreme precipitation event: January 2020
3.1.1 Observed rainfall
During the second half of January 2020, convection, thunderstorms and precipitation were recorded in most of northern Chile, concentrated between 19 and 28 January. Total accumulation during this period from surface-based weather stations ranged between 0-110 mm (Figure 1a). However, precipitation varied widely between different areas of the Atacama Desert. Lowlands and coastal areas (< 1000 m.a.s.l.; see light gray solid line in Fig. 1a) recorded less of 10 mm, while in the Pampas (1000 to 2000 m.a.s.l.) total accumulation ranged between 10-50 mm, and the largest amount observed between Precordillera (2000 a 3600 m.a.s.l.) and Altiplano (> 3600 m.a.s.l.) up to 110 mm. Most of the rain occurred during the afternoon-night, from stratiform and convective clouds, with hourly intensities up to 11 mm/hr.
Analysis from surface weather stations helped to determine special features of this rainfall episode. For example, a “dry period” was observed between 9 and 18 January, with almost no rainfall in the Lowlands and Pampas. A “wet period” was observed after 19 January in weather stations located below 2000 m.a.s.l., recording almost-daily rain between 21 and 26 January. The maximum daily rainfall intensity was recorded on 22 January in Río Camarones en Chilpe (red line in Fig. 3a) with 18 mm/day and on 25 January in Codpa (dark red in Fig. 3a) with 14 mm/day. On 22 January, precipitation was recorded in main cities located on the coast, between 3.8 and 1.0 mm in Arica (dark blue lines in Fig. 3a) and Iquique (20.3°S, not shown), respectively. Precipitation also increased in the Precordillera (green lines in Fig. 3b) on 19 January, reaching maximum intensity on 21 January at Mamiña with ~39.9 mm/day, and 25 mm/day in Central Chapiquiña and Ticnamar (green lines in Fig. 3b). Putre recorded the highest accumulation among all weather stations on 22 January with 43.5 mm. The “wet period” ended on 28 January in the Precordillera, Pampas and Lowlands. In contrast, the precipitation regime was similar before and after 19 January in the Altiplano (red lines in Fig. 3b), with maximum daily intensity less than 17 mm/day.
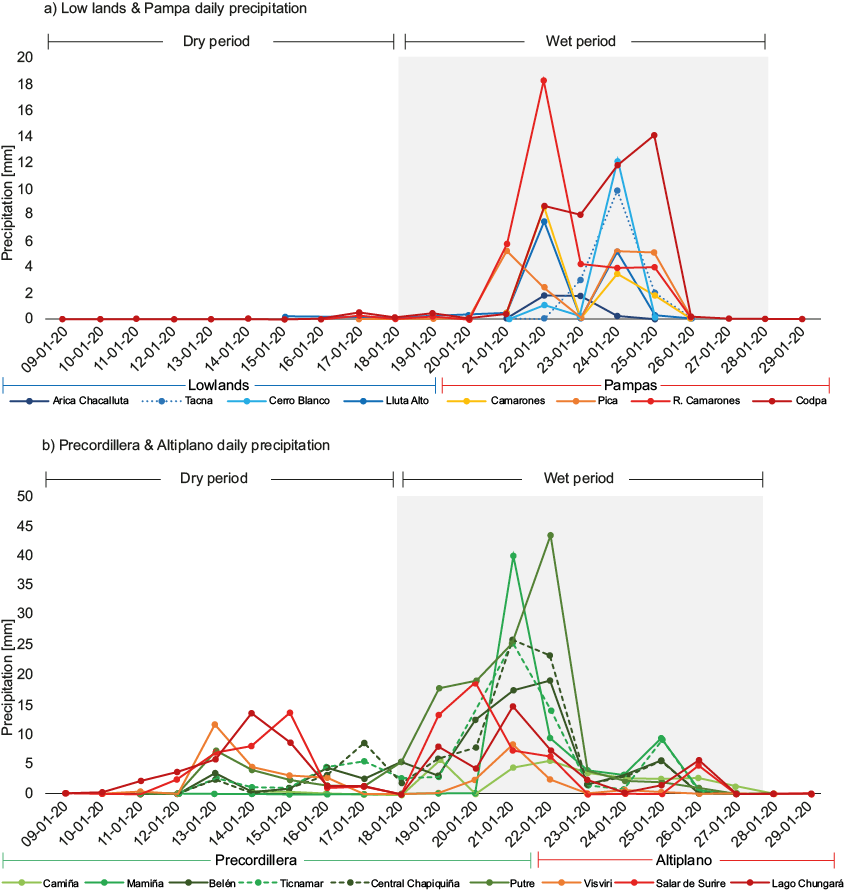
Fig. 3 Daily total accumulated rainfall in 17 weather stations (see Table I) in mm between 9 and 29 January 2020, separated in groups according to the geographic feature in Table I. a) weather stations located in Lowlands (<1000 m.s.n.m., blue lines) and Pampas (1000 to 2000 m.s.n.m., red lines). b) weather stations located in Precordillera (2000 to 3600 m.s.n.m., green lines) and Altiplano (>3600 m.s.n.m. red lines). Note the different scales in the y-axis between panels a) and b). Weather station Huara en Fuerte Baquedano (#6 in Table I) is not included.
Although the western Altiplano is a semiarid region (~200 mm/year that mostly falls during the summer rainy season as seen in Fig. 2a), the Lowlands and Pampas are very dry and precipitation events are extremely infrequent.
The frequency distribution of daily precipitation from high-quality data of the last decades, allows the determination of a threshold for extreme precipitation (hereafter, EP) corresponding to the 90th percentile of daily precipitation (Table II). Note that six of the seven weather stations recorded a day with EP during the second half of January 2020 and at least two weather stations recorded the strongest daily intensities. Tacna weather station (469 m.a.s.l., letter A in Table II), located in the Lowlands, recorded 9.9 mm on 25 January, corresponding to the fifth strongest precipitation in 48 years of data (Fig. 4a). Río Camarones en Chilpe in the Pampas, recorded the highest daily value in sixteen years of data with 18.3 mm/day (Fig. 4b). Another record-breaking precipitation occurred in Mamiña (2730 m.a.s.l., letter E in Table II) with the highest maximum daily intensity in 35 years of data with 39.9 mm/day on 21 January (Fig. 4b). The city of Putre (3560 m.a.s.l., letter F in Table II), located at the edge of the Precordillera, recorded the highest daily precipitation among all weather stations and the fifth strongest rainfall day (43.4 mm, 22 January) among all daily records (474 days) between 2001 and 2020 (Fig. 4d).
Table II Selected oceanic and dynamic variables observed during austral summer (DJF) days with extreme precipitation recorded at a subset of seven weather stations (see locations in Fig. 2a) from 2008-2020. The 90th percentile threshold for rainy days and total number of events recorded with precipitation exceeding the 90th percentile in the whole historical period for each weather station. In addition, the last three columns present average values for days with precipitation exceeding the 90th percentile of: sea surface temperature (SST, ºC), precipitable water vapor (PWV, mm), and zonal wind (m/s) in the lower troposphere (900-800 hPa) between 12-18 UTC. These three variables were averaged for a box located offshore Atacama Desert (70-75ºW, 18-20ºS). Anomalies computed subtracting the daily averaged climatology are shown in parentheses.
| Weather Station | Geographical Area | Height ASL (m) | 90th (mm) | Total events (#) | SST (ºC) | PWV (mm) | Zonal Wind 900-800 hPa (m/s) |
| A - Arica Chacalluta | Lowlands | 63 | 1.8 | 4 | 24.7 (+0.4) | 44.9 (+12.5) | 3.1 (+2.5) |
| B - Tacna, Peru | Lowlands | 469 | 4.9 | 3 | 24.0 (+0.2) | 40.9 (+10.3) | 2.5 (+2.0) |
| C - Huara en Fuerte Baquedano | Pampas | 1,100 | 2.9 | 1 | 24.7 (+0.1) | 46.5 (+13.0) | 2.5 (+1.9) |
| D - Río Camarones en Chilpe | Pampas | 1,565 | 4.8 | 12 | 24.3 (+0.0) | 43.7 (+11.4) | 1.9 (+1.3) |
| E - Mamiña | Precordillera | 2,730 | 8.0 | 15 | 24.5 (+0.2) | 45.2 (+12.7) | 1.9 (+1.3) |
| F - Central Chapiquiña | Precordillera | 3,350 | 12.5 | 37 | 24.2 (+0.1) | 39.0 (+7.6) | 0.8 (+0.2) |
| G - Putre | Precordillera | 3,560 | 14.4 | 39 | 24.2 (+0.1) | 39.9 (+8.4) | 1.3 (+0.7) |
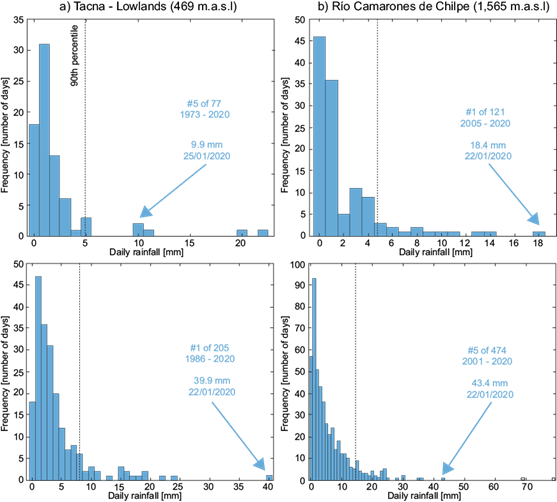
Fig. 4 Frequency distribution histogram for rainy days (>0 mm) during austral summer (DJF) for a) Tacna, b) Río Camarones en Chilpe, c) Mamiña and d) Putre, including the ranked position of the rainiest day in January 2020 and total number of events, period of data used, total accumulated (in mm) and date. Vertical dotted lines correspond to the 90th percentile (values in Table II).
3.1.2 Reanalysis
The lack of weather stations in vast areas of the Atacama Desert limits the analysis of precipitation (Fig. 1). Therefore, total precipitation estimates from ERA-5 are used to evaluate the spatial distribution. The total accumulated precipitation for the “wet period” (Fig. 1b) indicates that maximum values were concentrated between Precordillera and western Altiplano (red colors in Fig. 1b), with a decreasing tendency toward Lowlands (10 to 30 mm). To validate the ability of reanalysis correctly estimating precipitation, a joint distribution is calculated using the total rainfall estimated by ERA-5 and surface-based precipitation. Figure 5 shows that total precipitation increased from the Lowlands towards the Precordillera, reaching maximum accumulation > 100 mm there. Above 3000 m.a.s.l. ERA-5 indicates that total precipitation started to decrease toward the east, with values ranging between 40 to 100 mm in the Altiplano. Surface-based weather stations also exhibited an increase in rainfall toward higher altitudes (plotted in numbered circles in Fig. 5), with maximum values (62 to 114 mm) in Precordillera at Belén, Ticnamar, Central Chapiquiña and Putre (#12 to 15 in Fig. 2). The decreasing tendency of the precipitation toward the Altiplano is even larger in surface observations than ERA-5. For instance, Visviri (#16 in Fig. 2) recorded one of the lowest total accumulations quite similar to that in the Lowlands. While ERA-5 seems toº have captured the observed rainfall spatial distribution (i.e., a maximum in the Precordillera and lower values in Altiplano), it nonetheless overestimated the total accumulated precipitation, as reported by Olivares (2020), who identified up to 100% overestimates in total summer rainfall in 30-year averages.
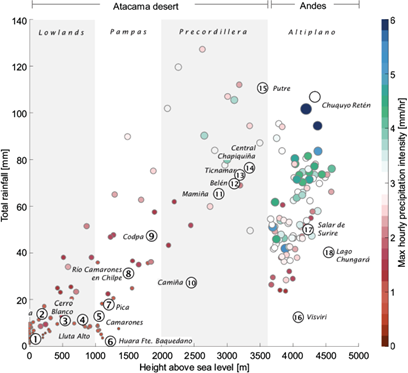
Fig. 5 Total rainfall-Height above sea level joint distribution for every grid point of ERA-5 (N = 255) in a box located at 17.5ºS-21ºS, 72ºW-68ºW (see dotted box in Fig. 1b) between 19 and 28 January 2020. The size of the circle/color indicates the maximum hourly rainfall observed in the period for each grid point. The main geographical areas are indicated in the upper part of the graph. Total rainfall for 17 of the 18 weather stations listed in Table I are also included. (Station Chuquyo Retén located a 4,400 m.a.s.l., 68.2ºW and 18.2ºS is not shown).
In summary, days with EP were recorded in several areas of the Atacama Desert in January 2020. Maximum precipitation was concentrated in climatologically-dry areas in the Lowlands, Pampas, and Precordillera. Daily intensities indicate that at least two stations (below 3600 m.a.s.l) recorded the strongest daily precipitation on record, highlighting the extreme nature of this precipitation event. Even some coastal cities also recorded extremely infrequent precipitation.
3.2. Regional atmospheric circulation
As the previous sections demonstrated, the period between 9 and 18 January was mostly dry, especially in the Lowlands, Pampas, and Precordillera. During the first part of the “dry period”, 9-13 January, the BH was centered over southeastern Brazil, as can be seen in Figure 6a. A trough was simultaneously located over the Southeast Pacific at 250 hPa (denoted as SPT, Fig. 6a), with northerly flow in the mid and upper troposphere over the Atacama Desert. The geopotential anomalies field shows an anomalous trough (SPT* in Fig 7a) located south of 8ºS in the southeast Pacific, with anomalies of about -30 to -60 m. Simultaneously, the anomalous ridge that accompanies the BH is located to the west of the coast of South Brazil. Near the surface at 850 hPa, the west coast of South America was under the margin edge of the subtropical high, with slightly positive values anomalies (Fig. 7a) and mostly southern winds along the Peruvian-Chilean coast (Fig. 6a). In the second part of the “dry period” (between 14 and 18 January), the center of the BH was displaced westward (Fig. 6b), and reached ~120 m above the January climatology for 250 hPa geopotential height over Central Argentina. Simultaneously, the SPT moved slightly eastward (Fig. 6b) with a southwest-northeast extension in both total magnitude and anomalies (Fig. 7b). A relative low-pressure system at 850 hPa at 20ºS formed offshore Atacama (Fig. 6b) with a closed geopotential minimum over this area, with geopotential heights at 850 hPa ~15 m below climatology (Fig. 7b). Note that 850 hPa geopotential anomalies show a sharp gradient between the southeast Pacific, with negative values, and the Amazon Basin, with positive anomalies. It seems plausible that the SPT and BH, located on different sides of the Andes, combine to affect the lower troposphere. And while the offshore low-pressure system (L and L* in Figs. 6b and 7b) was not evident as a closed isobar at the surface, it did result in a decrease in sea level pressure along the Peruvian-Chilean coast. For example, the sea level pressure in Antofagasta (23.5ºS, Fig. 8a) reached a minimum of 1009 hPa (below the daily 10th percentile) on January 17, coinciding with the end of the “dry period”.
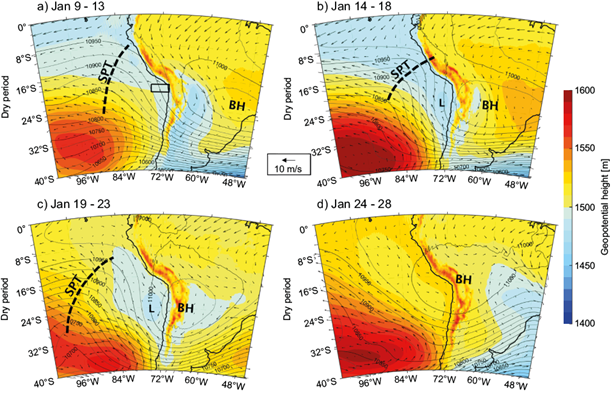
Fig. 6 Five-day average of 850 hPa geopotential height (shaded color, in m), 850 hPa winds (black arrows, in m/s) and 250 hPa geopotential height (black contours; in m) for: a) 9-13 , b) 14-18, c) 19-23 and d) 24-28 January 2020. Upper panels correspond to the “Dry period” and bottom panels to the “Wet period”. The black box in panel a) represents the Atacama Desert Coast (ADC) for Figure 8. Label SPT indicates the location of the South Pacific Trough. Similarly, for BH: Bolivian High and L: Low pressure offshore Atacama.
The BH was centered around 23ºS over the Andes cordillera from 19 to 23 January (Fig. 6c) and with stronger anomalies (Fig. 7c) over Central Chile (33ºS) than during the previous period. This configuration produces a more intense than usual easterly flow at high levels in the troposphere, especially over northern Chile and the Atacama Desert. Several studies (Aceituno and Montecinos, 1993; Lenters and Cook, 1999) demonstrated that the intensity and position of the BH plays a relevant role in wet or dry episodes over the Altiplano. The poleward displacement induces an easterly flow over the eastern slope of the Andes, transporting the abundant moisture from the center of the continent toward the Andes plateau, enhancing convection and precipitation (see Fig. 3a in Garreaud et al., 2003). However, such research focused on the Andes highlands (e.g., Garreaud, 1999), using data from weather stations above 4000 m.a.s.l. According to Reyers et al. (2021), strong easterlies over northern Chile result in clusters of thunderstorms moving from the Altiplano toward the coast, producing strong rainfall in the Atacama Desert. In the January 2020 event, precipitation occurred not only in the Altiplano but in the Precordillera and even in the lower part of the Atacama Desert, raising questions about the classical understanding of extreme precipitation days in the area
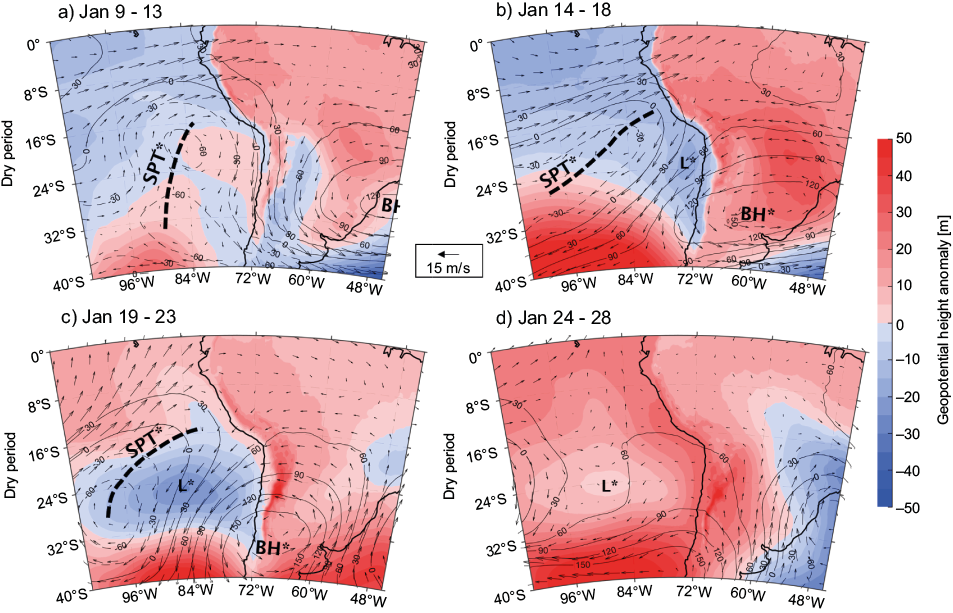
Fig. 7 Five-day average of 850 hPa geopotential height anomalies (shaded color, in m), 250 hPa winds anomalies (black arrows, in m/s) and 250 hPa geopotential height anomalies (black contours; in m) for: a) 9-13 , b) 14-18, c) 19-23 and d) 24-28 January 2020. Upper panels correspond to the “Dry period” and bottom panels to the “Wet period”. Anomalies were computed with respect to the 1981-2010 January average. Label SPT* indicates the location of the Anomalous South Pacific Trough. Similarly, for BH*: Anomalous Bolivian High and L*: Anomalous low-pressure offshore Atacama.
The synoptic configuration during the first part of the “wet period” shows not only the poleward displacement of the BH and the presence of an anomalous SPT, but also a low-level (i.e., 850 hPa) cyclonic circulation at 20ºS offshore Atacama (Fig. 6c), with anomalies slightly displaced to the west (Fig. 7c) about midway between the center of the SPT and the BH. It seems plausible that this upper air configuration would produce anomalous ascent between the trough and the ridge, generating the low-pressure system (L* in Fig. 7c) observed at 850 hPa.
Once the BH reverts to its climatological position and the SPT moves westward, the low-level cyclonic system weakens considerably, both in the absolute terms (Fig. 6d) and anomalies (Fig. 7d).
The synoptic configuration observed in the lower troposphere offshore northern Chile caused major changes in the PWV content. During the first half of the “dry period”, low-level winds were mostly southerly, consistent with the anticyclonic circulation (see white, yellow, and red arrows in Fig. 9a). PWV values estimated by ERA-5 were ~ 30 mm over Southern Peru, close to the climatological average of the Atacama Desert Coast (ADC, 70-75ºW and 18-20ºS) (see a black box in Fig. 6a). However, during the second half of the “dry period” and when the minimum pressure was observed in Antofagasta (Fig. 8a), low-level (850 and 700 hPa) southerly winds collapsed due to the presence of the offshore cyclonic feature (Fig. 9b). The collapse was even more evident at 850 hPa, where northerly winds were observed even as far north as 12°S (Peruvian coast) with considerable advection of tropical air masses toward the subtropical Atacama Desert. Concurrently, the PWV started to increase in magnitude along all the Peruvian-Chilean coast (Fig. 9b), reaching values close to 40 mm between 14 and 18 January. The moist air from the Peruvian coast was advected toward the Atacama Desert by anomalous northerlies, forming a humidity tongue trapped along the Southeast Pacific coast. During the “wet period” (Fig. 9c and d), anomalous northwesterly winds were present at 850 hPa, leading to PWV values above 50 mm offshore the Atacama Desert and between 20-40 mm over the Pampas and Precordillera. The daily evolution of the PWV in the ADC (Fig. 8b) shows a maximum of 48.3 mm on 25 January, well above the daily 90th percentile which ranges between 38 and 40 mm during January (dotted blue line in Fig. 8b), and 18.1 mm above the climatological average (solid blue line in Fig. 8b). Antofagasta (23.5ºS) daily sounding data also confirms the sharp increase in PWV values, from ~20 mm during the first days of the “dry period” (similar to the climatological average, Fig. 8b) to ~50 mm by the end of the “wet period”. Note that ERA-5 correctly estimated the PWV in the nearest grid point to Antofagasta (Fig. 8b), with a root mean square error (RMSE) of 1.27 mm and Pearson correlation of 0.99 for the entire month of January. In stark contrast, the NNR1 does not capture the PWV associated with this event in the Atacama Desert. Major differences are observed between the Antofagasta sounding and the nearest grid point in NNR1 (Fig 8b) with an RMSE of 8.7 mm and a Pearson correlation of 0.8. These results provide more confidence in the use of ERA-5 and confirm a similar conclusion from previous studies (Zhang et al., 2018).
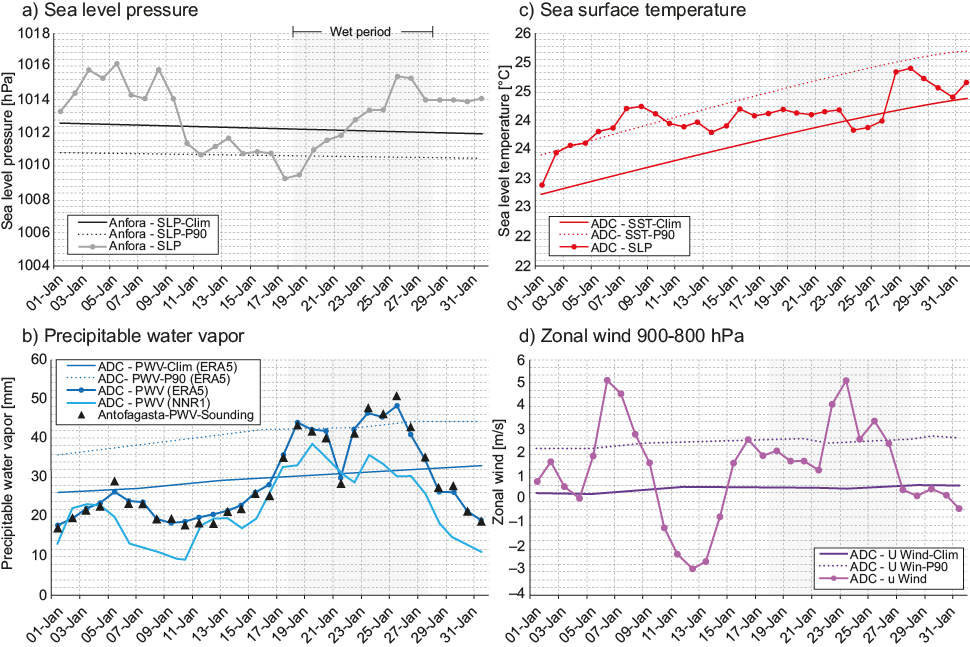
Fig. 8 a) Daily average of sea level pressure (circle solid gray line) at Antofagasta weather station [23.5ºW, 70.5ºW, red triangle in Fig. 1a]. b) Daily precipitable water vapor from the 12 UTC Antofagasta sounding (black blue triangle) compared with values in the Atacama Desert Coast (ADC) [70-75ºW, 18-20ºS], see box in Fig. 6a) from ERA5 (blue solid line) and NCEP-NCAR Reanalysis 1 (light blue solid line). c) Daily SST from NOAA ERSST V5 (circle solid red line) at ADC and d) Daily zonal wind in the layer 900-800 hPa for 12-18 UTC from ERA5 (circle solid magenta line) at ADC. The climatological average (solid line) and 90th percentile (dotted line) are also included in each panel, both for observations or reanalysis (see details in legends), using a 30-day running average.
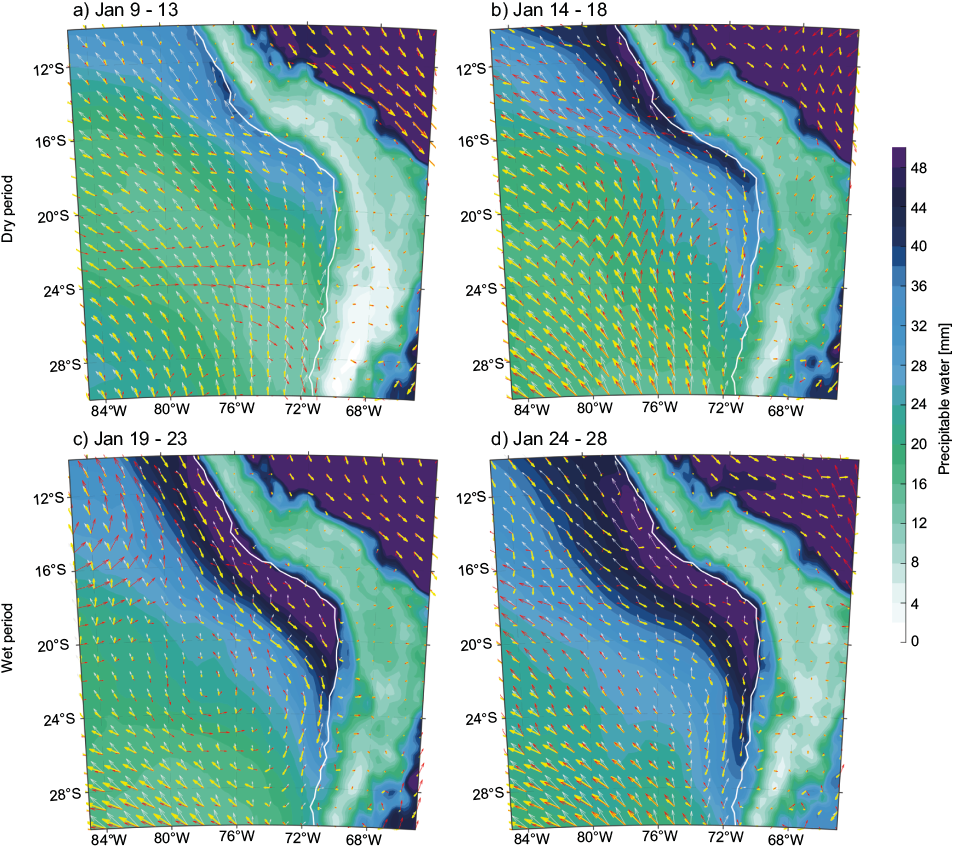
Fig. 9 Five-day average of total precipitable water vapor (shaded color, in mm) and wind vectors (white arrow at 1000 hPa, yellow at 850 hPa and red at 700 hPa; in m/s) for: a) 9-13 , b) 14-18, c) 19-23 and d) 24-28 January 2020. Upper panels correspond to the “dry period” and bottom panels to the “wet period”.
The presence of anomalous PWV offshore central and northern Chile could be a major factor leading to intense rainfall in the area, as suggested by Fuentes (2014), Barrett et al. (2016), and Rondanelli et al. (2019). During the catastrophic EP event in March 2015 that lasted several days, anomalous PWV were transported from the tropical eastern Pacific toward northern Chile by a cyclonic configuration generated by a deep cut-off low. Such humidity advection along the Peruvian-Chilean coast combined with the instability ahead of the cut-off low and also with a forced ascent due to the Andes, resulting in the EP event of 2015. Bozkurt et al. (2016) mentions also the presence of warm SST anomaly offshore the Atacama Desert associated with the 2015-2016 El-Niño onset that favored anomalous PWV due to thermodynamic processes in the MBL. Both the anomalous PWV and warmer SSTs in the ADC area (Fig. 7c) were present during the “wet period” in January 2020, highlighting a potential relationship with the extreme precipitation event in the Atacama Desert.
As shown, the low-level cyclonic circulation offshore Atacama was present by the end of the “dry period” and during the “wet period”. This cyclonic circulation was especially strong at 850 hPa; meanwhile, the BH shaped an intense easterly flow above 500 hPa, due to the anomalous poleward position. Figure 9 shows that moist air was transported from the Peruvian coast to the northern Chile coast in the low troposphere due to the northerly winds. To support this result, IVT was estimated in the 900-700 hPa layer, in which most of the total column IVT in the area is observed (Ralph et al., 2004). IVT has been demonstrated to be useful analyzing atmospheric rivers from the tropical eastern Pacific towards the Atacama Desert (Böhm et al., 2018).
While on 19 January the cyclonic circulation offshore northern Chile extended to 850 hPa (Fig. 10a), there was yet no evidence of moisture advection. It seems that the formation of the low triggers the southward humidity flow in the lower troposphere one day later, when a narrow of IVT < 150 kgm-1s-1 appeared offshore Peru (12ºS) transporting humidity toward the Atacama Desert through an atmospheric river-like structure. On 21 and 22 January, relatively high levels of IVT (100 to 150 kgm-1s-1) are observed in northern Chile (Fig. 10c and d) north of 24ºS. Those were the wettest days in the Lowlands and Pampas (Fig. 3a), indicating a potential strong link between humidity transport and rainfall. The advection of humidity between 900-700 hPa levels agreed well with the sounding observations at Antofagasta, where the mixing ratio increased from less of 2 g/kg during the “dry period” to more than 6 g/kg during the “wet period” and reached ~10 g/kg in the 880-760 hPa layer during the wettest day on the Precordillera (23 January). Positive zonal winds between 900-800 hPa were observed in the ADC area (Fig. 8d) throughout the “wet period”, with averaged afternoon (12-18 UTC) values of about 5m/s and above the 90th percentile for this period. Such unusually strong westerlies transported humidity inland ahead of the low-level cyclonic system located offshore.
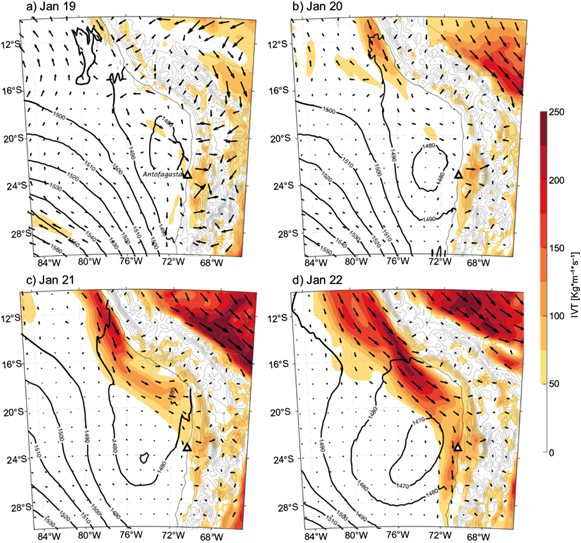
Fig. 10 Integrated Vapor Transport (shaded colors, in kg m-1s-1) in the layer 900-700 hPa and 850 hPa geopotential height (black contours, in m above sea level) at 18 UTC for: a) 19, b) 20, c) 21 and d) 22 January 2020. Geopotential contours over land were plotted in gray colors to avoid visualization problems.
The observed structure offshore the Atacama partially complies with the definition of atmospheric rivers (ARs) given by Guan and Waliser (2015). The length of the structure observed offshore Atacama was about ~3,000 Km (from northern Peru to northern Chile), about 1000 km larger than the Guan and Waliser (2015) threshold. Nevertheless, it meets both the landfalling criterion (observed on 21 January, Fig. 10c) and the narrowness criterion (length/area > 2). The observed IVT values are above 100 kgm-1s-1, especially during 21 and 22 January (Fig. 10c and d). Viale et al. (2018) determined that ARs should be associated with frontal regions, a situation not met in this case. Therefore, this structure is labelled here as an “atmospheric river-like” structure, a very important feature observed during the “wet period” and the wettest day in the Atacama Desert.
In summary, major differences were found in the regional circulation between the “dry period” and the “wet period”. An anomalous BH displaced southward was accompanied by an SPT offshore Peru. Moreover, the decrease in sea level pressure offshore the Atacama Desert and the formation of a cyclonic circulation at 850 hPa before the precipitation event appear linked to the upper-troposphere configuration. This low pressure seems to be a key feature resulting in the advection of anomalous PWV through an atmospheric river-like structure along the Peruvian-Chilean coast, in the context of warmer SSTs that favor increased near-surface humidity.
3.3. Local circulation
Vertical profiles from the 12 UTC sounding in Antofagasta (23.5ºS, black triangle in Fig. 10, ~400 km south of the main region of analysis) show a classical well-mixed MBL during most days during the “dry period” (9 to 18 January). The potential temperature profile (Fig. 11a) shows a neutral boundary layer from 1000 to 900-850 hPa, with maximum mixing ratio of ~10 g/kg around 940-910 hPa (Fig. 11b) and relative humidity close to 100% (Fig. 11c) at the top of the MBL. An important and abrupt increase in potential temperature is observed in the free troposphere, with mixing ratio below 4 g/kg (Fig. 11b) and relative humidity less than 20% (Fig 10c), typical of warm-dry subsidence above the Atacama Desert coast.
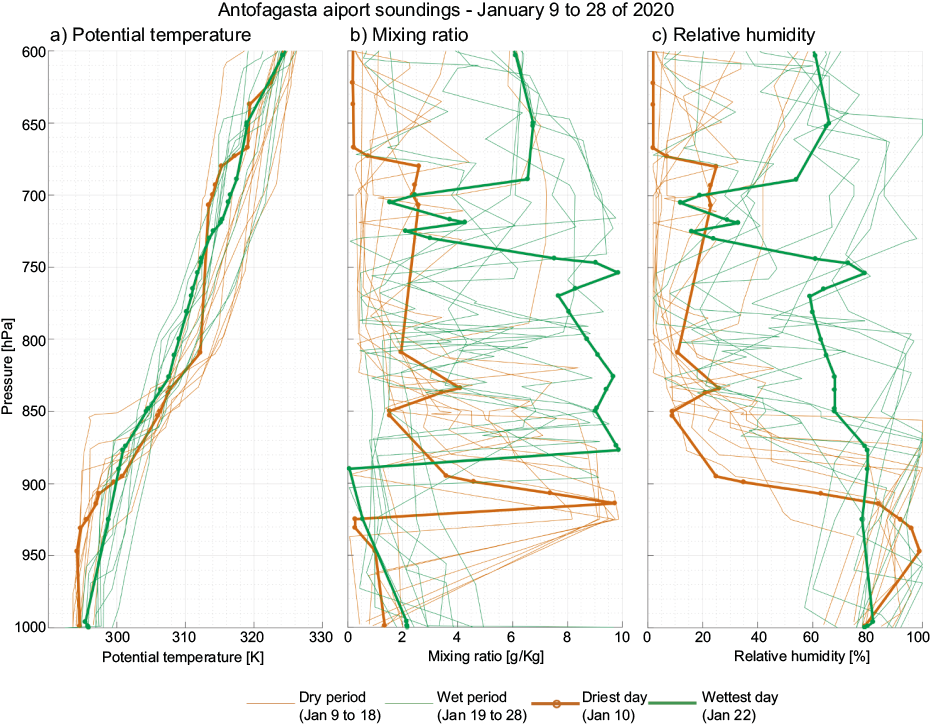
Fig. 11 Daily soundings at Antofagasta (23.5ºS, see location in fig. 1a) at 12 UTC for (a) potential temperature (in K), (b) mixing ratio (g/kg) and (c) relative humidity (%).Soundings between 9 and 18 January 2020 (dry period) are shown in brown, while soundings from 19 to 28 January 2020 (wet period) are shown in green. Thick brown and green lines correspond to the driest day (10 /01/20) and the wettest day (22/01/20), respectively.
The vertical profiles of potential temperature during the “wet period” (19 to 29 January) show a warmer (1-3 K) and moister (2-3 g/kg) boundary layer with respect to the “dry period”. In contrast, the “wet period” is characterized by a cooler free troposphere by, up to -3 K between 900 and 750 hPa. Figure 10b shows humidity increase above the Atacama coast, with mixing ratios of 8 to 10 g/kg between 900 and 750 hPa during the wettest day at this location (22 January 22) and relative humidity ~ 60-70%,
Warm anomalous SST offshore Atacama (Fig. 8c) could be responsible for the increase in near-surface air temperature and mixing ratio due to the turbulent process in the MBL, particularly if present for several days (Bozkurt et al., 2016). Additionally, another factor is the moisture advection from the Peruvian coast through the atmospheric river-like structure in the 900-700 hPa layer (see Fig. 10) located ahead of the cyclonic feature offshore Atacama, consistent with the evolution of mixing ratio inferred from soundings from Antofagasta and especially evident during the wettest day (22 January).
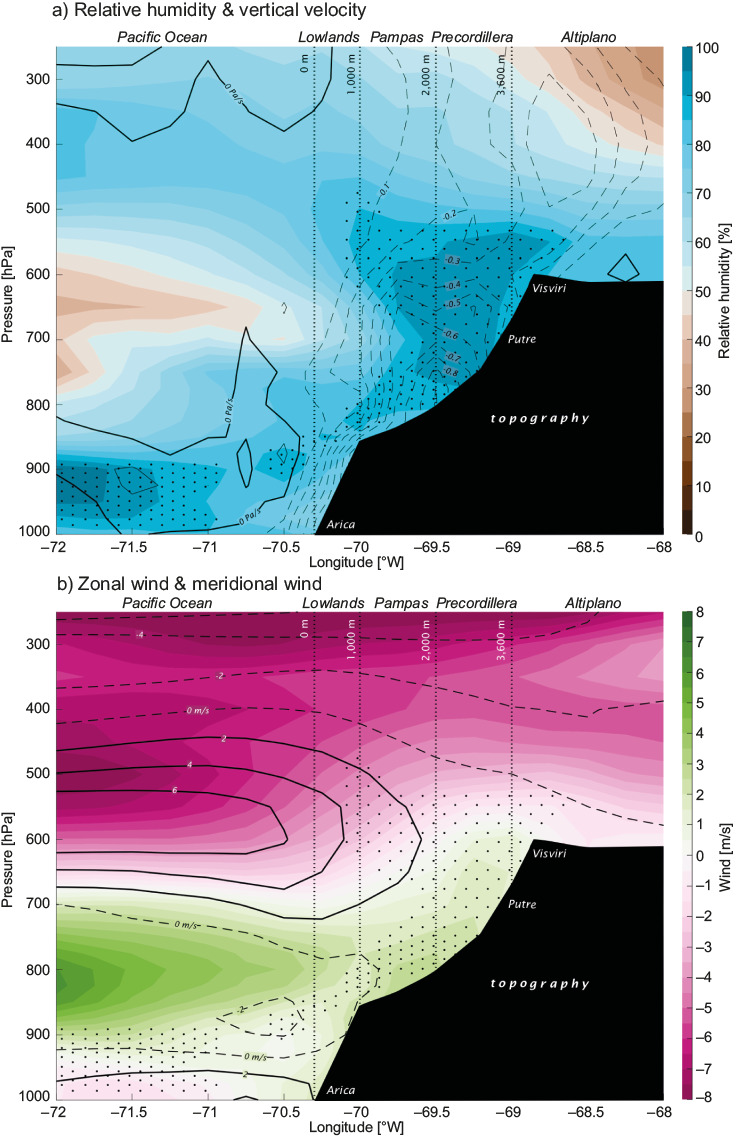
Average relative humidity, vertical velocity, zonal and meridional wind from ERA-5 for the driest day of the period (10 January) are shown in Figure 12 as vertical cross-sections at 18-20ºS and 72-68ºW. A deep dry layer (dark brown colors in Fig. 12a) is seen west of the Andes over the Atacama Desert and offshore, with very low values ~ 5-20%. This area of low RH is located between 900-500 hPa, with a minimum near ~650 hPa, in agreement with the Antofagasta sounding about 400 km to the south (Fig. 11c). Positive vertical velocity (in Pa s-1) is observed in the same region inhibiting cloud formation above the marine boundary layer. In contrast, ascent (negative vertical velocity) is seen in the layer near the ground over the Atacama Desert, from the coast to the Altiplano. This region coincides with westerly zonal winds (green colors in Fig. 12b) during the afternoon of the driest day with values around 2-4 m/s, indicating an inland flow between Lowlands and Altiplano.
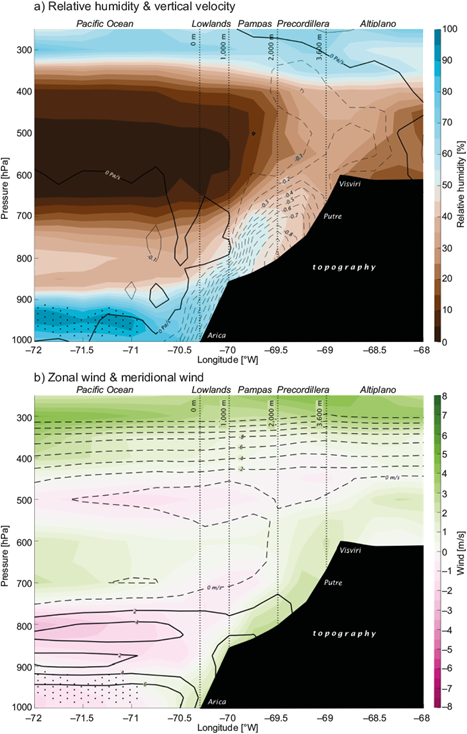
Fig. 12 Vertical cross sections on the afternoon (14-22 UTC) of the driest day (10/01/2020) in Atacama Desert, averaged over the box located at [18ºS-20ºS, 72ºW-68ºW]. a) Relative Humidity (shaded; unit is % every 5%) and Vertical Velocity (black contours; unit is Pa/s every 0.1 Pa/s). b) Zonal wind (shaded, units are m/s every 1 m/s) and meridional wind (dashed lines for negative values, in m/s every 2 m/s). In both panels the black dots represent areas where RH is higher than 85% (e.g., potential areas of clouds). The topography is depicted by the black polygon and vertical black dashed lines indicate the main geographical areas (lowlands, pampas, precordillera and Altiplano).
Surface observations at Putre (3532 m.a.s.l., Fig. 13a) and Visviri (4084 m.a.s.l., Fig. 13b) confirm westerly zonal winds in the afternoon of 10 January, as part of a strong diurnal cycle (diurnal westerlies and nocturnal easterlies), especially evident from 5 to 12 January. These observations agree with the circulation observed by Rutllant et al. (2003). Mixing ratio shows a positive trend in Visviri and Putre, from 1 g/kg during the driest day (10 January, see the vertical box in Fig. 13) up to ~8-10 g/kg after 13 January. The diurnal cycle of the zonal winds is still present between 13 and 19 January, but its oscillation is less evident than before 13 January. Low-intensity rainfall (less than 10 mm day-1) is observed in both Putre and Visviri during this period. These observations agree with Garreaud (2000), who determined that Altiplano rainy episodes are usually linked with mixing ratio values close to 8 g/kg in Visviri, which leads to unstable conditions within the boundary layer (Garreaud, 1999). From 19 to 23 January, daily rain intensity increases in Putre, reaching a maximum on 22 January (the wettest day). Note that mixing ratios are not higher than in previous days, but zonal winds (Fig. 12a) become almost entirely westerly from 20 to 23 January, toward the Altiplano. Although mixing ratio is a key component for instability in the region (Garreaud, 1999), it does not explain changes in the intensity of precipitation after and before 19 January. As Garreaud et al. (2003) showed, westerlies over the Altiplano are usually associated with the transport of dry air originated over the Atacama Desert, which tends to suppress moist convection and precipitation over the Altiplano. However, our data suggests that the westerlies in Putre were very effective in maintaining a moist boundary layer in the Precordillera, leading to the highest precipitation in January 2020. This is probably related to the moistening of the Atacama Desert via the “atmospheric river-like” structure observed the previous days and the warm SSTs which efficiently moistened the layer from the surface to ~600 hPa. Westerlies under forced ascent and carried moist air toward the Precordillera and the Altiplano, not only increasing local instability but also triggering more intense precipitation in the Precordillera than in the Altiplano (no major precipitation is observed in Visviri during this period and the diurnal cycle in zonal wind is maintained, Fig 13b).
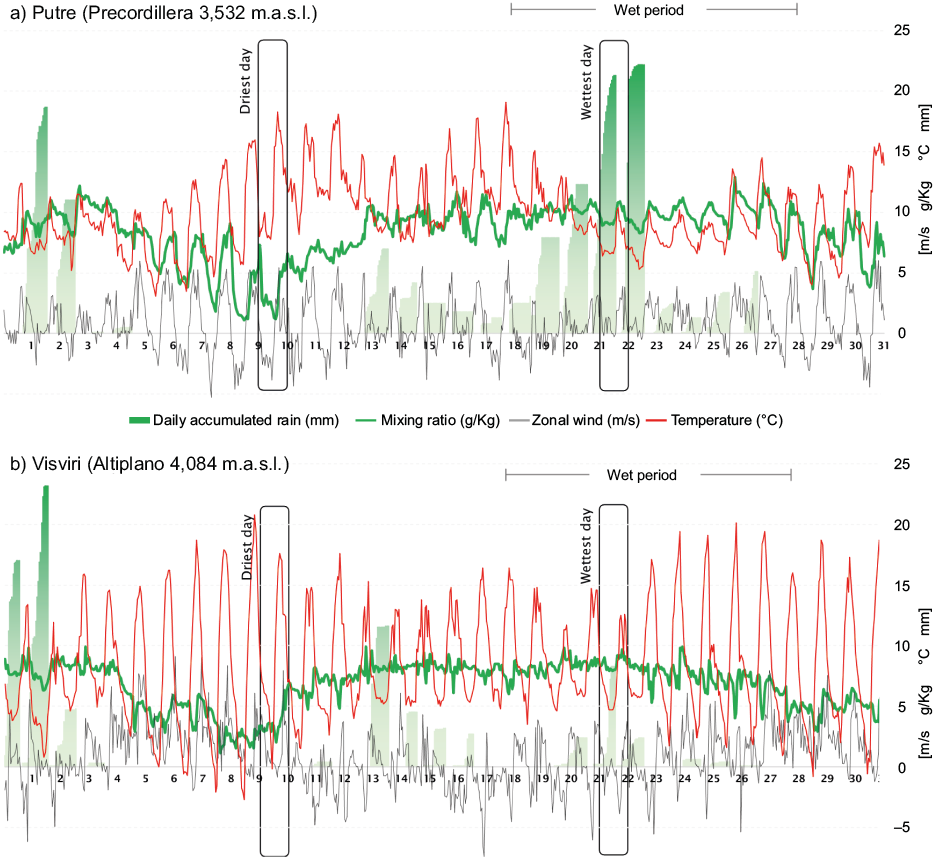
Fig. 13 Hourly time series of 2 m temperature (ºC, red line), mixing ratio (g/kg, green line), zonal wind (m/s, black line) and 24 hour daily accumulated precipitation to 12 UTC (green bars) for Putre (a) and Visviri (b). Horizontal labels indicate the day and every tick mark corresponds to 00 UTC between 1 and 31 January 2020.
The vertical cross-section of relative humidity corresponding to the wettest day (Fig. 14a) shows much higher values than on the driest day (Fig. 12a) and much more widespread. Relative humidity values are higher than 85% in several areas close to the surface, a potential indicator of cloud formation. The westerly flow is also more evident toward the Precordillera (Fig. 14b), with an important northerly component in the 900-700 hPa layer, consistent with the “atmospheric river-like” structure arriving at the coast.
The wettest day has relative humidity values about 20 to 60% higher than the driest day, and most of the troposphere below 500 hPa is moister (Fig. 15a). There is an evident humidity maximum located just above the Lowlands and Pampas at ~600 hPa. The vertical velocity also shows stronger ascent on the wettest day compared to the driest day, with a maximum anomaly (wet minus dry) located close to the maximum humidity anomaly, between 800 and 600 hPa. Similarly, the zonal wind is also stronger during the wettest day (Fig. 15b) in the layer between 950-700 hPa, extending from the ocean toward the continent and reaching the Andes foothills. Immediately above this area, the zonal wind difference shows positive values, an indicator that the easterlies are stronger and agreeing with the equatorward quadrant of the BH circulation.
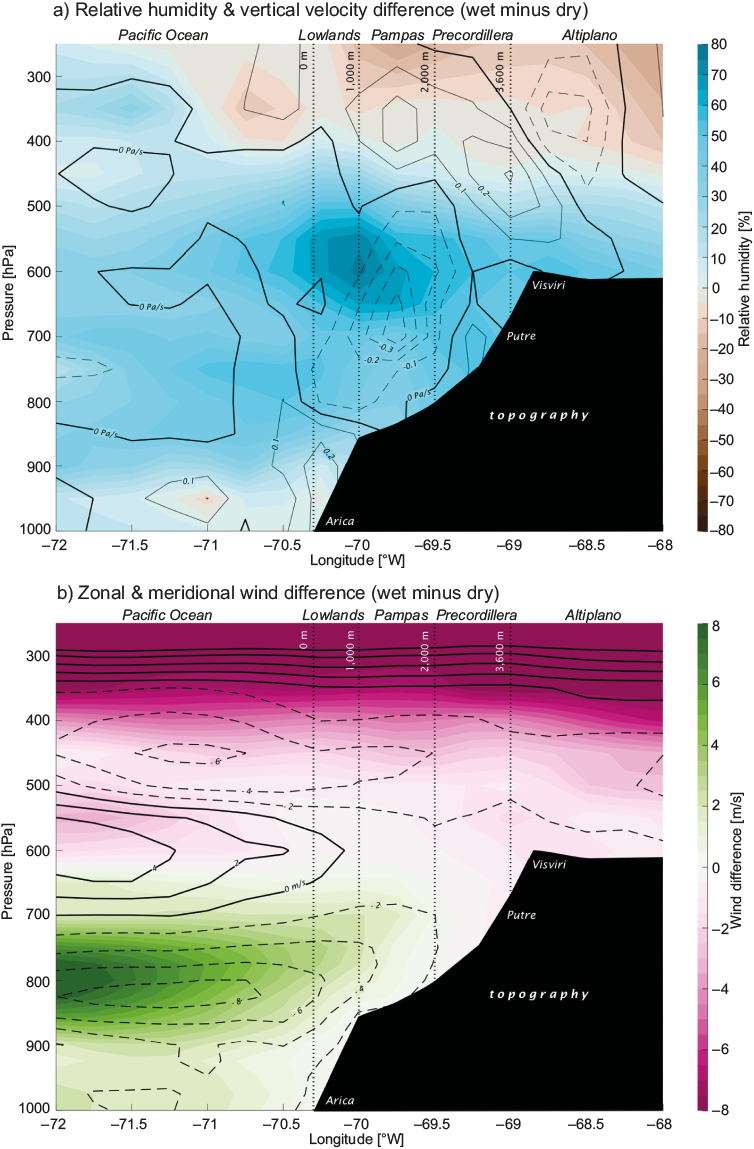
Fig. 15 Same as Fig. 12, but for the difference between the wettest day (22/01/20) and the driest day (10/01/20).
Forced topographic ascent is very likely a key factor leading to the EP observed on the western slope of the subtropical Andes. The strong westerlies (above the 90th percentile for January, see Fig. 8d) and higher humidity fueled the clouds in a north-south line along the Precordillera around 14 UTC (Fig. 16a) during the wettest day (22 January). Brighter clouds almost perfectly hug the narrow region of the Precordillera by 16 UTC (Fig. 16b) and expanding to the Pampas and also the Altiplano by 18 UTC (fig. 16c), although with maximum brightness and coverage in the Precordillera from southern Peru (17ºS) to Antofagasta region (22ºS). Air parcel trajectory analysis using the HYSPLIT model suggests that during 22 January, the westerly flow in the boundary layer effectively carries air from the coast toward the Precordillera and Altiplano. Air parcels from the Pacific offshore the Atacama Desert end in Putre (blue triangle in Fig. 17) at 0, 500 and 1000 m.a.g.l. (blue lines in Fig. 17). In fact, the air parcel ending at 1000 m.a.g.l. (dotted blue line in fig. 17) crosses the Precordillera to reach the Altiplano (on the Chilean-Bolivian border) before returning to Putre. Similarly, air parcels ending at different altitudes over Mamiña (black triangle in Fig. 17) initiate over the Pacific Ocean. Air parcels arriving in both Putre and Mamiña are located close to the surface during most of the trajectory. An air parcel ending at the surface in Arica originates quite a bit to the south, while parcels ending at 500 and 1000 m.a.g.l. originate to the north and northwest, respectively, probably related to the “atmospheric river-like” structure previously described. Low-level moist air parcels ascend due to the abrupt topography and develop a cluster of deep convection along the Precordillera and even in the Altiplano, as observed south of Putre (black arrow labeled #1 in Fig. 17). This cluster developed lightning activity as observed by GOES-16 GLM. The lightning time evolution can be used as a proxy for cluster motion, observed on the Precordillera at 17 UTC (red dots) moving toward the southeast and reaching the Altiplano between 18 and 19 UTC. This cluster lasted around four hours, with the last lightning detected around 20 UTC. A second storm cluster developed north of Putre at 18 UTC with few lightning flashes (black arrow labeled #2 in Fig. 17), and then moved eastward to the Chilean-Bolivian Border, ending at ~22 UTC. This storm motion is consistent with the air parcel trajectory estimated by HYSPLIT indicating an intrusion of westerly air into the Altiplano and with the surface zonal wind observed in Putre (Fig. 13a). Recall that diurnal warming on the Andes also results on afternoon westerlies. However, note that maximum temperatures in Putre and Visviri (Fig 13) on the wettest day (during the “wet period”) are lower than on the driest day (during the “dry period”), and also the zonal winds show smaller magnitudes. The diurnal cycle may still present during this extreme precipitation episode, but it is unlikely the dominant factor responsible for the westerly component. Results indicate that those westerlies are associated with the forced ascent of low-level moist air.
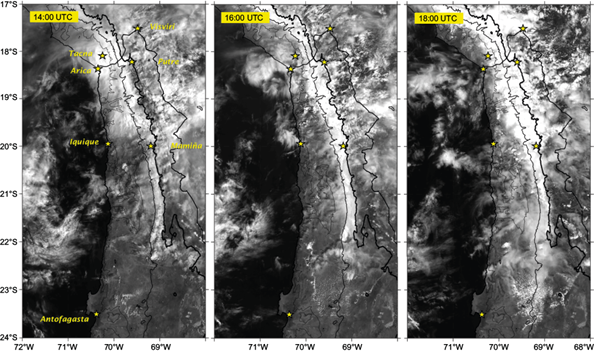
Fig. 16 Visible image (channel 2) from GOES-16 satellite at 14:00, 16:00 and 18:00 UTC for 22 January 2020. Black solid lines separate different geographical areas (Lowlands, Pampas, Precordillera and Altiplano). Yellow stars correspond to main cities and/or weather stations.
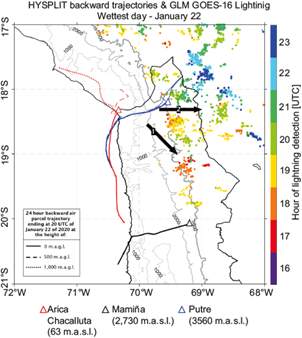
Fig. 17 24-hour backward air parcel trajectory from the HYSPLIT model with GFS, ending at 20 UTC at Arica (red triangle), Mamiña (black triangle) and Putre (blue triangle). Trajectories are plotted in colors, according to the finishing point location. The height above ground level where the air parcels arrives are indicated in dotted lines for 1000 m.a.g.l., segmented line for 500 m.a.g.l. and solid line for 0 m.a.g.l. Dots indicate the location of lightning activity identified by GOES-16 GLM, colored according to the hour of occurrence. Black arrows represent the estimated motions of two clusters of storms.
In summary, an enhanced local circulation is present during the wettest day over the Atacama Desert, with more intense than usual northeasterlies advecting humidity from the coast toward the Atacama Desert below 500 hPa. Forced topographic ascent leads to cloud formation and thunderstorms mainly over the Precordillera, spreading toward the Altiplano and the Lowlands in the afternoon, enhancing precipitation across southern Peru and northern Chile mostly in areas below 3600 m.a.s.l.
3.4. Historical context
In order to assess the frequency of occurrence of these combined synoptic and thermodynamic features in northern Chile during austral summer, we compute the joint distribution of daily SST, PWV, and afternoon low troposphere zonal wind averaged in a box located offshore Atacama (70-75ºW, 18-20ºS) for DJF between 2008-2020. As can be seen in Figure 18, summer SSTs range from 20ºC to 27ºC offshore the Atacama Desert and PWV range between 15 mm to 50 mm. Zonal winds are mostly westerly, with a climatological average around 0.5 m/s but ranging from -5 to 5 m/s. Figure 18 also includes the extreme precipitation (EP) days in several weather stations located in the Lowlands, Pampas and Precordillera, above the 90th percentile thresholds of rainy days (see values in Table II), evidencing that most of EP days (dotted line circle) occurred under high SST and high PWV values, and also under low troposphere westerly winds. This is especially true for locations in the Lowlands, Pampas, and Precordillera where the combination of SST between 23-26ºC, PWV 37-52 mm, and zonal wind 2-6 m/s can potentially trigger EP. Most EP days observed in the Lowlands and Pampas occurred under this combination of variable ranges. Stations Mamiña (2730 m.a.s.l.) and Putre (3560 m.a.s.l.) in the Precordillera also recorded almost all EP days in the upper-right quadrant of Fig. 18. It is surprising that even in the higher regions of the Precordillera close to the Altiplano, there is a strong influence of this new thermodynamic mechanism, since 30 of the 39 events of extreme precipitation in Putre occurred under high SST, high PWV (inside the dotted circle in Fig. 18) and westerlies.
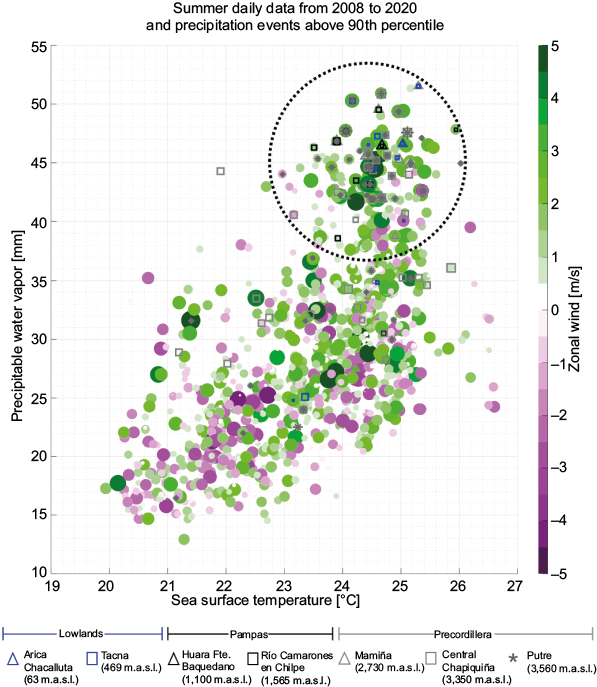
Fig. 18 Scatter diagram of daily data for austral summer (DJF) from 2008 to 2020 for sea surface temperature (horizontal axis) and precipitable water vapor (vertical axis), measured at 18 UTC for a box located offshore Atacama Desert (70-75ºW, 18-20ºS). Colored circles and size represent the afternoon (12-18 UTC) zonal wind averaged in the layer 900-800 hPa. Triangles and square correspond to days when precipitation was above the 90th percentile of historical data (see values in Table II) for seven weather stations: Arica and Tacna (Lowlands, blue), Huara en Fuerte Baquedano and Río Camarones en Chilpe (Pampas, black), and Mamiña, Central Chapiquiña and Putre (Precordillera, gray).
4. Discussion and Conclusions
This study reports an intense record-breaking rainfall event in late January 2020 over the Atacama Desert. The rain was concentrated in the Precordillera, but was also observed in the Lowlands, and Pampas, areas that are climatologically extremely dry. The classical mechanism to explain precipitation over the Altiplano (Garreaud et al., 2003; Reyers et al., 2021) only partially explains the moisture source and resulting precipitation.
The results here presented indicate that in January 2020, a combination of a BH displaced poleward with an SPT offshore Peru were conducive to the formation of a low pressure/cyclonic circulation offshore the Atacama Desert between 900-700 hPa, inducing northwesterly winds along the Peruvian-Chilean coast. These winds advected high PWV resulting in anomalies of between 10-30 mm above climatology, through an “atmospheric river-like” structure (IVT < 250 kgm-1s-1) along the coast, weakening subsidence and dry conditions in the Atacama Desert. In addition, above normal offshore SST (+0.5 to +1.0ºC) increased near-ground temperature and mixing ratio, efficiently moistening air parcels from the surface to ~600 hPa. Moist air was advected eastward (e.g., from the coast to the Precordillera) by the circulation ahead of the anomalous low-pressure system. Forced topographic ascent of such moist air triggered instability and convection, leading to thunderstorms and intense rainfall over the western slope of the Andes, from southern Peru to northern Chile (18 to 23ºS). Table II summarizes the average of SST, PWV, and low troposphere zonal wind during the EP days, including anomalies from climatology. While care should be taken due to the relatively small number of events, they nevertheless can be useful for short-range forecast of EP events in climatologically dry areas where even a single day of intense precipitation can lead to major impacts on population and infrastructure.
A conceptual model of the synoptic and local circulation mechanism is summarized in Figure 19. Large scale features (Fig. 19a) include the presence of the SPT (gray dashed line) offshore Peru and the BH centered at 24ºS over the Andes (gray circle) above 500 hPa. The key feature in the lower troposphere is the presence of a low-pressure cyclonic system offshore the Atacama Desert (blue circle) advecting high PWV through an “atmospheric river-like” structure toward the desert (green strip). Warmer than normal SST along the Peruvian-Chilean coast also contributes to increase near-surface humidity. The local circulation (Fig. 19b) shows strong westerlies at 900-700 hPa (green arrows) advecting humidity toward the western slope of the Andes, enhancing clouds and precipitation from the Lowlands to the Precordillera. Easterly winds (pink arrows) above 500 hPa are associated with the northern sector of the BH.
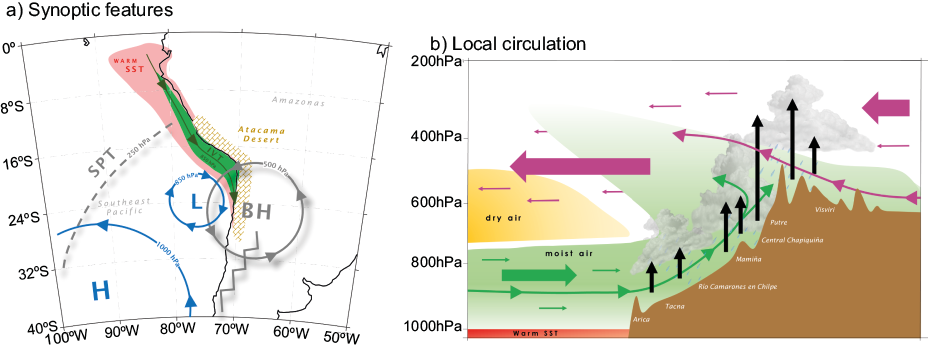
Fig. 19 Schematic figure describing the January 2020 extreme precipitation event. a) synoptic configuration. b) local circulation for a cross-section averaged between 18 and 20ºS. BH: Bolivian High; SPT: South Pacific Trough; IVT: Integrated Vapor Transport.
Further research is needed to assess the origin of the low troposphere cyclonic circulation that triggered the “atmospheric river-like” structure along the southeast Pacific. Moreover, the role of the warm SST should be quantified performing numerical experiments (as in Bozkurt et al., 2016), as well as the role of potential modulation on the sub-seasonal scale. Finally, mesoscale simulations could improve the understanding of the influence of topography on precipitation in the Atacama Desert.

