SciELO - Scientific Electronic Library Online

 
vol.35 número1Long-term measurements of aerosol optical properties and radiative forcing (2011-2017) over Central AmazoniaVulnerability assessment studies on climate change: A review of the research in Mexico índice de autoresíndice de materiabúsqueda de artículos
Home Pagelista alfabética de revistas  

Servicios Personalizados

Revista

Articulo

Indicadores

Links relacionados

  • No hay artículos similaresSimilares en SciELO

Compartir


Atmósfera

versión impresa ISSN 0187-6236

Atmósfera vol.35 no.1 Ciudad de México ene. 2022  Epub 22-Mar-2022

https://doi.org/10.20937/atm.52808 

Articles

Diurnal, seasonal, and vertical distribution of carbon monoxide levels and their potential sources over a semi-arid region, India

Elijabetthamma Busa1 

Balakrishnaiah Gugamsetty1 

Raja Obul Reddy Kalluri1 

Rama Gopal Kotalo1  * 

Chakradhar Rao Tandule1 

Lokeswara Reddy Thotli1 

Manjunatha Chakala1 

Surya Nagi Reddy Palle1 

1Aerosol and Atmospheric Research Laboratory, Department of Physics, Sri Krishnadevaraya University, Anantapur - 515 003, A.P., India.


ABSTRACT

The present study focuses on the investigation of both near-surface and vertical variability of carbon monoxide (CO) concentrations and their potential sources obtained from both in situ and satellite Measurements of Pollution in the Troposphere (MOPITT) over a semiarid region (Anantapur, India) from January 2016 to December 2017. The diurnal variation of CO shows sharp morning (07:00-09:00 LT) and evening (07:00-09:00 LT) peaks associated to local anthropogenic activities as well as the impact of the mixed layer height, and low concentrations during daytime (12:00-15:00 LT). The low levels during afternoon hours may be due to the increase of the mixed layer height and the decrease of anthropogenic sources. The seasonal mean CO showed no obvious variation, with highest levels observed in winter (329 ± 52 ppbv), followed by the pre-monsoon (327 ± 57 ppbv), post-monsoon (234 ± 36 ppbv) and monsoon (192 ± 22 ppbv). The high levels of CO during the winter are attributed to increased emissions from anthropogenic sources and a shallow mixed layer height. The vertical distribution of CO showed secondary peaks at high-pressure levels (300-200 hPa) during winter, pre-monsoon, and post-monsoon, which indicates CO transport from different source regions. These findings are reasonably confirmed through the air mass Concentrated Weighted Trajectory (CWT) analysis obtained from the Hybrid Single Particle Lagrangian Integrated Trajectory (HYSPLIT) model. This study suggests that except for the monsoon, air masses transported from Indo-Gangetic Basin region also contribute to the enhancement of CO concentrations at the receptor site.

Keywords: carbon monoxide; MOPITT; HYSPLIT; semiarid

RESUMEN

El presente estudio se enfoca a la investigación de la variabilidad tanto vertical como cercana a la superficie de las concentraciones de monóxido carbono (CO), así como de sus fuentes potenciales, obtenidas tanto in situ como a partir de datos satelitales del instrumento MOPITT (Measurement of Pollution in the Troposphere) sobre una región semiárida (Anantapur, India), de enero de 2016 a diciembre de 2017. La variación diurna del CO muestra picos pronunciados durante la mañana (de 07:00 a 09:00 horas) y la tarde (de 19:00 a 21:00 horas) asociados con actividades antrópicas locales y el impacto de la altura de la capa de mezcla, así como bajas concentraciones en el día (12:00 a 15:00 horas). Los bajos niveles durante las horas de la tarde pueden deberse al incremento de la altura de la capa de mezcla y al decremento de las fuentes antrópicas. La media estacional del CO no mostró variaciones evidentes, con los niveles más altos observados durante el invierno (329 ± 52 ppbv), seguido por el premonzón (327 ± 57 ppbv), el postmonzón (234 ± 36 ppbv) y el monzón (192 ± 22 ppbv). Los niveles altos de CO observados durante el invierno se atribuyen a emisiones antrópicas y a la escasa altura de la capa de mezcla. La distribución vertical del CO mostró picos secundarios en presencia de niveles de presión altos (300-200 hPa) durante el invierno, el premonzón y el postmonzón, lo cual indica que hay transporte desde diferentes fuentes regionales. El análisis de la concentración ponderada de la trayectoria (CWT, por sus siglas en inglés) de la masa de aire, obtenida a partir del modelo HYSPLIT (Hybrid Single Particle Lagrangian Integrated Trajectory) confirma de manera razonable estos hallazgos. El presente estudio sugiere que, con excepción de la época del monzón, las masas de aire transportadas desde la región de la cuenca indogangética también contribuyen al incremento de las concentraciones de CO en el sitio receptor.

1. Introduction

Rapid industrial development and economic growth in South Asia has contributed to increasing emissions of trace gases and particulate matter in the atmosphere, which have a strong impact on both global and regional environment (Akimoto, 2003; Pozzer et al., 2012). The nature and extent of these emissions are employed to develop policies to mitigate their impact. Biomass and fossil fuel burning, as well as vehicular emissions are the most important sources for the formation of carbon monoxide (CO), though a lower amount of CO derives from the ocean and geological activity (Reddy et al., 2008). This gas indirectly contributes to global warming and also reduces the blood’s ability to carry oxygen to body organs. It is known as a precursor of ozone (O3) and is a source of CO2. In addition, CO is responsible for the direct surface emission and oxidation of hydrocarbons (Duncan et al., 2007). It can react chemically with other atmospheric constituents (primarily the hydroxyl radical, OH.) that would otherwise destroy methane. CO’s chemical lifetime is relatively short and spatially variable in concentration, depending on the OH concentrations (Lawrence et al., 2003).

Few studies of CO concentrations have been conducted in India by using in-situ techniques (Lal et al., 2000, 2012; Naja and Lal, 2002; Sahu et al., 2006; Beig et al., 2007; Mallik and Lal, 2014; Sarangi et al., 2014). Apart from real-time measurements, satellite studies have also been performed to study the dynamical effects and long-term trends of CO concentrations in the troposphere (Kar et al., 2004, 2008, 2010; Ghude et al., 2011; Kumar et al., 2013; Worden et al., 2013; Girach and Nair, 2014; Sheel et al., 2014; Yoon and Pozzer, 2014). For better understanding the variations of CO concentrations and their potential sources over a semiarid region, we analyzed CO data both in-situ and from the MOPITT instrument onboard the Terra satellite.

The main objective of the present study is to analyze the diurnal and seasonal variation of CO concentrations during the period 2016-2017. The vertical profiles of CO originating from the MOPITT instrument are examined during the study period. Source apportionment studies are also conducted with the help of the Moderate Resolution Imaging Spectroradiometer (MODIS) fire counts and the Hybrid Single Particle Lagrangian Integrated Trajectory (HYSPLIT) model for the identification of sources’ origins. Finally, a comparison study is carried out for CO in different parts of the Indian region.

2. Site description and instrumentation

2.1 Site description

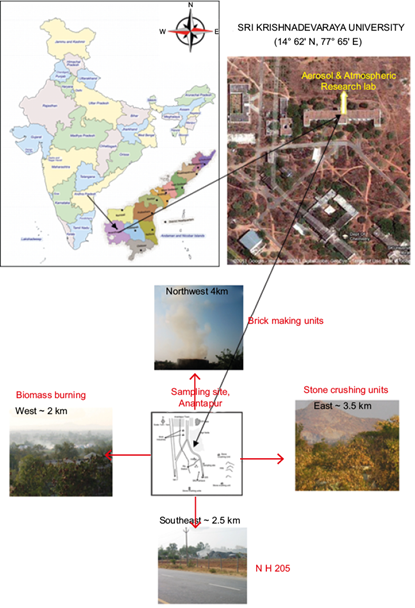
Anantapur is a very dry continental region which receives low precipitation throughout the year, with the greatest rainfall occurring during the monsoon (Reddy et al., 2016). The sampling site is surrounded by a number of cement plants, slab polishing, lime kilns, and brickworks; however, national highways NH 7 and NH 205 also constitute the largest sources of anthropogenic particles (Gopal et al., 2016). The climate is governed by monsoon-influenced marine weather systems. The entire study period is divided into four seasons: winter (December-February), pre-monsoon (March-May), monsoon (June-August), and post-monsoon (September-November). The real-time near-surface CO concentration levels were measured at the Department of Physics, Sri Krishnadevaraya University (SKU, 14.62º N, 77.65º E, 331 masl), located at the southern edge of Anantapur city (Fig. 1).

Fig. 1 Location of the Sri Krishnadevaraya University campus area in Anantapur. The monitoring site-building in the SK University campus is indicated with an arrowhead in the satellite aerial view. 

2.2 Near-surface CO

Near-surface CO concentrations are continuously monitored using the CO monitor analyzer (APMA-370, Horiba, Germany). The analyzer worked adequately based on the principle of non-dispersive infrared absorption. It uses the AS-type detector from which extremely high-accurate results were obtained without any interference components. The performance, efficiency, accuracy, calibration and advantages of analyzers have been described elsewhere (Reddy et al., 2008). However, when the concentration of the interference gas changes (since there is a time gap for the sample and reference gases to reach the measurement cell) an influence due to the interference gas may occur. In order to address this problem (such as a change in the interference gas concentration) APMA-370 measures the concentration of the interference gas component with an interference compensation detector and corrects its influence on the output signal of the measurement detector. To reduce uncertainty in thr levels, the filter was replaced every 3-4 weeks, and calibration was performed at regular intervals. The CO analyzer was zero calibrated with zero air generator, and span calibration was performed with the help of a multipoint calibrator. The linearity of the instrument was checked with an internal zero gas and five NIST traceable CO standards (60, 250, 300, 500, and 1000 ppb). In addition, daily instrument checks were performed using a 500 ppb CO standard and zero internal gas.

2.3 MOPITT

The vertical distribution of CO mixing ratios was obtained from the Measurements of Pollution in the Troposphere (MOPITT) level 3, version 8 instrument, which is aboard the EOS Terra satellite and has a horizontal spatial resolution of 22 × 22 km and a track swath of 640 km. Daytime data products are archived on a 1º × 1º latitude-longitude grid in different pressure levels (900, 800, 700, 600, 500, 400, 300, 200, and 100 mb). More details about the retrieval algorithm and validation are available in Pan et al. (1995) and Emmons et al. (2010).

2.4 Aethalometer

Real-time measurements of the black carbon (BC) mass concentration were collected using a seven-wavelength Aethalometer (AE 42, Magee Scientific, USA). BC was collected continuously (time resolution of 5 min) from January 2016 to December 2017. The aethalometer measures optical attenuation due to particles deposited on a quartz filter (filter-based technique) at seven wavelengths: 370, 470, 520, 590, 660, 880, and 950 nm, with flow rate maintained at 3 LPM. The BC measured at 880 nm is considered as the standard, since BC is the principal light absorber at that wavelength. More details about the uncertainty in the estimation of BC mass concentration with an Aethalometer and correction factors were well documented by Hansen et al. (1984) and Weingartner et al. (2003).

2.5 Concentration weighted trajectory (CWT) analysis and MODIS fire counts

Concentration Weighted Trajectory (CWT) analysis was performed to identify the relative contribution of potential source regions to CO levels (Nazeer et al., 2018; Kalluri et al., 2019, 2020a). Many researchers have also used HYSPLIT to identify the pollution transport process in different regions. In the CWT technique, trajectories reaching over the study site are weighted based on the mean concentration measured at the location during the arrival of the trajectory. In this technique, each grid cell is assigned a concentration obtained by averaging associated concentrations that crossed the grid cell:

Cij=1l=1Mτijll=1MClτijl

where Cij is the average weighted concentration in the ij th cell, l is the index of the trajectory, M is the total number of trajectories, Cl is the concentration observed in the trajectory endpoint, and τijl is the time spent in the ij th cell by the trajectory l (Seibert et al., 1994). The fire-count data was obtained from the Fire Information for Resource Management System (FIRMS, http://firms.modaps.eosdis.nasa.gov/firemap/). MODIS provides fire information based on a brightness temperature algorithm at the 4- and 11-mm channels. Confidence levels ranging from 0 to 100%, were used to assign one of three fire classes to all the fire pixels. Further details about the principle and retrieval algorithm are available in Giglio et al. (2003). In the present study, data with high confidence (> 80%) was considered.

3. Results and discussion

3.1 Diurnal and monthly variation of CO

The observed diurnal variation of CO is characterized by two peaks during the morning (07:00-09:00 LT) and night hours (21:00-23:00 LT). Low concentrations are noticed during daytime (12:00-15:00 LT) (Fig. 2). The diurnal variation of CO shows a predominant peak during the morning as compared to the evening, which may be due to variations in the mixed layer height and anthropogenic sources. In contrast, during the evening, traffic emissions remain almost the same, but the mixed layer height decreases, which results in higher CO concentrations. During the night, CO levels showed little variation in comparison to daytime. The diurnal variation with low concentration during the afternoon could partly be affected by lower anthropogenic activities, photooxidation processes, and a high mixed layer height. A similar diurnal variation of CO was found in other regions of India, such as Ahmadabad (Lal et al., 2000), Chile (Rappengluck et al., 2005), Pune (Beig et al., 2007), Kanpur (Gaur et al., 2014), Agra (Verma et al., 2017), and Kathmandu valley (Bhardwaj et al., 2018).

Fig. 2 Contour plot of diurnal and monthly variations of CO concentrations over Anantapur. 

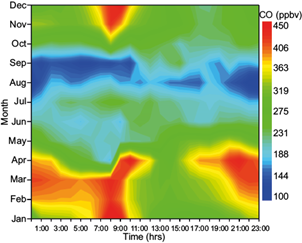
The in-situ measured CO surface levels have no obvious seasonal variability. Monthly mean maximum and minimum of CO were noted in March (324 ± 59 ppbv) and August (155 ± 28 ppbv). The monthly maximum CO concentration was observed in March, on account of anthropogenic emissions from agricultural fields (north) close to the measurement site. Crop residues are burned by farmers to clear agricultural fields to enhance the next crops yield, which contributes to a higher amount of CO (Dalvi et al., 2006). The seasonal variation of CO showed its highest levels in winter (329 ± 52 ppbv) followed by pre-monsoon (327 ± 57 ppbv), post-monsoon (234 ± 36 ppbv) and monsoon (192 ± 22 ppbv). The highest levels of CO during winter may be attributed to: (1) weak photochemical removal, (2) an increase in local emission sources, and (3) low wind speeds that cause entrapment of pollutants near the surface. The lowest concentration was observed during the monsoon season due to winds blowing from the Arabian Sea.

3.2 Vertical variability of CO retrieved from MOPITT and synoptic meteorology

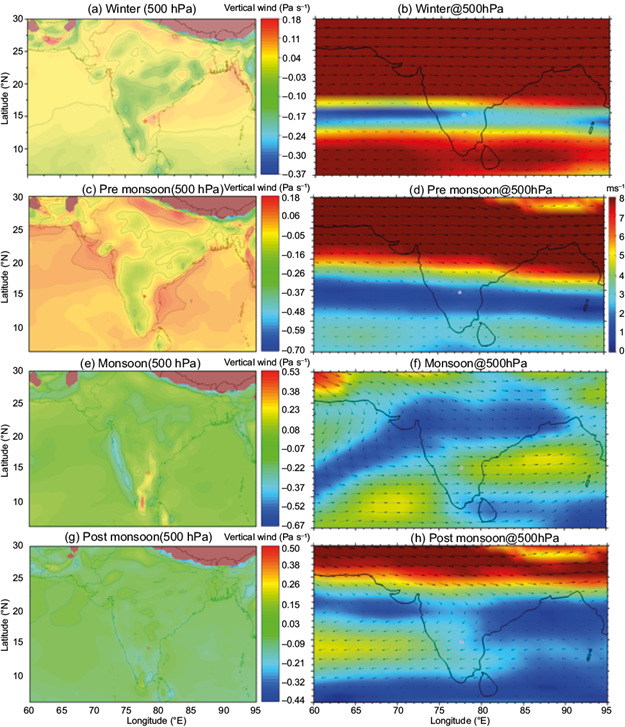
Figure 3 shows the vertical distribution of CO mixing ratios in different months retrieved from the MOPITT instrument over Anantapur. In general, the CO mixing ratio decreases with height from 1000 to 100 hPa; however, the surface CO mixing ratio was stronger at lower altitudes in all months. CO exhibits distinct seasonal variations near the surface (1000 hpa) with highest levels during the pre-monsoon (244 ± 37 ppbv) and lowest in the monsoon (134 ± 10 ppbv). The pattern of seasonal variation at low altitudes (1000 hPa) observed by MOPITT was consistent with ground-level measurements. However, at low pressure levels (low pressure corresponds to a higher altitude), CO mixing ratios were found to be low during the monsoon due to washout processes, air masses originating from the Arabian Sea and less human activity. During the pre-monsoon, numerous fires spotted in central India were identified by MODIS. The continental air masses dominated during winter and pre-monsoon, resulting in higher CO concentrations at high altitudes (200 hpa). Vertical wind distribution an important cause of the vertical mixing of CO in the upper troposphere. Figures 4 and 5 represent the seasonal vertical wind and horizontal wind circulation at 850 and 500 hPa over the observational site, obtained from the European Centre for Medium-Range Weather Forecasts (ECMWF)-interim reanalysis and Modern-Era Retrospective Analysis For Research And Applications (MERRA) data during 2016-2017. The color bar in the figures represents wind speed, and the arrow indicates the wind direction and the white square indicates the observation site. The wind during winter, pre-monsoon and post-monsoon at 850 hpa was originated from the northwest and passed through central India before reaching the observation site. The northwestern winds are responsible for the transport of CO from urban locations in central India. During the post-monsoon, a synoptic wind pattern originated from the central Indo-Gangetic Basin (IGB), which is due to an additional source of CO mixing ratios observed at low pressure levels over the measurement location. During the monsoon, season winds generally originate from the Arabian Sea and low anthropogenic activities, which are responsible for low CO mixing ratios over the measurement location. Figures 4 and 5 show that the observed CO concentration at high altitudes during winter and the post-monsoon is attributed to the vertical transport of surface level CO in the mid and upper troposphere. This is due to the fact that vertical velocities are negative and much weaker (downward motion) during winter and the post-monsoon seasons over the observational site, as seen in Figure 4a, g.

Fig. 3 Monthly variation of MOPITT retrieved CO profiles over the measurement location. 

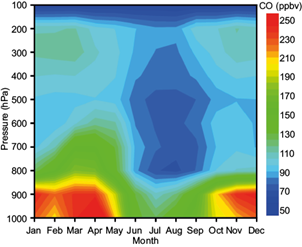
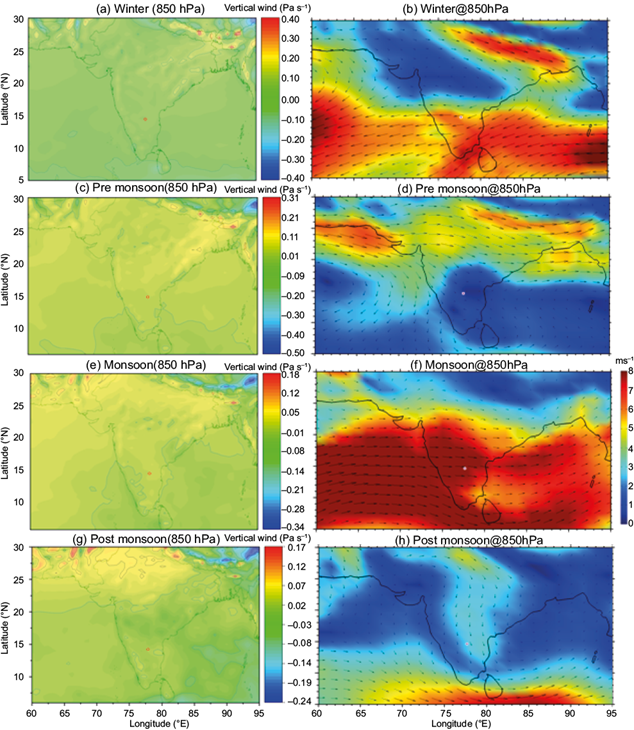
Fig. 4 Seasonal variation of vertical and horizontal winds at 850 hPA. The left panel indicates vertical velocities (Pa s-1), while the right panel indicates horizontal winds (m s-1) and the circle shows the measurement location. 

Fig. 5 Same as Figure 4, but for 500 hPa. 

3.3 Relation between BC and CO

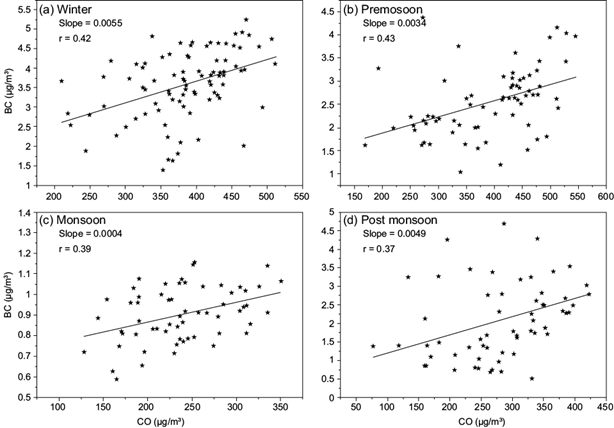
BC and CO are a result of the combustion of fossil fuel and biomass burning, and they have a relatively long atmospheric lifetime. Both are inert chemically in a timeframe of a few hours, thus, chemical reactions are not expected to change their concentrations during air mass transport between emission sources and measurement sites (Baumgardner et al., 2002). The scatter plots of BC and CO for different seasons are shown in Figure 6a-d. The correlation coefficient between CO and BC was found to be 0.42,0.43,0.39,0.37 for winter, pre-monsoon, monsoon and post-monsoon, respectively. The moderate correlation between CO and BC was influenced both by emissions from local activities and transport over the observation site. As suggested by previous studies (Kalluri et al., 2017, 2020b; Gopal et al., 2014, 2017) long-range transport could be an important source of absorbing aerosols (except during the monsoon) over the measurement location.

Fig. 6 Scatter plot of the relation between black carbon and CO for (a) winter, (b) pre-monsoon, (c) monsoon, and (d) pos-monsoon. 

3.4. Source apportionment and MODIS fire counts

In order to identify the CO transport pathways, isentropic CWT cluster analysis was derived based on air mass back-trajectories data at an altitude of 500 m above the ground level using the HYSPLIT model and the MODIS Fire Mapper products to give an idea about the location and extent of fires for the entire period (Figs. 7 and 8) (Draxler et al., 1997). Local sources contribute actively to the measured CO, whereas polluted air originated from upwind high industrialized regions also play a part in the enhancement of CO as is evident from the observed trajectories during winter (Fig. 8a).

Fig. 7 MODIS cloud-corrected fire counts in different seasons during the study period. 

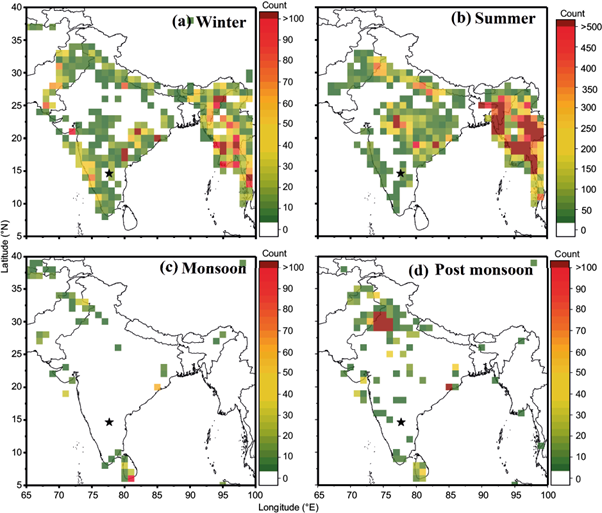
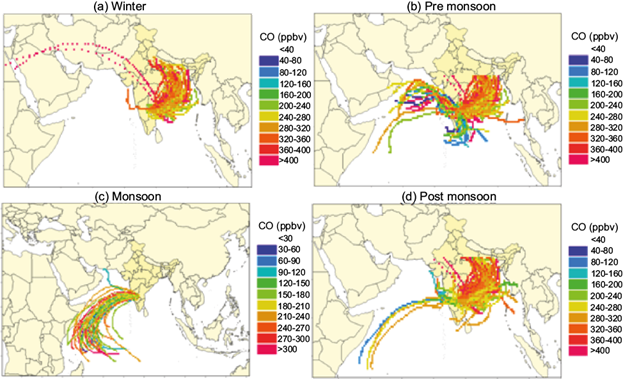
Fig. 8 Five-day isentropic HYSPLIT back-trajectories reaching over the study location in different seasons during the study period. 

Furthermore, a widespread of active fires was observed by MODIS in areas of the northeastern regions compared to other regions during the pre-monsoon, indicating the significant influence of biomass burning in the production of CO and its concentration levels in the troposphere (Figs. 7b and 8b). A similar condition occurs during the post-monsoon, although less fires befall over the IGB region, and most of the anthropogenic particles are removed by the washout process triggered by the southwest monsoon over the measurement location (Kalluri et al., 2016, 2017). During the monsoon, winds originate from the Arabian Sea and pollution from anthropogenic activities is removed by the washout process (Fig. 8c).

3.5. Comparison with other sites in India

It is interesting to compare our results with those obtained in other Indian regions (Table I). It can be seen that CO concentrations over the study region were greater than in a high altitude location (Nainital) and a rural location (Gadanki). However, it can also be noticed that CO concentration levels over polluted urban locations (Dehli, Agra, Kanpur) are more than twice compared with the present study location. Furthermore, the seasonal variation of CO levels at the study site and Udaipur was almost similar except for the post-monsoon. A large difference was observed in both regions during the post-monsoon due to s change in the direction of air masses. However, CO levels at the measuring site were higher than in Udaipur since in the latter farmers burned crop residues from agriculture activities.

Table I Comparison of CO concentration levels over Anantapur with those reported from a other locations in India. 

Station Period Concentration (ppbv) Reference
New Delhi 2000-2009 2940 ± 1729 Chelani, 2012
Delhi Jan 2013-Dec 2014 2500 ± 400 (PoM), 2500 ± 300(W), 2400 ± 800 (M) Tyagi et al., 2016
Agra Nov 2003-Feb 2005 710 ± 159.4 Renuka et al., 2008
Kanpur Jun 2009-May 2013 721 ± 403 Gaur, 2014
Ahmedabad 2002 385 ± 200 Sahu et al., 2006
Gadanki 1993-1996 237 ± 64 Naja and Lal, 2002
Nainital 2009-2011 174 ± 108 Sarangi et al., 2014
Udaipur 2010-2011 462 ± 85 (W), 297 ±64 (PM), 252 ± 52 (M), 37 ± 58 (PoM) Yadav et al., 2014
Anantapur Jan 2016-Dec 2017 329 ± 52 (W), 327 ± 57 (PM), 234 ±36 (M), 192 ± 22 (PoM) Present study
Kathmandu Valley Dec 2012-June 2013 500 ± 230 Mahata et al., 2017
Agra Mar 2015 - Feb 2016 770 ± 466 ppb (W), 466 ± 301 (PoM) 232 ± 223 (PM), 153 ± 122 (M) Verma et al., 2017

W: winter; PM: pre-monsoon; M: monsoon; PoM: post-monsoon.

4. Conclusions

In this study we presented a comprehensive analysis of CO concentrations using in-situ and MOPITT satellite observations from January 2016 to December 2017 over a semi-arid region in India (Anantapur). The important findings of the present study are summarized as follows:

  • The seasonal mean variation of in-situ measured CO concentrations was highest (329 ± 52 ppbv) during the winter and lowest (192 ± 22 ppbv) during the monsoon.

  • Continental air masses dominated during winter and pre-monsoon, resulting in secondary peaks of CO concentrations at high altitudes (200 hpa).

  • The moderate correlation between CO and BC is noticed at the observation site, where measurements were influenced by emissions from various sources.

The CWT analysis obtained from HYSPLIT suggests that except for the monsoon, air masses transported from central parts of India and the IGB region play a vital role in enhancing concentration levels at the receptor site.

Acknowledgment

The authors wish to thank the Indian Space Research Organization (ISRO), Bangalore, for carrying out this work through its Geosphere-Biosphere Programme (GBP) under the AT-CTM and ARFI project. We gratefully acknowledge the NOAA Air Resources Laboratory (ARL) and MOPITT for the provision of the HYSPLIT transport dispersion model used in this publication.

References

Akimoto H. 2003. Global air quality and pollution. Science 302: 1716-1719. https://doi.org/10.1126/science.1092666 [ Links ]

Baumgardner D, Raga G, Peralta O, Rosas I, Castro T, Kuhlbusch T, John A, Petzold A. 2002. Diagnosing black carbon trends in large urban areas using carbon monoxide measurements. Journal of Geophysical Research: Atmospheres 107: ICC 4-1-ICC 4-9. https://doi.org/10.1029/2001jd000626 [ Links ]

Beig G, Gunthe S, Jadhav DB. 2007. Simultaneous measurements of ozone and its precursors on a diurnal scale at a semi urban site in India. Journal of Atmospheric Chemistry 57: 239-253. https://doi.org/10.1007/s10874-007-9068-8 [ Links ]

Bhardwaj P, Naja M, Rupakheti M, Lupascu A, Mues A, Panday AK, Rajesh K, Mahata KS, Shyam L, Harish CC, Lawrence MG. 2018. Variations in surface ozone and carbon monoxide in the Kathmandu Valley and surrounding broader regions during SusKat-ABC field campaign: role of local and regional sources. Atmospheric Chemistry and Physics 18: 11949-11971. https://doi.org/10.5194/acp-18-11949-2018 [ Links ]

Chelani AB. 2012. Persistence analysis of extreme CO, NO2 and O3 concentrations in ambient air of Delhi. Atmospheric Research 108: 128-134. https://doi.org/10.1016/j.atmosres.2012.02.001 [ Links ]

Dalvi M, Beig G, Patil U, Kaginalkar A, Sharma C, Mitra AP. 2006. A GIS based methodology for gridding of large-scale emission inventories: Application to carbon-monoxide emissions over Indian region. Atmospheric Environment 40: 2995-3007. https://doi.org/10.1016/j.atmosenv.2006.01.013 [ Links ]

Draxler RR, Hess GD. 1997. Description of the HYSPLIT-4 modeling system. NOAA Technical memorandum ERL ARL-224. NOAA Air Resources Laboratory, Silver Spring, MD, USA. [ Links ]

Duncan BN, Logan JA, Bey I, Megretskaia IA, Yantosca RM, Novelli PC, Jones NB, Rinsland CP. 2007. Global budget of CO, 1988-1997: Source estimates and validation with a global model. Journal of Geophysical Research: Atmospheres 112: D22. https://doi.org/10.1029/2007jd008459 [ Links ]

Emmons LK, Walters S, Hess PG, Lamarque JF, Pfister GG, Fillmore D, Granier C, Guenther A, Kinnison D, Laepple T, Orlando J, Tie X, Tyndall G, Wiedinmyer C, Baughcum SL, Kloster S. 2010. Description and evaluation of the Model for Ozone and Related Chemical Tracers, version 4 (MOZART-4). Geoscientific Model Development 3: 43-67. https://doi.org/10.5194/gmd-3-43-2010 [ Links ]

Gaur A, Tripathi SN, Kanawade VP, Tare V, Shukla SP. 2014. Four-year measurements of trace gases (SO2, NOx, CO, and O3) at an urban location, Kanpur, in Northern India. Journal of Atmospheric Chemistry 71: 283-301. https://doi.org/10.1007/s10874-014-9295-8 [ Links ]

Ghude SD, Beig G, Kulkarni PS, Kanawade VP, Fadnavis S, Remedios JJ, Kulkarni SH. 2011. Regional CO pollution over the Indian-subcontinent and various transport pathways as observed by MOPITT. International Journal of Remote Sensing 32: 6133-6148. https://doi.org/10.1080/01431161.2010.507796 [ Links ]

Giglio L, Descloitres J, Justice CO, Kaufman YJ. 2003. An enhanced contextual fire detection algorithm for MODIS. Remote Sensing of Environment 87: 273-282. https://doi.org/10.1016/s0034-4257(03)00184-6 [ Links ]

Girach IA, Nair PR. 2014. Carbon monoxide over Indian region as observed by MOPITT. Atmospheric Environment 99: 599-609. https://doi.org/10.1016/j.atmosenv.2014.10.019 [ Links ]

Girach IA, Nair PR. 2014. On the vertical distribution of carbon monoxide over Bay of Bengal during winter: Role of water vapour and vertical updrafts. Journal of Atmospheric and Solar-Terrestrial Physics 117: 31-47. https://doi.org/10.1016/j.jastp.2014.05.003 [ Links ]

Gopal KR, Arafath SM, Lingaswamy AP, Balakrishnaiah G, Pavan Kumari S, Uma Devi K, Siva Kumar Reddy N, Raja Obul Reddy K, Penchal Reddy M, Reddy RR, Suresh Babu S. 2014. In-situ measurements of atmospheric aerosols by using Integrating Nephelometer over a semi-arid station, southern India. Atmospheric Environment 86: 228-240. https://doi.org/10.1016/j.atmosenv.2013.12.009 [ Links ]

Gopal RK, Reddy ORK, Balakrishnaiah G, Arafath SM, Reddy KSN, Rao TC, Reddy LT, Reddy RR. 2016. Regional trends of aerosol optical depth and their impact on cloud properties over Southern India using MODIS data. Journal of Atmospheric and Solar-Terrestrial Physics 146: 38-48. https://doi.org/10.1016/j.jastp.2016.05.005 [ Links ]

Gopal RK, Balakrishnaiah G, Arafath SM, Raja Obul Reddy K, Siva Kumar Reddy N, Pavan Kumari S, Mallikarjuna Reddy P. 2017. Measurements of scattering and absorption properties of surface aerosols at a semi-arid site, Anantapur. Atmospheric Research 183: 84-93. https://doi.org/10.1016/j.atmosres.2016.08.016 [ Links ]

Hansen ADA, Rosen H, Novakov T. 1984. The aethalometer - An instrument for the real-time measurement of optical absorption by aerosol particles. Science of the Total Environment 36: 191-196. https://doi.org/10.1016/0048-9697(84)90265-1 [ Links ]

Kalluri ROR, Gugamsetty B, Kotalo RG, Nagireddy SKR, Tandule CR, Thotli LR, Ramakrishna RR, Surendranair SB. 2016. Direct radiative forcing properties of atmospheric aerosols over semi-arid region, Anantapur in India. Science of the Total Environment 566: 1002-1013. https://doi.org/10.1016/j.scitotenv.2016.05.056 [ Links ]

Kalluri ROR, Balakrishnaiah G, Rama Gopal K, Reddy KSN, ChakradharRao T, Lokeswara Reddy T, Nazeer Hussain S, Reddy VM, Reddy RR, Babu SS. 2017. Seasonal variation of near surface black carbon and satellite derived vertical distribution of aerosols over a semi-arid station in India. Atmospheric Research 184: 77-87. https://doi.org/10.1016/j.atmosres.2016.09.003 [ Links ]

Kalluri ROR, Xiaoyu Z, Lei B. 2019. Seasonal aerosol variations over a coastal city, Zhoushan, China from CALIPSO observations. Atmospheric Research 218: 117-128. https://doi.org/10.1016/j.atmosres.2018.11.011 [ Links ]

Kalluri ROR, Xiaoyu Z, Lei B, Jiyao Z, Le Y, Rama Gopal K. 2020a. Carbonaceous aerosol emission reduction over Shandong province and the impact of air pollution control as observed from synthetic satellite data. Atmospheric Environment 222: 117150. https://doi.org/10.1016/j.atmosenv.2019.117150 [ Links ]

Kalluri ROR, Gugamsetty B, Kotalo RG, Thotli LR, Tandule CR, Akkiraju B. 2020b. Long-term (2008-2017) analysis of atmospheric composite aerosol and black carbon radiative forcing over a semi-arid region in southern India: Model results and ground measurement. Atmospheric Environment 240: 117840. https://doi.org/10.1016/j.atmosenv.2020.117840 [ Links ]

Kar J, Bremer H, Drummond JR, Rochon YJ, Jones DBA, Nichitiu F, Zou J, Liu J, Gille JC, Edwards DP, Deeter MN, Francis G, Ziskin D, Warner J. 2004. Evidence of vertical transport of carbon monoxide from Measurements of Pollution in the Troposphere (MOPITT). Geophysical Research Letters 31: L23105. https://doi.org/10.1029/2004gl021128 [ Links ]

Kar J, Jones DBA, Drummond JR, Attie JL, Liu J, Zou J, Nichitiu F, Seymour MD, Edwards DP, Deeter MN, Gille JC, Richter A. 2008. Measurement of low-altitude CO over the Indian subcontinent by MOPITT. Journal of Geophysical Research: Atmospheres 113: D16. https://doi.org/10.1029/2007JD009362 [ Links ]

Kar J, Deeter MN, Fishman J, Liu Z, Omar A, Creilson JK, Trepte CR, Vaughan MA, Winker DM. 2010. Wintertime pollution over the Eastern Indo- Gangetic Plains as observed from MOPITT, CALIPSO and tropospheric ozone residual data. Atmospheric Chemistry and Physics 10: 12273-12283. https://doi.org/10.5194/acp-10-12273 [ Links ]

Kumar R, Naja M, Pfister GG, Barth M.C, Brasseur GP. 2013. Source attribution of carbon monoxide in India and surrounding regions during wintertime. Journal of Geophysical Research: Atmospheres 118: 1981-1995. https://doi.org/10.1002/Jgrd.50134 [ Links ]

Lal S, Naja M, Subbaraya B. 2000. Seasonal variations in surface ozone and its precursors over an urban site in India. Atmospheric Environment 34: 2713-2724. https://doi.org/10.1016/S1352-2310(99)00510-5 [ Links ]

Lal S, Sahu LK, Venkataramani S, Mallik C. 2012. Light non-methane hydrocarbons at two sites in the Indo-Gangetic Plain. J. Environ. Monit. 14: 1159. https://doi.org/10.1039/c2em10682 [ Links ]

Lawrence MG, Rasch PJ, von Kuhlmann R, Williams J, Fischer H, de Reus M, Lelieveld J, Crutzen PJ, Schultz M, Stier P, Huntrieser H, Heland J, Stohl A, Forster C, Elbern H, Jakobs H, Dickerson RR. 2003. Global chemical weather forecasts for field campaign planning: predictions and observations of largescale features during MINOS, CONTRACE, and INDOEX. Atmospheric Chemistry and Physics 3: 267-289. https://doi.org/10.5194/acp-3-267-2003 [ Links ]

Mahata KS, Panday AK, Rupakheti M, Singh A, Naja M, Lawrence MG. 2017. Seasonal and diurnal variations in methane and carbon dioxide in the Kathmandu Valley in the foothills of the central Himalayas. Atmospheric Chemistry and Physics 17: 12573-12596. https://doi.org/10.5194/acp-17-12573-2017 [ Links ]

Mallik C, Lal S. 2013. Seasonal characteristics of SO2, NO2, and CO emissions in and around the Indo-Gangetic plain. Environ. Monit. Assess. 186: 1295-1310. https://doi.org/10.1007/s10661-013-3458-y [ Links ]

Naja M, Lal S., 2002. Surface ozone and precursor gases at Gadanki (13.5 N, 79.2 E), a tropical rural site in India. Journal of Geophysical Research: Atmospheres 107: 4197. https://doi.org/10.1029/2001JD000357 [ Links ]

Nazeer Hussain S, Chakradhar Rao T, Balakrishnaiah G, Rama Gopal K, Raja Obul Reddy K, Siva Kumar Reddy N, Lokeswara Reddy T, Pavan Kumari S, Ramanjaneya Reddy P, Ramakrishna Reddy R. 2018. Investigation of black carbon aerosols and their characteristics over tropical urban and semi-arid rural environments in peninsular India. Journal of Atmospheric and Solar-Terrestrial Physics 167: 48-57. https://doi.org/10.1016/j.jastp.2017.10.010 [ Links ]

Pan WL, Camberato JJ, Moll RH, Kamprath EJ, Jackson WA. 1995. Altering Source-Sink Relationships in Prolific Maize Hybrids: Consequences for Nitrogen Uptake and Remobilization. Crop Science 35: 3, 836. https://doi.org/10.2135/cropsci1995.0011183x00350003003 [ Links ]

Pozzer A, Zimmermann P, Doering UM, van Aardenne J, Tost H, Dentener F, Janssens Maenhout G, Lelieveld J. 2012. Effects of business-as-usual anthropogenic emissions on air quality. Journal of Atmospheric and Solar-Terrestrial Physics 12: 6915-6937. https://doi.org/10.5194/acp-12-6915-2012 [ Links ]

Rappengluck B, Schmitz R, Bauerfeind M, Cereceda-Balic F, Baer D, Jorquera H, Silva Y, Oyola P. 2005. An urban photochemistry study in Santiago de Chile. Atmospheric Environment 39: 2913-2931. https://doi.org/10.1016/j.atmosenv.2004.12.049 [ Links ]

Reddy RR, Gopal KR, Narasimhulu K, Reddy LSS, Kumar KR, Ahammed YN, Azeem PA. 2008. Diurnal and seasonal variabilities in surface ozone and its precursor gases at a semi-arid site Anantapur (14.62°N, 77.65°E, 331 m asl) in India. Int. J. Environ. Sci. Tech. 65: 247-265. https://doi.org/10.1080/00207230701844379 [ Links ]

Reddy KRO, Balakrishnaiah G, Gopal K, Reddy NSK, Chakradhar Rao T, Reddy LT, Hussain NS, Reddy MV, Reddy RR, Boreddy SKR, Babu S. 2016. Long term (2007 - 2013) observations of columnar aerosol optical properties and retrieved size distributions over Anantapur, India using Multi Wavelength solar Radiometer. Atmospheric Environment 142: 238-250. https://doi.org/10.1016/j.atmosenv.2016.07.047 [ Links ]

Renuka S, Satsangi GS, Ajay T. 2008. Concentration of surface O3, NO2 and CO during winter season at a semi-arid region-Agra. India. Indian J. Radio Space Phys. 37: 121-130. https://doi.org/10.1007/s10874-014-9295-8 [ Links ]

Sahu LK, Lal S, Venkataramani S. 2006. Distributions of O3, CO and hydrocarbons over the Bay of Bengal: A study to assess the role of transport from southern India and marine regions during September-October 2002. Atmospheric Environment 40: 4633-4645. https://doi.org/10.1016/j.atmosenv.2006.02.037 [ Links ]

Sarangi T, Naja M, Ojha N, Kumar R, Lal S, Venkataramani S, Kumar A, Sagar R, Chandola HC. 2014. First simultaneous measurements of ozone, CO, and NOyat a high-altitude regional representative site in the central Himalayas. Journal of Geophysical Research: Atmospheres 119: 1592-1611. https://doi.org/10.1002/2013jd020631 [ Links ]

Seibert P, Kromp-Kolb H, Baltensperger U, Jost DT, Schwikowski M. 1994. Trajectory analysis of high-Alpine air pollution data. In: Air pollution modeling and its application X (Gryning SE, Millán MM, Eds.). Springer, Boston, MA (NATO Challenges of Modern Society, vol 18). https://doi.org/10.1007/978-1-4615-1817-4_65 [ Links ]

Sheel V, Sahu LK, Kajino M, Deushi M, Stein O, Nedelec P. 2014. Seasonal and interannual variability of carbon monoxide based on MOZAIC observations, MACC reanalysis, and model simulations over an urban site in India. Journal of Geophysical Research: Atmospheres 119: 9123-9141. https://doi.org/10.1002/2013jd021425 [ Links ]

Tyagi S, Tiwari S, Mishra A, Hopke PK, Attri SD, Srivastava AK, Bisht DS. 2016. Spatial variability of concentrations of gaseous pollutants across the National Capital Region of Delhi, India. Atmospheric Pollution Research 7: 808-816. https://doi.org/10.1016/j.apr.2016.04.008 [ Links ]

Verma N, Satsangi A, Lakhani A, Kumari KM, Lal S. 2017. Diurnal, Seasonal, and Vertical Variability in Carbon Monoxide Levels at a Semi-Urban Site in India. Clean Soil, Air, Water 45: 1600432. https://doi.org/10.1002/clen.201600432 [ Links ]

Weingartner E, Saathoff H, Schnaiter M, Streit N, Bitnar B, Baltensperger U. 2003. Absorption of light by soot particles: determination of the absorption coefficient by means of aethalometers. Journal of Aerosol Science 34: 1445-1463. https://doi.org/10.1016/s0021-8502(03)00359-8 [ Links ]

Worden HM, Deeter MN, Frankenberg C, George M, Nichitiu F, Worden J, Aben I, Bowman KW, Clerbaux C, Coheur PF, de Laat ATJ, Detweiler R, Drummond JR, Edwards DP, Gille JC, Hurtmans D, Luo M, Martínez Alonso S, Massie S, Pfister G, Warner JX. 2013. Decadal record of satellite carbon monoxide observations. Atmospheric Chemistry and Physics 13: 837-850. https://doi.org/10.5194/acp-13-837-2013 [ Links ]

Yadav R, Sahu LK, Jaaffrey SNA, Beig G. 2014. Temporal variation of particulate matter (PM) and potential sources at an urban site of Udaipur in Western India. Aerosol and Air Quality Research 14: 1613-1629. https://doi.org/10.4209/aaqr.2013.10.0310 [ Links ]

Yoon J, Pozzer A. 2014. Model- Simulated trend of surface carbon monoxide for the 2001-2010 decade. Atmospheric Chemistry and Physics 14: 10465-10482. https://doi.org/10.5194/acp-14-10465-2014 [ Links ]

Received: December 23, 2019; Accepted: October 23, 2020

* Corresponding author:email: krgverma@yahoo.com

Creative Commons License This is an open-access article distributed under the terms of the Creative Commons Attribution License