


 nueva página del texto (beta)
 Inglés (pdf)
 Artículo en XML
 Referencias del artículo
 Enviar artículo por email
 Citado por SciELO
  Similares en
SciELO
Similares en
SciELO 
 Permalink
1. Introduction
Most Greek meteorological researchers have published something about the Etesian winds. After so many years of intensive research, it might be expected that all the secrets associated with the physical mechanisms responsible for these winds, along with the interaction of its various scales of wave disturbances, would have been revealed. Indeed, much has been discovered about the Etesian winds by previous studies. Researchers from Greece, Israel and elsewhere have nowadays used modern tools, such as computer models and fine-mess gridded data, to enhance the understanding of the physical processes affecting the Etesian winds. However, a few aspects of the Etesian winds have not yet been fully explained, resulting in misunderstandings amongst the meteorologists, and this has led to different ways of treating the data and carrying out investigations.
Numerous papers have been published about the Etesian winds, which are reviewed here including older bibliography. Most of the papers published in the last 20 years are cited. The author’s personal view of the problem of Etesian winds is based on many years as a weather forecaster-researcher who, amongst many others, has attempted to give a physical interpretation of a variety of characteristics of Etesian winds that have not yet fully explained.
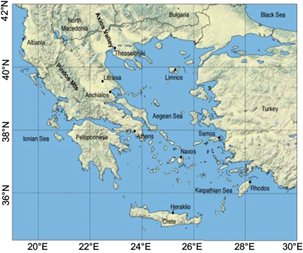
Etesian winds over the eastern Greek Seas, which extend with less intensity to the western Greek Seas (Fig. 1) (Carapiperis, 1970), have been well known since antiquity, when history is confused with mythology. It was believed that Aristaeus, the rustic god of shepherds and many others, was also the rustic god of the Etesian winds, and that he created these winds to provide some respite from the scorching heatwaves of the Greek summer (http://www.theoi.com/georgikos/aristaios.html).
Etesian winds during the historical period are discussed by Livadas (1974) and Mariolopoulos (1972). Greek weather forecasters consider Etesian winds as a meteorological phenomenon of enormous importance because they dramatically influence the life of the Greek population, especially those living on the islands in the Aegean Sea and the tourists who spend their summer vacations on the islands. Greek forecasters treat the Etesian winds as a synoptic-scale atmospheric circulation system which is also affected by unavoidable smaller-scale physical processes. Here we emphasize that the background circulation being established over the Eastern Mediterranean during the warm months is a result of the interaction of almost all scales of atmospheric processes.
After Metaxas (1970) and Prezerakos (1975), this paper is the third one considering the Etesian winds as a synoptic-scale atmospheric circulation system. This approach allows the accurate prediction of the Etesian winds by the Greek National Meteorological Center, which constitutes the weather forecasting department of the Hellenic National Meteorological Service (HNMS). For many years, Greek weather forecasters, accessing products from the European Centre for Medium-Range Weather Forecasts (ECMWF) and the Consortium for Small-scale Modeling (COSMO), have rarely failed to predict the Etesian winds.
1.1 The concept of Etesian wind types
1.1.1 Dominant atmospheric circulations
During the summer, the dominant upper troposphere atmospheric circulation in the vicinity of the Greek region is the Subtropical Jet Stream (SJS). Its mean location is between the southernmost Greek mainland and the island of Crete at a height above 200 hPa and just below the subtropical tropopause. The SJS migrates northwards, especially in cases of warm invasions, up to the northern Balkans. North of the Balkans another important atmospheric circulation system is the Polar Jet Stream (PJS). This jet is created by the interaction of polar and mid-latitude air masses at a height of about 300 hPa (thermal wind - baroclinicity - available potential energy). Also, the PJS is closely related to the Rossby waves which, in conjunction with their corresponding surface pressure systems, cause the eddy available potential energy to be converted to eddy kinetic energy that sustains the PJS. As the PJS moves eastwards it waves up-down and north-south with a low warm tropopause trough below 300 hPa and a high cold tropopause ridge above 300 hPa (Prezerakos, 1998). The subtropical Azores’ anticyclone at the surface, which is almost permanent over the western Mediterranean and occasionally over the central Mediterranean, and the associated SJS in the upper troposphere, are the dominant factors controlling the summer atmospheric circulation in the vicinity of the Greek territory. These, together with the extension of the Persian trough or Cyprus low over the eastern Mediterranean and the moving anticyclones at the surface over the Balkans, are the main synoptic-scale circulation systems.
The background summer atmospheric circulation mentioned above is usually believed to be strongly influenced by the surface thermal low. This has a trough that extends from India and Pakistan through the Persian Gulf, Iraq and Turkey up to the Greek territory, where it meets the semi-permanent subtropical high over the central Mediterranean (Prezerakos, 1984, 1998; Bitan and Saaroni, 1992; Dafka et al., 2016, 2017; Tyrlis et al., 2013), and the Rossby waves train and PJS over the North Balkans (Prezerakos, 1998). This trough is called “Persian trough” according to Israeli terminology (Bitan and Saaroni, 1992) or “seasonal trough” according to Cypriot terminology (Michaelides and Michael, 2018). The mean sea level (MSL) pressure distribution between the eastern Mediterranean and India (Tyrlis and Lelieveld, 2013) (Fig. 1) reveals several closed lows located over India, Pakistan, Saudi Arabia, Iran, Iraq, and Northeast Africa. These lows, being over vast areas of land, are a result of non-adiabatic Newtonian heating; combined with nearby open seas, each could constitute a separate monsoon system. The land around the eastern Mediterranean also experiences circulations (sea breezes) smaller than monsoons. In the author’s opinion, the Persian trough or Cyprus low would exist even without the topographic influence of India, Pakistan and the Arabian Peninsula. The land mass consisting of Afghanistan, Iran, Iraq, Syria and Turkey is sufficient for the summer Persian trough to form. This can be proven with a simple numerical experiment.
According to Greek weather forecasters, the final decisive factor responsible for the day-to-day maintenance of the Etesian winds is the combination of high pressures over the Balkans and the westernmost part of the Persian trough. A closed low usually appears just northwest of Cyprus, which is not clearly shown in climatological charts although it was depicted clearly by Tyrlis and Lelieveld (2013) (Fig. 8b). This low is persistent, meandering just around the gulf of Antalya during the whole warm season. The high occurrence of this local-scale low led Greek forecasters to consider it as the key system and adopt, in their everyday weather forecasts, the phrase “… the combination of the high barometric pressures over the Balkans with the Cyprus low results in the blowing of the Etesian winds...” (Prezerakos, 1975, 1998; Ziakopoulos, 2008). In the cases where there is no distinct high-pressure area over the Balkans, the Etesian winds are limited to the south and east of the Cyclades islands (Naxos, see Fig. 1) as a result of a combination of circulations associated with the Persian trough and sea breeze. Similar synoptic situations, but without the appearance of the Persian trough, lead to the establishment of northeasterly winds (cold invasions) over the Aegean Sea during the cold seasons, but these are not Etesian winds. As soon as the Persian trough or Cyprus low appears, signaling the beginning of summer, the wind regime over the Greek seas is called “Etesian winds”. This wind regime sometimes breaks down by the arrival of a low-pressure system over the central and southern Aegean Sea, which is advected or more often created by temporary cyclogenesis establishing southerly winds at its south and east sectors.
As the onset of the Etesian winds is always associated with the appearance of the Persian trough, the time of establishment of this trough over the Eastern Mediterranean should also be the onset time of Etesian winds. Now, this question has to be answered: How can we establish this time? The answer is rather easy if we refer to the research work carried out by our colleagues from Israel. Bitan and Saaroni (1992) state that the Persian trough appears over the Eastern Mediterranean during the second half of June and disappears during the second half of September. Alpert et al. (2004) establish a new season’s definition based on the classified daily surface synoptic systems appearing in a region of the Eastern Mediterranean, including Israel. In order to determine the summer starting date, they used the daily occurrence of a Persian trough in the region, setting 1 for occurrence and 0 for no occurrence (Saaroni and Osetinsky, 2018). Then they calculated the weighted Persian trough frequency of occurrence using data from 1948-2000. Finally, they defined a starting summer date as the day when the frequency of the Persian trough occurrence reaches for the first time a value equal or greater than 6/11 (which means six out of 11 days). This criterion determines that May 31 is the starting date of summer. The end of summer is taken to be the moment when the frequency becomes smaller than 6/11 (which is found to be September 22).
Based on the above considerations, we can specify that the northwest, north and northeast winds over the Greek Seas are called Etesian when the Persian trough or Cyprus low is clearly established over the Eastern Mediterranean. The normal appearance of the Persian trough together with the Etesian winds takes place between June 1 and September 22. Based on this definition, the terms early Etesian winds (proadroamie) and late Etesian winds (meateaporie), which were introduced by the ancient Greeks, still make sense. Consequently, these terms should be used outside the abovementioned period, since there is still a likelihood of 5/11 of the Persian trough extending to the west of Cyprus.
1.1.2 Diurnal variability
A spell of Etesian winds (consecutive days) over the Greek seas displays almost steady direction but it is different in various regions (e.g., north, central, south Aegean, Ikarion, Karpathion and Ionian seas). The wind direction is northeasterly in the north Aegean, and north and northeasterly in the central and northwestern sector of the other seas (Repapis et al., 1977). The wind direction displays a diurnal variation, i.e., typically about 15 kt at noon and less than 10 kt at midnight. These characteristics are associated with what has been called type A Etesian winds by researchers of the Hellenic National Meteorological Service (HNMS) (Andreakos et al., 1985). Then, either of two events that might occur:
The wind weakens gradually during the day and at meteorological stations, where the offshore direction is south, and the sea breeze has the opposite direction of the Etesian winds finally prevailing. In the central and southern Aegean Sea, where meteorological stations are mostly installed at the north coasts of the islands, Etesian winds are almost never interrupted. In days when the sea breeze opposes the gradient wind (Etesian), Etesian winds are clasified as type C.
A new episode (new spell) of intensified Etesian winds appears. The initial consecutive days of the new episode of intensified Etesian winds with no diurnal variation are called type B Etesian winds or Etesian outbursts. The Etesian winds of near- and gale-force correspond exclusively to this type.
1.1.3 Onset of Etesian outbursts
The term “Etesian outbursts” is used to distinguish these events from those referred to as “Etesian outbreaks” by Tyrlis and Lelievelt (2013), whose study (2013) is an excellent example of how to take into account the whole atmosphere when investigating a surface synoptic scale weather system, such as the Etesian winds. They define an Etesian outbreak as a fresh episode of Etesian winds, not excluding the first, without diurnal variation, days that comprise the type B Etesian winds. A new episode occurs when a surface anticyclone arrives over the Balkans behind a cold front. This is a result of the eastward propagation of the Rossby wave accompanied by the PJS or at least by a polar jet streak, while above the anticyclone a maximum of negative vorticity advection occurs at 500 hPa. The combination of the high pressure over the Balkans and the low pressure of the permanent Cyprus low in summer, maintains the new spell of Etesian winds. Also, the establishment of a subtropical anticyclone in the central Mediterranean, being extended eastwards and northeastwards, leads to the same result, but the weather that occurs is different as the 2 m temperatures are much higher, there is no rain, even in north Greece, and the strong Etesians are restricted to the south and east of Naxos. The author’s weather forecasting experience along with a few studies (Metaxas, 1970; Prezerakos, 1975; Prezerakos and Petroliagis, 1984, 1988; Andreakos et al., 1984) reveal that when a new spell of fresh Etesian winds occurs there is no diurnal variation of the wind speed for the first one, two or three days (we shall see below that these days could reach seven), depending on the direction and intensity of the Rossby waves. As mentioned above, in these days Etesian winds are classified as type B or Etesian outbursts.
1.2 Objectives of the present study
The aim of this paper is to resolve any deficiencies or gaps left by preceding investigators and, at the same time, refresh the fundamental paper of Metaxas (1970), focusing mainly on the analysis of two case studies that clearly reveal all the physical processes contributing to the genesis and evolution of the Etesian winds. Metaxas (1970) was the first author that studied the Etesian winds from a weather forecaster’s viewpoint, although his study was based mostly upon synoptic climatology.
An attempt is made here to provide solutions to a few Etesian problems that still remain. These problems are as follows:
The frequency of occurrence, duration and dates of the episodes of type B Etesian winds over the period (e.g., 1975-2015).
The determination of tracks followed by Rossby waves associated with moving anticyclones that establish high pressure near Greece and trigger new Etesian outbursts over the Aegean Sea.
The role of the interaction between the PJS and SJT in the generation of a new Etesian outburst.
The weather conditions associated with the Etesian outbursts in Greece and its physical interpretation.
The physical interpretation of the local-scale shallow surface low that frequently appears just northwest of Cyprus, mostly meandering around the gulf of Antalya in southwestern Turkey.
As background to the last problem, the shallow low located over the sea (with lower temperature than air) inside the westernmost extension of the summer permanent thermal low (which is centered over the vast lands laying southwest of Turkey with many centers over India, Pakistan, Saudi Arabia, Iran, Iraq and Northeast Africa) would not exist and instead a weak edging trough would appear of differential diabatic heating over the Eastern Mediterranean along with the air flow coming from north over the Taurus mountain complex terrain. When these processes are particularly distinct and there is a contribution from the humidity flux from the sea, a shallow short-lived mesoscale low appears in the early morning (Karaca and Dobricic, 1997; Alpert et al., 1999) and this can be captured by satellite imagery.
This article is structured as follows. Section 2 describes the data and the methodology utilized. Section 3 presents the results deriving from the processing data of this study and of course the necessary discussion in subsections as follows: 3.1, mutual interaction of atmospheric circulation features over the region of the Etesian winds; 3.2, case study (July 21-22, 1983); 3.3, case study (July 3-4, 2017); 3.4 provides the author with the opportunity to express his views, about the linkage-if any-between the Indian Summer Monsoon (ISM), the other monsoonal and tropical systems and Etesian winds over the Greek seas, and to make a few suggestions about the future research required to address the aspects of the Etesian winds that are still questionable. Section 4 presents the conclusions.
2. Data and methodology
2.1 Data
The data utilized in this study were provided by the Hellenic National Meteorological Service (HNMS) and are: (a) original meteorological observations from 1975-2015 of the international synoptic stations namely Limnos, Naxos and Iraklion (WMO code numbers 16650, 16732, and 16754, respectively); (b) the HNMS Daily Bulletin from June to September 1991-2000, and (c) ECMWF gridded output from ERA-Interim and the operational model at 13-km resolution.
The (a) data were utilized to identify the dates of the Etesian winds type B via EXCEL (some missing data, mainly nighttime observations, hindered the identification of some Etesian winds outbursts). The (b) data were used to apply the well-known subjective method to surface and 500 hPa synoptic charts for July and August 1991-2000, in order to determine the tracks of atmospheric circulation features associated with the development and maintenance of the Etesian winds type B, with the aim of classifying them into subtypes w and n. The (c) data are used mostly to characterize the two case studies. Figure 2 was drawn with EXCEL whereas Figures 5-8 with the Surfer program contributed by the FORTRAN and MATHEMATICA programs.
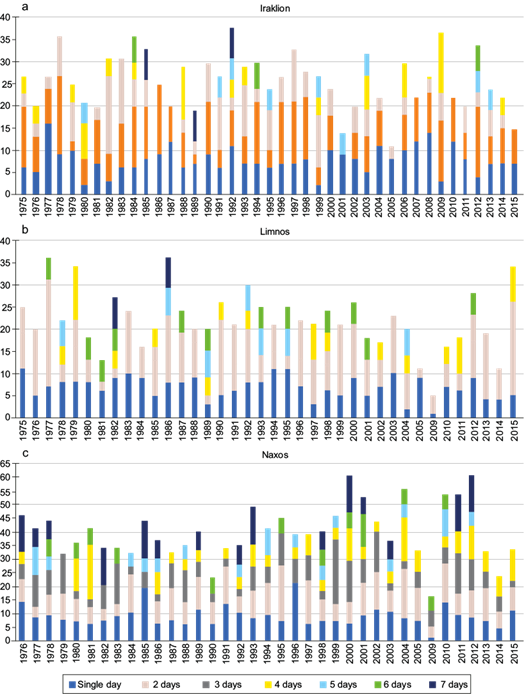
Fig. 2 Frequency of occurrence (number per year) and days of duration of Etesian wind outbursts during period 1975-2015 for (a) Limnos, (b) Iraklion and (c) Naxos meteorological stations.
At this point it is helpful to state the definitions of the conventional (thermal) and dynamical tropopauses. According to the World Meteorological Organization guidelines (WMO, 1957) the “first tropopause” is conventionally defined as the lowest level at which the lapse rate decreases to 2 °C km-1 or less, provided also that the average lapse rate between this level and all higher levels within 2 km does not exceed 2 °C km-1. If the average lapse rate above this “first tropopause” between any level and all higher levels within 1 km exceeds 3 °C km-1, then a “second tropopause” is defined by the same criterion as the first. This second tropopause may be either within or above the 1 km layer from the stratified stratosphere.
The concept of the dynamical tropopause is based on the isentropic gradient of potential vorticity (PV), but it has been most often represented by a particular PV surface to simplify matters (Hoskins et al., 1985). There is no universally used PV threshold for the dynamical tropopause, but the most common choice is the 2 PVU surface.
2.2. Methodology
2.2.1. Definitions of frequency, outburst dates and duration of type B Etesian winds
In order to study the type B Etesian winds, it is first necessary to detect and select their dates based on a long period of surface meteorological observations (e.g., 1975-2015), and then to determine their statistical behavior. For this to be accomplished, we set an objective criterion based on the main characteristic of the type B Etesian winds. The dates of these winds, the identification and comparison of the outbursts dates, and the physical processes and dynamics of the synoptic situations responsible for the creation of the winds of this type, could be determined based on a lack of diurnal variation. Of course, we could use other basic characteristics, such as the negative advection of relative vorticity or the anticyclogenetic process over the Balkans.
The criterion that has been chosen is as follows: during the period June to September, we identify a date as “type B Etesian wind day” or “Etesian outbursts day” if the observed 10-m wind at 24:00 UTC (00:00 UTC of the next day) at one or more of three Greek meteorological stations is northwesterly, northerly or northeasterly with a speed greater or equal to 2/3 of the speed of the 12:00 UTC observation on the same day. If the 24:00 UTC wind observation is missing, the 21:00 UTC one is used or the 03:00 UTC of the next day if both the previous ones are not available. The nighttime observation must not be less than 10 kt. This criterion is completely different from the one introduced by Tyrlis and Lelieveld (2013) for detecting the Etesian outbreaks days, as Etesian outbursts and Etesian outbreaks, as mentioned above, have different meanings.
The frequency of occurrence of the type B Etesian days is illustrated in Figure 2, where it can be seen that the number of consecutive days comprising a spell of Etesian outbursts can be as high as seven in all of the three meteorological stations. The population for the occurrence of seven consecutive days with Etesian outbursts, is the smallest among the populations of one, two, three, four, five and six consecutive days of type B Etesian winds.
Though outbursts and outbreaks are defined in different ways and the criteria used for detecting them are not the same, the dates which signal their onset would be almost the same during the period of this study. Once the dates of type B Etesian winds have been established, it is then possible to identify and compare the outbreak dates and also to study the physical processes and the dynamics of the synoptic situations responsible for the creation of the winds of this type. An interesting article dealing with the interannual variability of the Etesian wind days that can be used for comparison is Tyrlis et al. (2015).
2.2.2 Classification of synoptic systems
The climatological classification and investigation of the synoptic-scale systems responsible for the initiation of a fresh spell of Etesian winds, their behavior, and the detailed determination of their tracks and intensity were studied many years ago by Prezerakos (1975). Of course, that study utilized the knowledge and scientific tools available at that time and meteorological data from 1961-1972. The well-known subjective method of inspection of archived analyzed synoptic charts is utilized to identify the characteristics of the synoptic circulation factors associated with the creation of the Etesian winds. This method was applied here to synoptic charts for July to August 1991-2000 taken from the Daily Bulletin of the HNMS. The intention is not to establish new findings, but rather to verify those that already exist. Repeating the same synoptic climatological studies by utilizing modern scientific tools and gridded data is a separate task, and outside the scope of this study. Consequently, it is left to upcoming researchers to complete that task, given that all the meteorological material used in this study is available from the author.
3. Results and discussion
3.1. Interaction of atmospheric circulation features over the region of the Etesian winds
As already mentioned, the key atmospheric circulation features for the development of Etesian winds over the Greek territory during the summer are the PJS and SJS. These features are closely related with Rossby waves resulting in the formation of low- and high-pressure centers, along with the contribution of the advection and vertical fluxes of the various kinds of Newtonian heating and orography. A vast and valuable research work on anticyclogenesis and the behavior of anticyclones in and around the Mediterranean, was first carried out by T. Makrogiannis, cited in Hatzaki et al. (2014), whose figure 7a but mainly 7b, showing the tracks of anticyclones in the summer, is a manifestation of the close dependence on the two jets. The distribution of the locations of the tracks just north of Greece and along the North African coasts, just south and parallel to the PJS at 300 hPa and SJS at 200 hPa, respectively, is a robust proof of this relation. Also, in that figure, there are few cases of northward meandering of the SJS together with associated high barometric pressures, necessary companions of heatwaves over the Balkans (Prezerakos, 1989).
Inspection of synoptic charts allow the identification of the synoptic circulation factors associated with the development of the Etesian winds. The results revealed the same findings as in past studies, confirming the results of Constantakopoulos (1959), Metaxas (1970) and Prezerakos (1975, 1998). Constantakopoulos (1959) and Metaxas (1970) distinguished two synoptic processes leading to onset of outbreaks (Tyrlis and Lelieveld, 2013), whose first days without diurnal variation of the wind intensity comprise the Etesian winds outbursts of the types w and n. In type w, the anticyclone comes over the Balkans from the west and in type n it comes from the north.
After this fresh look at the track of the Rossby waves and their close link to the onset and cessation of the type B Etesian winds, an attempt is made to interpret all the physical mechanisms responsible for their appearance and maintenance, following the recent advances in meteorological science. The synoptic stages depicting the onset of the Etesian outbursts have already been described. The necessary and sufficient condition for the onset of an episode of type B Etesian winds is the establishment of an anticyclone with an extending robust ridge behind a cold front. All the cases of the onset of Etesian outbursts over the Aegean Sea are associated with a cold front moving towards Greece, independently from the direction of movement of the Balkans anticyclone. It is worth noting that in many cases of long-living Etesian wind outbursts (lasting four to seven days), the Balkans’ anticyclone is in a steady-state, though there might be an intensification with a period of two to three days. This is a result of downstream development and atmospheric energy dispersion that was discussed in detail by Prezerakos et al. (1999).
The role of the blocking anticyclone, necessary to strengthen the high pressure over the Balkans and the next stages of the evolution of the Rossby wave, will be revealed by studying and interpreting the Etesian onset cases on July 21, 1983 (late afternoon) and July 3, 2017, which were types n and w, respectively, according to Metaxas (1970). Also, these case studies suggest that there is no link between the onset of an Etesian outburst and the Persian trough.
3.2. Case study: July 21-22, 1983
We start our analysis with the depiction of the topography of the 315 K isentropic surface at 00:00 UTC on July 21, 1983 (Fig. 3a). During the preceding days, the process altering the circulation index from high to low resulted in the formation of the blocking high over the British Isles. This extended northeastwards and the consequent evolution of downstream development (Prezerakos et al., 1999) resulted in a meridional orientation of the PJS, along the eastern flank of the blocking high. There was also a distinct jet streak northwest of the Balkans, which signals the accumulation of substantial eddy kinetic energy. In the same period, the occurrence of a tropopause folding with a satisfactory slope in the vicinity of the jet streak, resulted in a very cold stratospheric air mass, accompanied by high PV values, appearing towards the right entrance of the jet streak. The θ = 315 Κ surface, sloping downwards from north to south, extends from a height of 350 hPa just northeast of Scotland to 750 hPa over Egypt and 950 hPa over Northwest Africa. The lower the isentropic surface, the warmer the air. The concentration of the isobars (strong pressure gradient) of the θ = 315 Κ surface over the north Balkans, orientated almost parallel from west to east, clearly determines the position of the surface cold front. The θ = 330 Κ surface, on which the wind field is analyzed (see purple isotachs), lies below the level of the SJS over southern Greece and, therefore, it cannot be captured by the isentropic charts shown in Figure 3. The areas with PV of stratospheric origin are shown clearly on the θ = 330 Κ surface. Also, the jet streak, accompanied by a significant amount PV of stratospheric origin, is distinct and centered at 10º E, 55º N.
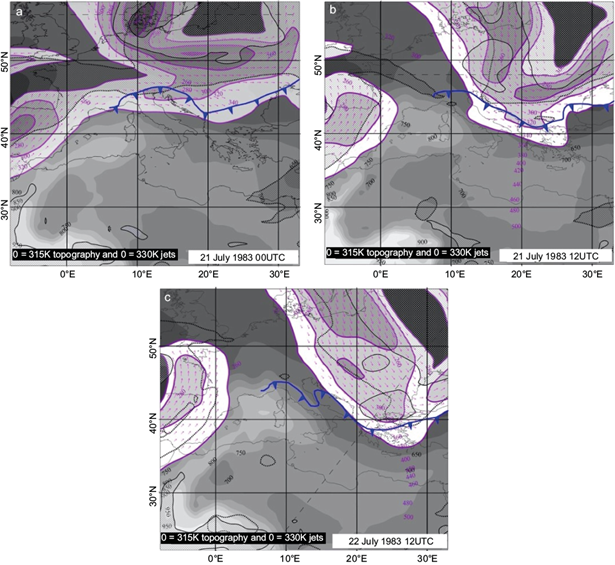
Fig. 3 Topography of θ = 315 Κ isentropic surface (shading increasing every 50 hPa, in black) for (a) 00:00 UTC on July 21, (b) 12:00 UTC on July 21, and (c) 00:00 UTC on July 22, 1983. Area enclosed by dotted black line: PV 330 K ≥ 1 PVU. Cross hatched area enclosed by solid black line: PV 315 K ≥ 1 PVU. Numbers in purple: topography of missing isotropic surface θ = 330 Κ. Purple lines: isotachs of missing isentropic surface θ = 330 K for wind speed ≥ 20 m s-1 per 10 m s-1. Vectors indicate wind direction.
At the surface, a large anticyclone centered over Ireland has a ridge towards the southeast, which reaches the cold front located over northern Italy and directed northeasterly (not shown). The isallobaric center of rising pressure is placed at 10º E, 55º N with a value of more than 1.5 hPa/3h, whereas pressure is falling along a line extending from northeastern Greece to the Black Sea, at some distance ahead and parallel to the cold front. The large tilting between the centers of the barometric system in the middle troposphere and the surface, reveals the degree of existing atmospheric baroclinity, which is a source of available potential energy that is then converted into eddy kinetic energy.
Twelve hours later at 12:00 UTC (Fig. 3b) not much has changed, except for the expected movement of the whole system towards the south-southeast. However, it is worth noting the distinct shift of the PJS: it now has a northerly orientation on the left and a southeasterly orientation on the right, with a trough over the Balkans. Although this could be attributed to the continuous approach of the PJS to the SJS, the latter has not yet appeared clearly on the θ = 330 Κ surface.
Now consideration is given to a subjective analysis of tropopause and maximum winds from radiosonde observations at 12:00 UTC on July 21, 1983 (Fig. 4a). Radiosonde observations provide the height of the thermal tropopause with good accuracy (see subsection 2.1). Figure 4a depicts maximum winds together with the associated heights and jet axes, and provides a three-dimensional view. We can see that the jet axes wave up and down vertically and north-south horizontally. The position of the SJS axis is shown clearly over central Greece at a height of 200 hPa, upgliding eastwards at a height of 130 hPa over north Turkey and descending towards the east, downstream. From southwest Spain up to Italy, the SJS axis meanders northwards and upwards and then it descends as far as Greece.
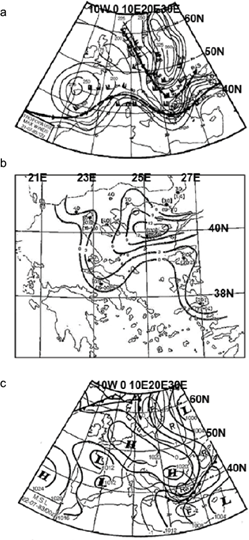
Fig. 4 (a) Subjective analysis of tropopause and maximum winds at 12:00 UTC on July 21, 1983. Continuous lines: tropopause height isopleths per 25 hPa. Thick dashed lines with arrows: axes of jet streams. Numbers to the right of wind symbols: height of the maximum wind in hPa. Wind symbols: the shaft indicates wind direction, a full barb represents wind force of 10 kt, a shorter barb 5 kt and a solid pennant 50 kt. (b) Cumulative precipitation in Greece from 17:00 UTC on July 21 to 00:00 UTC on July 22, 1983. Black continuous lines: precipitation height isopleths per 3 mm. Values in brackets: precipitation volume after 18:00 UTC and in the period shown in parentheses. (c) Subjective MSL analysis at 00:00 UTC on July 22, 1983. Bold lines represent isobars per 4 hPa, and ordinary lines represent isallobars per 1 hPa per 3 h.
The subjective isobaric analysis of the tropopause height per 25 hPa resembles the surface isobaric analysis of blocking high per 4 hPa with reverse values. The tropopause height is less than 175 hPa over the British Isles, France and Germany and confirms what is already been well-known about the subtropical-almost tropical-origin of the air above 600 hPa in blocking anticyclones. Three locations in Figure 4a are important: the first one is an area of distinct low tropopause (300 hPa height and 80 kt wind) almost above Thessaloniki (see Fig. 1), looking like a detached polar jet streak, with its tropopause and with PV values higher than 1 PVU. The latter is also apparent on the θ = 315 Κ surface (Fig. 3b). This feature increases dramatically the latent instability of the troposphere in the region of Thessaloniki and contributes directly to the “bourini” outburst a few hours later at 17:00 UTC. In Prezerakos and Petroliagis (1988), but mainly in Prezerakos and Petroliagis (1986), the bourini (extremely severe windstorm) has been studied in detail. As we can see in the present study, the bourini is not a permanent element of the weather associated with the onset of the type B Etesian winds.
The second region of interest in Figure 4a is at 20º E, 48º N, where the jet streak with its PV appears to be coming from 10º E, 55º N. In the vicinity of this jet streak, the tightness of the tropopause isobars is indicative of the tropopause folding.
And the third one is the region in the Middle East where the tropopause height is much less than 100 hPa, thereby indicating a tropical tropopause. This kind of tropopause, together with the positioning of the SJS north of Turkey and Iraq, establishes weather conditions completely different than those prevailing over Greece. This fact should be a persuasive reason for studying the atmospheric circulations over the Eastern Mediterranean in two separate regions: to the west and to the east of the island of Rhodes.
With the approach of the PJS to the SJS, the latter situated almost above Athens (Fig. 1), the interaction of the two jets begins. As a consequence, there is a limitation on the upward extension of the frontal surface. This is because the SJS prevents the cold air from being advected southwards above 500 hPa. So, the cold front becomes shallow and stops being active, and rainfall and thunderstorms occur only in northern Greece and Turkey (Fig. 4b). However, over central and southern Greece only relatively cold Etesian winds appear.
In addition to the horizontal interaction of the two jets, the vertical interaction is better illustrated on cross-sections. Cross-sections along 23º and 25º E were constructed, extending from 20º to 60º N. The cross-section along 23º E from 18:00 UTC on July 21, 1983 is depicted in Figure 5a. The main branch (small region around a point on the jet axis with maximum wind) of the PJS is located at 51º N and 300 hPa, with a northwesterly direction (see Fig. 3). Its associated PJS is located at 51º N and the cold tropospheric air mass reaches a level of 400 hPa at the northern end of the cross-section, with its tropopause dropping down to 600 hPa, whereas warm stratospheric air masses are located above this, in accordance with the PV balance. The main branch of the SJS is located at 38º N and 200 hPa. As already seen in Figure 4a, both jets have a northerly component, but that of the PJS is almost three times stronger than the SJS. This indicates a tendency of the large-scale flow to promote confluence between the two jet streams above Central Europe and the Balkans. A confluent flow is conducive of frontogenesis. Indeed, an upper-level front (ULFnt) is visible in the cross-section bounded by the 315 K and 325 K isentropes, extending from 300 hPa at 46º N, down to 700 hPa at 36º N.
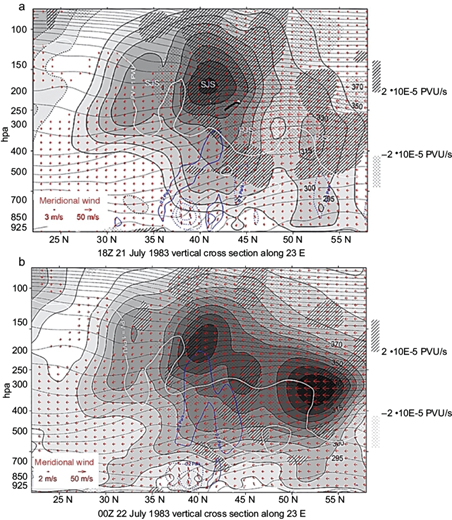
Fig. 5 Meridional vertical cross-section along 23º E for: (a) 18: 00 UTC on July 21 and (b) 00:00 UTC on July 22, 1983. Labelled dotted lines: potential temperature (θ), with a contour interval of 5 K. Increasing shading enclosed by solid bold non-labelled isotachs: total wind speed ≥ 5 m/s, with a contour interval of 5 m s-1. White line: PV = 1 PVU. Areas on the cross-section plane of the section: isobaric PV advection is absolutely greater than 2 × 10⁻⁹ PVU s-1. Hatched areas: positive PV advection; dotted areas: negative PV advection. Areas on the cross-section plane enclosed by blue isopleths: where |ω| ≥ 0.2 Pa s-1 with an isopleth interval of 0.2 Pa s-1. Continuous isopleths: descent; broken isopleths: ascent. Red arrows: (v, ω) on cross-section plane. Scale of v component shown in the lower left corner.
The ULFnt is associated with a secondary branch of the PJS, located at about 300 hPa and 44ºN, which is better visible in the isentropic charts of Figure 3. As the northerly flow has a downward component along this ULFnt, high PV air is advected southwards and eastwards down to at least 600 hPa and 38º N. Indeed, positive PV advection exceeds the value of 2 × 10⁻⁹ PVU s-1 in a large portion of the ULFnt. The maximum downward slope of the ULFnt (from north to south) occurs under the SJS due to the descent (> 0.2 Pa s-1) associated with the latter. Differential subsidence, increasing from the cold towards the warm side of an ULFnt, has been found by Sanders et al. (1991) to be responsible for upper-air frontogenesis. The maximum downward slope of the ULFnt (from north to south) occurs under the SJS due to the descent (> 0.2 Pa s-1). In association with the maximum intensity of the ULFnt, there is the maximum PV advection in the 500-400 hPa layer below the northern flank of the SJS (43º N), which results in the detachment of a blob (closed white line in Fig. 5a) of high PV (> 1 PVU) air at the base of this intense upper-air frontal zone. This structure resembles a tropopause fold, associated with the secondary branch of the PJS, in agreement with the discussion on Figures 3 and 4a. As the descending northerly flow continues all the way along the ‘interior’ of the ULFnt down to 900 hPa and 35º N, it is obvious that high PV air is also advected to that point. The rate of the advection is, of course, slower than higher up and further north, but the stratification at this southern latitude is much weaker, which, via PV conservation, is conducive to cyclogenesis. This cyclogenesis has to occur at ~37º N and a few degrees to the east of the longitude of the cross-section. That is in good agreement with the mesoscale surface analysis every 3 h (not shown) verifying the decrease in barometric pressure ahead of the cold front and the occurrence of the secondary lows over the Aegean Sea, a fact which is also supported by Figure 4c, although it is for few hours later.
Below the ULFnt, another frontal surface forms between the 295 K and 305 K isentropes and extends from about 50º N and 600 hPa to the surface and 40º N. This is associated with the surface front (SFCFnt) shown in Fig. 3 and with the main branch of the PJS. A strong ascent/descent couplet of -0.8 + 0.4 Pa s-1, forms on either side of the SFCFnt, revealing its position at 40º N. A second fold of the dynamical tropopause is associated with this lower frontal surface, as indicated by the detached blobs of high PV and the PV advection. Above certain locations, (for example 43º Ν), the upper tropopause fold is superimposed on the lower one, with the former observed at the level of 500 hPa and the latter at 700 hPa. This structure is reflected as sudden undulations of the tropopause height on a chart of the tropopause topography, as presented in Figure 4a. It is important to bear in mind that the tropopause in this figure is the thermal tropopause and not the dynamical one. As far as the SFCFnt is concerned, the interaction between the SJS and PJS is perfectly manifested in this cross-section.
Large-scale descent associated with the SJS prevails above the strong ascent-descent couplet. This descent limits the frontal updraft up to the level of 600 hPa, whereas a few degrees further north, just off the Greek border, updrafts extend up to at least 400 hPa, co-located with deep convection. This scenario is supported by Figure 4b in which rainfall amounts decrease from north to south along 23º E, as already mentioned. Six hours later at 00:00 UTC on July 22 (Fig. 5b) there are no dramatic changes, but there are few noteworthy ones. The cold air mass (see the 300 K isentrope) together with the associated SFCFnt, has shifted slightly to the south. However, the core of the cold air mass has slightly retreated towards the north (see the 315 K isentrope), which is supported by the slight retreat of the main branch of the PJS towards the north. Baroclinity increases due to the proximity of the two jets (Prezerakos, 1998; Prezerakos et al., 2006), resulting in the strengthening of the descent below the SJS and, mainly, the expansion of the associated area on the cross-section. The two frontal zones seen in the previous 18:00 UTC cross-section (Fig. 5a), have apparently merged at 00:00 UTC. This is also manifested in the cross-section of Figure 6. Because of this vertical merging, the area of PV > 1 PVU has increased in the interior of the frontal zone because, at the same time, the hydrodynamic instability has also increased at the level of the two jets. This indicates an acceleration of the process of meridional PV advection as the total PV advection has decreased in the 6-h period since 18:00 UTC due to the dramatic decrease of the zonal PV advection. As the trough progresses eastwards, so the meridional PV advection. Though its values are not shown, it should have increased as should the associated implications for low-level cyclogenesis downstream of the flow. Figure 4c depicts in synoptic scale the space changes of MSL barometric pressure over the Aegean Sea verifying what has been mentioned above about the blocking anticyclone covering the region from British Islands as far as the Balkans and the falling (F) and rising (R) of the barometric pressure ahead and behind the SFCFnt, respectively.
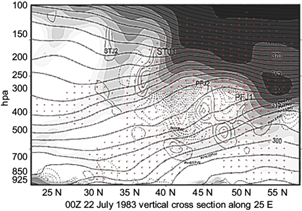
Fig. 6 As in Figure 5b, but for 25º E. No isotachs are plotted so jet locations are shown instead. PV ≥ 0.5 PVU is increasingly shaded per 0.25 PVU. Areas on the cross-section plane where isobaric PV advection is absolutely greater than 10-9 PVU s-1, are indicated by isopleths per 10-9 PVU s-1. Solid isopleths: positive PV advection. Dotted isopleths: negative PV advection. Advection is masked by stratospheric PV values, as only tropospheric PV advection is of interest. Red arrows: north-south winds, parallel to cross-sectional plain.
July 21 and 22, 1983 comprise, according to the objective criterion, a type B Etesian wind outburst with a duration of two days. During the following days the wind speed experienced the usual diurnal variation and the episode transitioned to a type A Etesian wind.
3.3. Case study: July 3-4, 2017
We consider now a case of Etesian outburst of type w, according to Metaxas (1970). In this case, an ordinary area of positive absolute vorticity advection began to appear in the morning of July 3, 2017 over the Greek territory, where conditional instability prevailed. This advection is associated with a normal, relatively small amplitude Rossby wave trough, moving from west to east. This trough was situated just east of the Iberian Peninsula (not shown) on June 26, triggering the physical mechanism for the meandering of SJS further northwards (Prezerakos, 1989). It was then located over Greece resulting in a rather short heatwave, which lasted more than three days. The possible impact of the West African Monsoon (WAM) upon the meandering northwards of the SJS is discussed in the next section. A detailed discussion of the heatwave that affected Greece from June 29 to July 3, 2017 was prepared by N. Karatarakis and A. Lalos, Directors of Climatology and Forecasting Departments, respectively, of the Hellenic National Meteorological Service. It is available at www.hnms.gr.
On July 3, the god Aristaeus, unwilling to see any more suffering due to high air temperatures, decided to send his Etesian winds to relieve them. A SFCFnt ahead of a 500 hPa trough (Fig. 7a, b) moved over the Balkans on July 3, thereby establishing fresh Etesian winds with a significant drop in air temperature, as shown in Figure 7a. The SFCFnt, together with the Rossby wave, is steered by a polar jet streak, which meets the SJS on July 2 as shown by the northwest-southeast oriented cross-section of Figure 8 (see Fig. 7a). In this cross-section (Fig 8a), the SFCFnt is clearly seen northwest of Thessaloniki at 44º N. A thermally direct (D) circulation is observed in the section-parallel flow field (red arrows), centered at the SFCFnt and extending up to about 500 hPa. The frontal surface extends vertically up to just beneath the PJS, where part of the frontal ascent diverges southward and subsides, thereby forming what appears to be a thermally indirect (I) circulation under the SJS. The two jets have not yet merged completely, which is consistent with an upward kink of the tropopause between them. Subsidence prevails all over the Aegean Sea, maintaining high surface air temperature southeastwards of Rhodes, which remains inland until the cross-section plane meets the Arabian Peninsula and a low-level ascent appears due to diabatic Newtonian heating. Over the western Arabian Peninsula and higher than 500 hPa, convergence occurs, and this stabilizes the 500-350 hPa layer. Above 350 hPa the atmosphere shows weaker stability, and at the same time the tropical easterly jet appears. The influence of the tropical easterly jet is limited to the Arabian Peninsula, where the air flow above 300 hPa seems to be southeasterly; this means that the air is quite far from its starting point (area of strong tropical convective activity) and has already diverged northwards for being southwesterly and then westerly when it reaches the SJS.
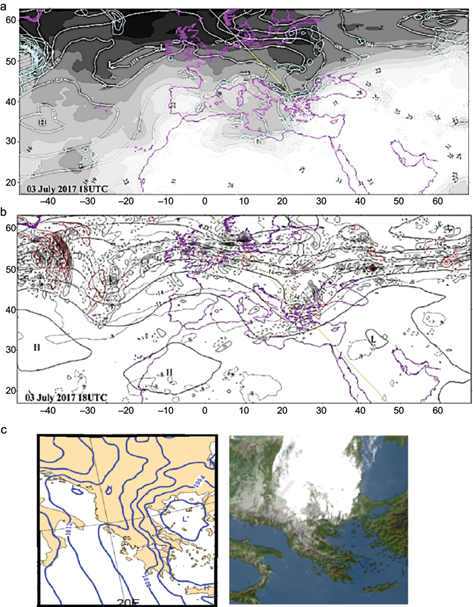
Fig. 7 Objective analyses for 18:00 UTC on July 3, 2017. (a) MSL pressure and 850 hPa temperature. White labelled contours: MSL isobars per 4 hPa; increasing shading: 850 hPa temperature labelled per 3 ºC; light blue isopleths: 850 hPa isobaric temperature advection absolutely greater than 5 K day-1 and per 5 K day-1; solid: positive; dotted: negative. Green straight line: cross-sections trace. (b) Geopotential height, temperature and absolute vorticity advection at 500 hPa. Solid non-labelled black contours: geopotential height per 60 gpm. Dotted labelled per 3 ºC: 500 hPa isotherms; grey shading enclosed by isopleths: 500 hPa absolute vorticity advection absolutely greater than 10-9 s-2 per 10-9 s-2, solid: positive, broken: negative; red isopleths: isobaric temperature advection, contoured as in (a). (c) Left: ECMWF MSLP analysis per 2 hPa at 00:00 UTC on July 3, 2017, right: METEOSAT IR image for July 3, 2017 at 13:15 UTC.
Thirty hours later (18:00 UTC) on July 3 (Fig. 8b) the state of the atmosphere remains almost unchanged on the large scale with of course the expected evolution on the synoptic scale. The main change occurs in the area where the SJS and the PJS merge. Both jets have shifted southeastwards and, at the same time, the PJS below 350 hPa has advanced southwards more than the SJS beneath it. The trace of the SFCFnt appears at 27º E, 37º N over the Aegean Sea with the frontal surface limited between 800 and 530 hPa. Below 850 hPa, the atmospheric layer is very stable because the isentropes have tightened in association with the Etesian winds. The direct circulation (D) shows the upward limitation of the frontal surface, which thereafter most likely does not exist. Because of the limitation of the upward extension of the cold frontal surface due to the impact of the SJS, no precipitation was observed over the Aegean Sea, although cyclogenesis had occurred there for the last eight hours (Fig. 7a). Mesoscale MSL isobaric analyses (Fig. 7c, left) reveals that the 1002 hPa isobar covers just the northern part of the Aegean Sea, with a minimum value of 1001 hPa at the point 25º E, 39º N, but 24 h later the pressure rises to 1010 hPa as the positive advection of vorticity heads northeastwards and negative advection at 500 hPa occurs over the Aegean Sea. The appearance of type w Etesian outburst also does not have any dependence on the Persian trough’s extension or the Cyprus low even in the few cases where a positive advection of vorticity in the middle troposphere deepens the Cyprus low, since this change comes directly from the Rossby wave train. Also, successive satellite images verify (Fig. 7c, right) that the southernmost part of the cloud system, associated with the 500 hPa trough and the positive advection of absolute vorticity, passed along the north coasts of Greece heading northeastwards and following the track of the positive vorticity advection. The weakening SFCFnt seems to pass Naxos at about 00:00 UTC on July 4, 2018, when the wind there becomes northeasterly at 25 kt. This value remains during the next night and gusts greater than 30 kt occur by midday. The events of July 3 and 4, 2017 fulfill the objective criterion to be designated as type B Etesian wind days.
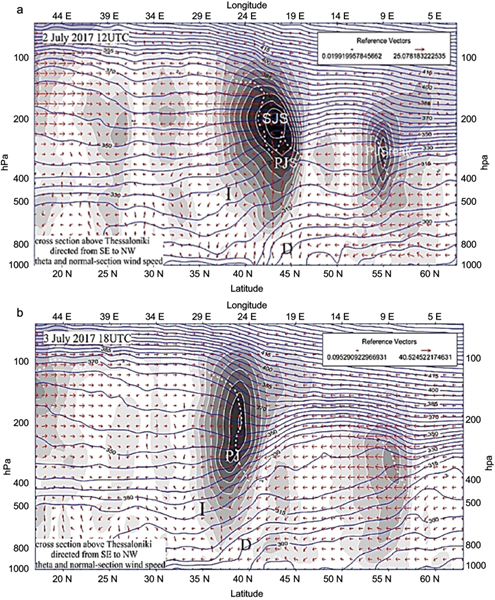
Fig. 8 Vertical cross-section along the southeast-northwest oriented green axis shown in Fig. 7a for: (a) 12:00 UTC on July 2 and (b) 18: 00 UTC on July 3, 2017. Solid blue lines: potential temperature per 5K; white lines: isotachs for wind speed ≥ 5 m s-1 normal to the cross- section plane per 5 m s-1 (solid: southwesterlies, broken: northeasterlies). Red vectors represent the air flow upon the cross-section plane. The vertical velocity component has been magnified for better visualization. Horizontal component scaled as shown in the upper right corner. D: thermally direct circulation (warmer air ascends and colder air descends); I: indirect circulation (warmer air descends and colder air ascends). The white broken line running almost all the chart is the dynamical tropopause.
3.4 Signs of direct impact of distant low frequency atmospheric circulation systems over the Greek territory in the Etesian winds season
Consideration is given to atmospheric circulations far from the Balkans in order to determine whether there are any real-time signals of a direct impact of the ISM on the synoptic-scale subsidence over Greece during episodes of Etesian winds.
Some recent studies have attempted to answer this question, mostly using statistical correlations and idealized numerical models (Rizou et al., 2015, 2018; Cherchi et al., 2014, 2016; Attada et al., 2018). The study by Cherchi et al. (2016) includes 21st century projected summer mean climate in the Mediterranean and interprets it through the monsoon-desert mechanism (Rodwell and Hoskins, 1996). However, research to examine the interaction of the main scales of motion comprising the atmospheric circulation spectrum in real time is still necessary.
Accurate air mass trajectories may be an effective tool to examine scale interactions. Already valuable attempts have been made to use trajectories for discovering any distinct circulation (e.g., Ziv et al., 2004) apart from the Hadley circulation, linking the ISM with mid-level tropospheric subsidence over the Eastern Mediterranean Sea and specifically over Israel with very interesting results. However, the limited length of the trajectories and not considering two sectors within the Eastern Mediterranean (i.e., west and east of the Greek island of Rhodes) during summer are some limitations of the mentioned study.
In the analysis of the case studies, a special attempt was made to identify any distinct atmospheric circulation linking in real time the ISM with the Rossby wave and the steering PJS in the eastern Mediterranean. The cross-sections along 23º and 25º E in Figs. 5 and 6 reveal that over east Africa the winds from the surface up to 200 hPa are northerly, whereas above this level the easterly tropical jet stream becomes gradually southeasterly and extends as far as 30º N. Over the Western Arabian Peninsula and higher than the 500 hPa level convergence prevails (Figure 8) and stabilizes the 500-350 hPa tropospheric layer. Above 350 hPa, the atmosphere shows weaker stability and an easterly tropical jet, whose influence is limited to the Arabian Peninsula, where the air flow above 300 hPa is southeasterly. This means that the air is far enough from its starting point (the area of ISM) to be diverted northwards due to the Coriolis force. This atmospheric circulation feature is in agreement with the streamlines showing the mean zonal flow (12º-35º N) in the mean east-west cross-section for strong and weak ISM being extended from 100º E to 20º E, depicted in figure 7 of the paper by Attada et al. (2018). This figure indicates air flow convergence ~40º E as a result of the westerlies to the west and the easterlies to the east of this meridian. It also confirms the presence of the SJS around 25º E (the latitude is shown in their figure 4a). Beyond this point eastwards, the SJS meanders northwards and through Iraq and Iran; it passes north of the Himalaya, leaving the Arabic Peninsula uninfluenced and also the ISM free to extend its circulation impact up to this region.
Equivalently, there is no real-time evidence that the low-level subsidence over the Greek territory is associated in any way with the ISM. In mean circulation charts, even in monthly ones (Prezerakos and Flocas, 2002, figure 10) it can be seen that easterlies at the surface between 30º N and 30º S are reduced upwards to 50 hPa, where their amplitude halves. So, the easterly jet responsible for the zonal meandering of the equatorial Rossby wave, at about 150 hPa, is limited in width. This easterly jet, starting from a region of deep convection over the China Sea, undoubtedly impacts the general circulation of the Earth’s atmosphere. The question is: What is the extent of the impact of such heating and of vorticity sources?
There are many atmospheric phenomena like the ISM in the tropics, which combined with the warm towers of the ITCZ are feeding the Hadley circulation (Fierro, 2009). In particular, energy sources that control the meridional meandering of SJS over the Mediterranean, and specifically over the Greek territory in summer, should be revealed by additional research. Based on the author’s synoptic experience, during all the heatwave episodes over the Balkans, a ridge of the SJS is present over the Balkans and its main branch seems to come from the eastern Atlantic and Northwest Africa (Prezerakos, 1989). Considering the findings of Flaounas et al. (2011), we may suggest that the WAM likely impacts the SJS rather than the ISM.
The onset time and the intensity of the various monsoon systems around the equatorial zone depend mostly on the sea surface temperature which, in turn, is mainly configured by El Niño-Southern Oscillation (ENSO), the oceans circulation and the mutual influence of the wind and the sea waves. The observed but not yet fully explained theoretically Madden-Julian Oscillation (MJO), which encompasses deep convective systems around the equatorial zone, seems to be associated with the equatorial Rossby waves transmitted in conjunction with the above mentioned high-level equatorial jets. The way that these physical phenomena interact is of fundamental importance in altering the atmospheric circulation index.
This study showed clearly that Etesian wind outbursts occur when the atmospheric circulation index transitions from high to low and a blocking high establishes in the northeastern Atlantic. This process is of fundamental importance, causing cold invasions over south Europe (Prezerakos et al., 1999), as the SJS over the Atlantic Ocean transitions from an almost zonal flow with no disturbances (high index) to a disturbed flow with large waves (low index), as shown in one of the case studies.
The whole subject needs more research, not only through climatological methods and idealized numerical models, but also via diagnostic studies of the spectrum of atmospheric motions. Again, accurate air mass trajectories can be a tool, as utilized in earlier studies (Rolph and Draxler, 1990; Seibert, 1993; Stohl, 1998; Engstrom and Magnusson, 2009) limited by many uncertainties. Significant improvements have since been made leading to more accurate results during the last decade (Miltenberger et al., 2013; Sprenger and Wernil, 2015). Finer model resolutions (~9 km in the horizontal and 7 min time step) and new model developments (e.g., ECMWF IFS cycle 46r1, which predicts a new Eulerian wind field) will allow accurate forecasts of Lagrangian forward air trajectories with FLEXTRA, which is an older version of FLEXPART (Stohl et al., 2005). This development is expected soon and, as an extension of Fierro (2009), which helps to fully understand the mesoscale air trajectories inside “warm towers”, it will act as an intermediary between convective-scales and large-scale atmospheric circulations, thereby revealing the way that warm towers feed into the Hadley circulation.
4. Conclusions
The term Etesian wind outbursts refers to the first days of a spell with a rather sudden significant increase of wind speed and constant wind direction with no diurnal variability (type B Etesian winds). These days of type B Etesian winds have been selected according to an objective criterion based on their main characteristic: the lack of any diurnal variation in wind occurring at least in one of the synoptic meteorological stations (Limnos, Naxos and Heraklion) over the period 1975-2015.
A simple statistical analysis of type B Etesian wind days revealed that the duration of the Etesian winds outbursts varies from one to seven consecutive days. The near gale and gale force Etesian winds belong exclusively to type B.
Almost all significant outbursts of Etesian winds occur when a surface anticyclone arrives over the north Balkans and extends a ridge toward Greece behind a surface front. This is a result of the Rossby waves being steered by the PJS or at least by a polar jet streak. Rare episodes occur only when the rising of the MSLP over the Balkans is a result of the extension of a Mediterranean subtropical anticyclone north or northeastwards
Metaxas (1970), in agreement with Constantakopoulos (1959), discriminates between two types of onset of Etesian wind outbreaks without diurnal variation of the wind intensity on the first days: type w when the anticyclone reaches the Balkans from the west and type n when the anticyclone reaches the Balkans from the north. However, the 10 years of (b) data for July and August 1991-2000 used to apply the well-known subjective method to surface and 500 hPa synoptic charts, verify the existence of two more types of outbreaks onset with very low frequency of occurrence: type s and type c. The first one is associated with the establishment of a subtropical anticyclone in the central Mediterranean, extended eastwards and northeastwards, as mentioned above, rising the barometric pressure over the Balkans. In this case, the weather that occurs in Greek territory is different than during the onset of the other types, as the 2 m temperatures are much higher, there is no rain even in northern Greece and the strong Etesians are restricted around Naxos and southwards (Fig. 1). Type c could be considered as a specific gradual transformation of types w or n. As both study cases analyzed showed, when the SJS is located over the Greek mainland at about 200 hPa and travels through the north Aegean Sea and North Turkey to Iran and at the same time the PJS or a polar jet streak, associated with the Rossby wave train and the surface front, approaches Greece (see Figs. 3 and 7), an interaction occurs between the two jets.
The main consequence of this interaction, filling a knowledge gap, is the blocking, which the SJS exerts on the PJS core for farther meandering southwards and at the same time the bounding of the upward extension of the frontal surface because the SJS prevents cold air from being advected southwards above 500 hPa. This means that the cold front becomes shallow, stops being active, and rainfall and thunderstorms occur mainly in northern Greece and Turkey, whereas in the central and southern Greece relatively cold Etesian winds appear. Only in few episodes of Etesian winds outbursts rain and thunderstorms appear over the Greek mainland as far south as the Peloponnesus. This Etesian winds regime sometimes breaks down by a low pressure system establishing southerly winds at its south and east sectors over the central and southern Aegean Sea, as a result of the tendency for temporary cyclogenesis over the Aegean Sea (which is cooler than the air) ahead of the surface front that accompanies the onset of types w and n Etesian winds outbursts. In these few times the low-pressure system stops being temporary and heads toward Cyprus, intensifying the Cyprus low. The robust manifestation of this atmospheric process is the appearance of two absolute vorticity advection maxima at the 500 hPa level, a negative one over the Balkans and a positive one just west of Cyprus. The onset of an Etesian wind outburst during summer is associated with this synoptic situation: rising barometric pressure over the Balkans and simultaneous falling pressure over the westernmost edge of Persian trough. This is a clear proof that the physical mechanism generating the Etesian winds outbursts of type c is the mature stage of a continuation of the mechanism that gives rise to types w and n. This stage is exactly the same one generating the cold intrusions associated with near gale to gale northeasterlies in the same region in winter, when the Persian trough and ISM do not exist.
Bearing in mind the above findings, it is important to emphasize that the case studies analyzed in this article clarify that there appears to be no indication of a link between the onset of an Etesian outburst and the Persian trough. This aspect, introduced by this article, fills a gap in the international meteorological literature. This is obvious for the Balkans pressure variability only, which by itself is responsible for the appearance of new episode (new spell) of intensified Etesian winds, which occurs when a new surface anticyclone arrives over the Balkans behind a cold front, whereas the surface pressure of the Persian trough, being thermal, remains almost seasonally constant. Even in the case of the type c Etesian wind outbursts, where the barometric pressure falls, there is only a contribution from the Rossby’s wave train but none from the Persian trough.
This study shows clearly that the internal Etesian wind system is controlled mainly by synoptic-scale physical mechanisms and smaller atmospheric circulation scales (secondary thermal circulations and planetary boundary layer sub-grid processes) which are usually overshadowed by mean zonal flow. In addition, analyses of real case studies of types s and c Etesian winds outbreaks showing outbursts during their first days, confirm the previous conclusion. It is worth mentioning that the atmospheric circulation mechanisms responsible for creating and maintaining the Antalya local-scale low are already under investigation.
Finally, this article strongly suggests that there is need for further studies of the links between different large-scale systems (e.g., monsoonal circulation systems and those appearing inside the ITCZ) and the Etesian winds system. The valuable research that has already been performed via climatology and idealized numerical models should be completed with systematic real data case studies including Eulerian stream lines and Lagrangian air parcel trajectories, among others, which would prove useful to a complete understanding of the interaction of the various scales of atmospheric circulations in the eastern Mediterranean, considering separately the west and east of 29º E, as this study has revealed.

