


Servicios Personalizados
Revista
Articulo
 Inglés (pdf)
 Artículo en XML
 Referencias del artículo
 Enviar artículo por email
Indicadores
-
 Citado por SciELO
 -
 Accesos
Links relacionados
-
 Similares en
SciELO
Similares en
SciELO
Compartir

 Permalink
Atmósfera
versión impresa ISSN 0187-6236
Atmósfera vol.28 no.4 Ciudad de México oct. 2015
Seasonal prediction of tropical cyclone activity over the north Indian Ocean using the neural network model
Sankar Nath and S. D. Kotal
India Meteorological Department, Mausam Bhavan, Lodi Road, New Delhi 110003, India
Corresponding author: S. K. Nath; e-mail: sankar.nath@imd.gov.in
P. K. Kundu
India Meteorological Department, Mausam Bhavan, Lodi Road, New Delhi 110003, India; Department of Mathematics, Jadavpur University, Kolkata 700032, India
Received: February 17, 2015; accepted: August 5, 2015
Resumen
Se desarrolla un modelo de red neuronal para predecir el número estacional de ciclones tropicales (CT) que se desarrollan en el Océano Índico septentrional después de la estación del monzón (octubre a diciembre). Se analizan la frecuencia de los CT y las variables climáticas de gran escala derivadas de la base de datos de reanálisis del NCEP/NCAR con resolución de 2.5 x 2.5° para el periodo 1971-2013. Se utilizaron datos del periodo 1971-2002 para desarrollar el modelo, y éste se probó con datos de muestreo independientes del periodo 2003-2013. Se eligieron cinco variables climáticas de gran escala (altura geopotencial a 500 hPa, humedad relativa a 500 hPa, presión superficial en el mar, y viento zonal a 700 y 200 hPa para el mes previo [septiembre]) como predictores para aplicar un análisis de correlación. Con base en algunos parámetros estadísticos de desempeño, se evalúa la eficacia del modelo de redes neuronales y los resultados se comparan con el modelo lineal de regresión múltiple. Los resultados indican que el número de ciclones tropicales calculado por medio de ambos modelos es muy similar al número real de ciclones ocurridos en cada año. Sin embargo, los resultados del modelo de redes neuronales fueron superiores a los del modelo linear de regresión múltiple, de modo que esta técnica de predicción de ciclones tropicales puede ser muy útil para propósitos operativos de predicción.
Abstract
A neural network (NN) model is developed to predict the seasonal number of tropical cyclones (TCs) formed over the north Indian Ocean during the post-monsoon season (October, November, December). The frequency of TCs and the large scale climate variables derived from the NCEP/NCAR reanalysis dataset of resolution 2.5° x 2.5o have been analyzed for the period 1971-2013. Data for the years 1971-2002 have been used for the development of the model, which is tested with independent sample data for the years 2003-2013. Applying correlation analysis, five large-scale climate variables, namely geopotential height at 500 hPa, relative humidity at 500 hPa, sea level pressure, and zonal wind at 700 hPa and 200 hPa for the antecedent month September are selected as predictors. Based on some performance parameter statistics, the performance of the NN model is evaluated and the results are compared with the multiple linear regression (MLR) model. From the results it is inferred that the predicted tropical cyclone count by both models is very close to the actual counts for both periods. However, the NN model is found to be superior to the MLR model. This tropical cyclone prediction technique may be useful for operational prediction purposes.
Keywords: Tropical cyclone, seasonal prediction, neural network, artificial neural network, multiple linear regression, jackknife, north Indian Ocean.
1. Introduction
A natural hazard affects the environment and leads to huge economic losses and casualties. Tropical cyclones (TCs) are some of the most frequent and destructive natural hazards in TC-prone areas. In 2008, tropical cyclone Nargis was the second deadliest disaster of the decade in Myanmar. It caused 138 366 human causalities (Vos et al., 2009). So, disaster managers and planners needed high quality forecasts to save human lives and prevent property losses. Tropical cyclone activity depends on both thermodynamical and dynamical factors, which is also reported by several researchers (Palmen, 1948; Gray, 1968; Elsberry and Jeffries, 1996; DeMaria et al. , 2001). The seasonal TC activity forecasts for the Australian and North Atlantic regions were first made by Nicholls (1979) and Gray (1984 a, b), respectively. Since then, several methodologies have been adopted for the seasonal TC activity forecast in different TC-prone areas of the world, such as Poisson regression models (Elsner and Schmertmann, 1993; Lehmiller et al., 1997; Kim et al., 2010), Bayesian regression models (Elsner and Jagger, 2004, 2006; Chu and Zhao, 2007; Chu et al., 2010; Lu et al., 2010; Werner and Holbrook, 2011), projection pursuit regression (Chan et al., 1998, 2001). However, studies of the neural network (NN) approach to seasonal cyclone activity forecasting are limited.
The application of the NN model in the field of meteorology has been discussed by several researchers (Pozzi et al., 2000; Richaume et al., 2000; Schroeder et al., 2002; Bourras et al., 2003; Mitra et al., 2010). McCann (1992) and Kuligowski and Barros (1998) found that this model is superior as compared to the traditional weather prediction model. The NN model also has been applied to project future heavy rainfall events for Oahu, Hawaii (Norton et al., 2011). Other studies also show that the prediction of cyclone intensity has been improved by the artificial neural network (ANN) over the linear regression method (Baik and Hwang, 1998; Baik and Paek, 2000; Ramirez and Veneros, 2004; Ramirez and Castro, 2006).
There are several studies on the genesis (Roy Bhowmik, 2003; Kotal et al., 2009; Nath et al., 2013) and intensity prediction (Dvorak, 1975; Roy Bhowmik et al., 2007; Kotal et al., 2008) of cyclones over the Indian Sea. However, in comparison the Indian Sea has received relatively limited attention, given that several studies have documented the seasonal prediction (including the NN method approach) of cyclones in other ocean basins of the world. Hence, an attempt has been made to develop an NN model to forecast seasonal TC activity over the north Indian Ocean (NIO).
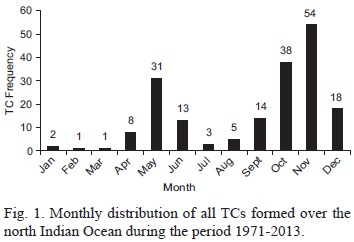
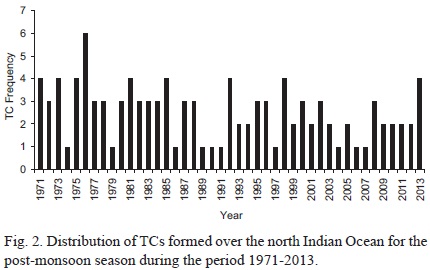
In the present study, the NN and multiple linear regression (MLR) using jackknife approaches have been used to predict the seasonal activity of TCs in the post-monsoon season (October, November, December) over the NIO, which has a pre-monsoon (March, April, May) and a post-monsoon (October, November, December) cyclone season. Figure 1 shows the monthly distribution of TC frequency formed over the NIO from 1971 to 2013. The large inter-seasonal contrast is evident, with a highest peak occurring in November. The total frequency of TCs for the post-monsoon season from 1971 to 2013 over the NIO is presented in Figure 2.
The structure of this paper is as follows: data and methodology are described in section 2; procedures for selecting predictors are explained in section 2.1; model formulation is described in section 2.2; model evaluation is presented in section 3, and the concluding remarks are given in section 4.
2. Data and methodology
The monthly tropical cyclone series of the north Indian Ocean from 1971 to 2013 was obtained from the frequency of cyclone disturbances archives of the India Meteorological Department (IMD) New Delhi (www.imd.gov.in), which is a recognized Regional Specialized Meteorological Centre (RSMC) for tropical cyclone warning advisories by the World Meteorological Organization (WMO). Monthly sea level pressure, zonal wind data at 700 hPa and 200 hPa, geopotential height at 500 hPa, and relative humidity at 500 hPa over the region under analysis were derived from the NCEP/NCAR reanalysis dataset for developing the model. Horizontal resolution of the dataset is 2.5° latitude x 2.5° longitude.
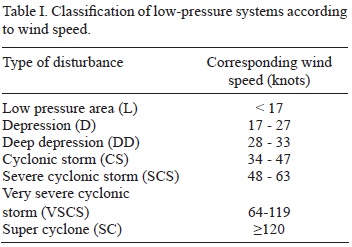
Low-pressure systems over the Indian region are classified based on the maximum sustained wind speed and the pressure deficit/number of closed isobars associated with the system. The pressure criteria are used when the system is over land and wind criteria is used when the system is over the sea. The system is classified as low if there is one closed isobar in the interval of 2 hPa; as a depression if there are two closed isobars; as a deep depression if there are three closed isobars; and as a cyclonic storm if there are four or more closed isobars. The detailed classification based on the wind criteria (WMO, 2014) is given in Table I. Considering wind criteria, systems with wind speed of 17-27 knots are called depression and low pressure systems with maximum sustained 3-min surface winds between 28 and 33 knots are called deep depressions. Systems with maximum sustained 3-min surface winds of 34 knots or more are called cyclonic storms, which may be classified as cyclonic storms, severe cyclonic storms, very severe cyclonic storms and super cyclones.
2.1 Procedures for selecting predictors
The modulations of seasonal TCs activity by large-scale environmental conditions have been reported by several researchers (Gray, 1977; Watterson et al., 1995; Chu and Zhao, 2007). In the present study correlation analysis between seasonal TC occurrences and the mean environmental parameters (e.g., relative humidity, wind) for the post-monsoon season over the region (50-140° E, 20° S-25° N) is used to identify physical relationships. After examining the correlation between large-scale environmental parameters and TC counts, a correlation analysis between seasonal TC occurrences for the preceding month (September) is performed to find the stability of large-scale environmental parameters. The stable parameters for September are derived as predictors. Significant correlation areas have been demarcated for each parameter. Areas with fairly large spatial extent (at least 10° latitude x and 15° longitude) have been selected in order to avoid the correlation bullseyes that sometimes exist in the NCEP/NCAR reanalysis (Klotzbach and Philip, 2008). When correlations over a particular area between 50-140° E, 20° S-25° N that are found to be statistically significant at the 95% confidence level, the parameter over the area is retained as a potential predictor variable. For a sample size of 32, this critical value is |0.35| when a two-tailed t-test is applied. The contour plot for the correlation between the seasonal TC frequencies over the north Indian Ocean for the month of September and all the predictors for critical domains are shown in Figure 3a-e. Figure 3a shows the correlation between the seasonal TC counts and the antecedent September month geopotential height at 500 hPa (GPH500). A strong negative correlation pattern is found in most of the Bay of Bengal and China Sea in the region under analysis. The pattern may persist and support convection and the development of TCs.
Figure 3b displays the correlation between seasonal TC counts and mid tropospheric relative humidity at 500 hPa (RH500) during the antecedent month. Critical regions with significantly high positive correlations are found over the Philippine Sea and the northwest of the south China Sea. As a result of this positive correlation, higher moisture content over the aforementioned regions could be expected, leading to more TCs over the north Indian Ocean during the post-monsoon season.
Figure 3c shows the correlation between seasonal TC counts and the SLP during the antecedent month. A critical area with negative correlation is found in most of the Bay of Bengal for the region under analysis. This result is physically reasonable as lower SLPs trigger higher TC frequencies.
Figure 3d shows the correlation between seasonal TC counts and zonal wind at 700 hPa (U700) for the antecedent month. Critical regions with significant positive correlations are found in the Arabian Sea region.
Figure 3e shows the correlation between seasonal TC counts and zonal wind at 200 hPa (U200) for the antecedent month. Critical regions with significant negative correlations are found in the Arabian Sea and the adjoining south Indian Ocean region. Accordingly, strong zonal currents at the upper level and weak at lower levels may disrupt the development of convection and cyclonic systems. It is clearly indicated that strong upper and weak lower level winds during September over the critical regions were instrumental for lower TC activity over the NOI.
2.2 Model formulation
2.2.1 Multiple linear regression model
The MLR model is developed using the multiple linear regression technique:

where y is the dependent variable (predictant) and x1, x2,...xn are independent variables (predictors). a1, a2..., an are regression coefficients. The five large-scale climate variables, namely geopotential height at 500 hPa, relative humidity at 500 hPa, sea level pressure, and zonal wind at 700 hPa and 200 hPa for the antecedent month (September) are used as predictors and the seasonal number of tropical cyclones formed over the north Indian Ocean during the post monsoon season is used as predictand.
The jackknife method was applied to all 32 years, with one year being removed. Thus, the model was developed for the remaining 31 years and tested on the missing year. In this way 32 predictions were obtained. Predicted values were then correlated with observations and the overall forecast skill have been determined for the training period. The skill of the testing period is evaluated using 32 years training period data as input.
2.2.2 Neural network model
The neural network technique proposed here is based on the three-layer back propagation for seasonal TC frequency, using the same predictors from the multiple linear regression model and the Levenberg-Marquardt training algorithm, as shown in Figure 4. The mean square error is minimized (Ma-qsood et al., 2002; Marquardt, 1963) in this method. This optimization method is more powerful than the conventionally used gradient descent techniques (E1-Bakry, 2003; Hagan and Mehnaj, 1994; Cigizo-glu and Kisi, 2006). It has now become a standard technique for nonlinear least-square problems, widely adopted in various disciplines including atmospheric sciences for dealing with data-fitting applications (Mitra et al., 2010; Ustaoglu et al., 2008; Young, 2006; Chase et al., 2011). Considering its popularity and robustnes, the Levenberg-Marquardt algorithm (LMA) is adopted in this paper. The model contains five neurons, which correspond to the predictors used in the MLR, five neurons in the hidden layers and one neuron in the output layer, namely the seasonal number of tropical cyclones formed over the north Indian Ocean during the post monsoon seasons. The hidden layer and transfer function are determined during the network architecture design, considering that there should not be any significant overfitting and the network should have better performance. In this study, five hidden neurons are found to produce the best result.
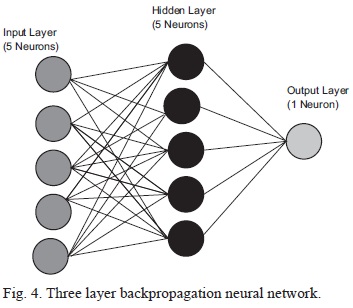
The neuron in the output layer corresponds to the predicted TC frequency. The optimum network performance has been achieved using the tan-sigmoid transfer function from the input layer to the hidden layer and the linear transfer function from the hidden layer to the output layer. The NN model is developed using 32 year data samples. A training set and independent data samples from the remaining 11 years are used for model testing.
3. Model evaluations
In this section, the skill level of both predictive models discussed above is evaluated. The performance of the model has been evaluated by the following parameters: mean value of the actual observation (O), standard deviation of the actual observation (So), mean value of the predicted variable (P), standard deviation ofthe predicted variable (Sp), and estimated values of the predicted variable ( ) under the least-squares regression = α + b Oi. The performance of the model is also evaluated by the "index of agreement" (d), and the systematic and unsystematic mean square errors (MSEsx and MSEu, respectively). As proposed by Willmott (1982), the index of agreement and the systematic and unsystematic mean square errors are defined as:
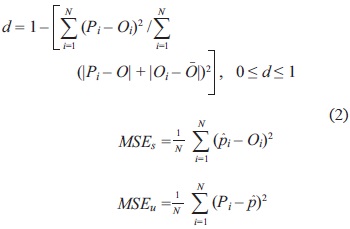
where N is the number of observations. The better predictive models would be identified as those having lower systematic errors, unsystematic errors nearer to the RMSE, and a higher index of agreement (Willmott, 1982). In his study, Willmott (1982) also suggested that RMSEu can be interpreted as a measure of accuracy. In the present study, all the parameters described above and the mean absolute error (MAE) are computed to evaluate and compare the performance of the developed models described in the preceding section. The statistics of these parameters for the training and testing periods are presented in Tables II and III, respectively.
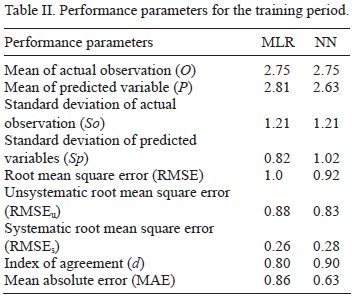
3.1 Model performance during the training period (1971-2002)
Table II shows that statistic values P and Sp are close to the corresponding observed parameters O and So in both models, but in the MLR model P is closer to O as compared to the NN model, where Sp is closer to So. A more comprehensive evaluation has been made based in difference indices. With respect to MAE, there is a clear distinction between both models. The value of MAE is lower in the NN model as compared to the MLR model, which is also suggested by the RMSE. RMSE and RMSEu are higher and lower, respectively, in the NN model. This implies that the NN model is better than the MLR model, as explained by Willmott (1982). The value of Willmott's index d also indicates that the NN model has a higher value of d than the MLR model. It can therefore be inferred that the NN model produces forecasts in better agreement with the actual TC activity formed over NIO than the MLR model, which is evident in Figure 5.
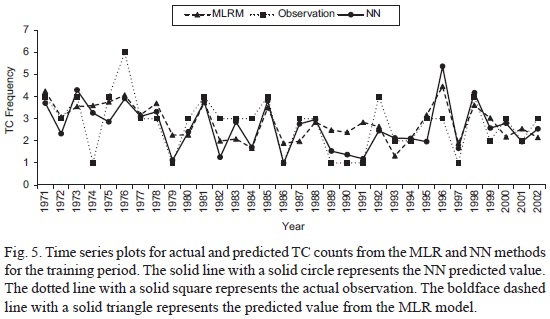
Figure 5 schematically presents time series plots for actual and predicted TC counts from the MLR and NN methods. It is clear from this figure that in some test cases the predicted values differ from the actual values, whereas some of them almost coincide with the actual values. Analyzing Figure 5, it can be inferred that there is somewhat a close association between the actual TC counts and those predicted by both the NN and MLR models. However, the NN predicted TC counts are closer to actual observations.
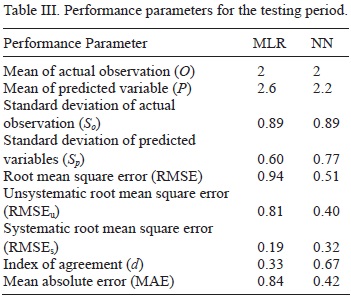
3.2 Model performance during the testing period (2003-2013)
Table III shows that statistics P and Sp are close to the corresponding observed parameters O and So in both models, which is also found in the training period. The value of MAE is lower in the NN model as compared to the MLR model, which is also suggested by the RMSE. RMSEs and RMSEu are higher and lower, respectively, in the NN model, which implies that the NN model is better than the MLR model as explained in the training section. Willmott's index d has a higher value in NN model than in the MLR model. It can therefore be inferred that the NN model produces forecasts in better agreement with the actual TC activity formed over NIO than the MLR model, which is evident from Figure 6. It is clear from this figure that in some test cases the predicted values differ from the actual values, whereas some of them almost coincide with the actual values. Analyzing Figure 6, it can be inferred that there is somewhat a close association between actual TC counts and those predicted by both the NN and MLR models.
The comprehensive evaluation of different indices indicates that the NN model is potentially more accurate as compared to the MLR model, which is also found in the training period. The model prediction using independent data samples is also consistent with the prediction of the development period.
4. Concluding remarks
Due to the interannual variations of climate in the tropics and the existence of vast ocean basins, there is no guarantee that the seasonal TC prediction model developed for the Atlantic and Pacific oceans by several research teams is also applicable to the Indian Ocean. Although several studies have documented the seasonal prediction of cyclones for other ocean basins of the world, the Indian seas have received relatively less attention. Therefore, an attempt has been made to predict the seasonal (October, November, December) TC activity over the NIO using the NN technique. The model was developed based on monthly mean sample data of large-scale climate variables from the preceding month (September) for the period 1971-2002, and tested for the independent period 2003-2013. Using the correlation analysis between TC frequency and individual variables over the Indian Ocean and the adjacent sea area, critical regions were demarcated and their data were used to prepare predictor datasets. The five predictors considered here are geopotential height at 500 hPa, relative humidity at 500 hPa, sea level pressure, and zonal wind at 700 hPa and 200 hPa. Based on some performance parameters, the MLR model and the NN model were evaluated. Moreover, the results show that the predicted tropical cyclone count by both models is very close to the actual counts. It is noted that the skill level achieved by the NN model is better than the MLR model. The results of the development period are consistent with the independent period. In conclusion, the model appears to be promising for operational applications of TC prediction for the NIO.
Acknowledgements
The authors are grateful to the Director General of Meteorology, India Meteorological Department, New Delhi for providing all the facilities to carry out this research work. The authors acknowledge the use of NCEP data in this research work. Authors are also grateful with the anonymous reviewers for their suggestions for improving the paper.
References
Baik J. J. and H. S. Hwang, 1998. Tropical cyclone intensity prediction using regression method and neural network. J. Meteorol. Soc. JPN 76, 711-717. [ Links ]
Baik J. J. and J. S. Paek, 2000. A neural network model for predicting typhoon intensity. J. Meteorol. Soc. JPN 78, 857-869. [ Links ]
Bourras D., W. T. Liu and E. W. Tang, 2003. Evaluation oflatent heat flux fields from satellites and models during SEMAPHORE. J. Appl. Meteorol. 42, 227-239. [ Links ]
Chan J. C. L., J. Shi and C. M. Lam, 1998. Seasonal forecasting of tropical cyclone activity over the western North Pacific and the South China Sea. Weather Forecast.13, 997-1004. [ Links ]
Chan J. C. L., J. Shi and K. S. Liu, 2001. Improvements in the seasonal forecasting of tropical cyclone activity over the western North Pacific. Weather Forecast. 16, 491-498. [ Links ]
Chase W. N., C. Pao-Shin, A. S. Thomas, 2011. Projecting changes in future heavy rainfall events for Oahu, Hawaii: A statistical downscaling approach. J. Geophys. Res. 116, D17110, doi:10.1029/2011JD015641. [ Links ]
Cigizoglu H. K. and O. Kisi, 2006. Methods to improve the neural network performance in suspended sediment estimation. J. Hydrol. 317, 221-238. [ Links ]
Chu P. S. and X. Zhao, 2007. A Bayesian regression approach for predicting tropical cyclone activity over the central North Pacific. J. Climate 20, 4002-4013. [ Links ]
Chu P. S., X. Zhao, C. H. Ho, H. S. Kim, M. M. Lu and J. H. Kim, 2010. Bayesian forecasting of seasonal typhoon activity: A track-pattern-oriented categorization approach. J. Climate 23, 6654-6668. [ Links ]
DeMaria M., J. A. Knaff and H. C. Bernadette, 2001. A tropical cyclone genesis parameter for the tropical Atlantic. Weather Forecast. 16, 219-233. [ Links ]
Dvorak V. F., 1975. Tropical cyclone intensity analysis and forecasting from satellite imagery. Mon. Weather Rev. 103, 420-430. [ Links ]
El-Bakry M.Y., 2003. Feed forward neural networks modeling for K-P interactions. Chaos Solitons Fract. 18, 995-1000. [ Links ]
Elsberry R. L. and R. Jeffries, 1996. Vertical wind shear influences on tropical cyclone formation and intensification during TCM-92 and TCM-93. Mon. Weather. Rev. 124, 1374-1387. [ Links ]
Elsner J. B. and T. H. Jagger, 2004. A hierarchical Bayesian approach to seasonal hurricane modeling. J. Climate 17, 2813-2827. [ Links ]
Elsner J. B. and C. P. Schmertmann, 1993. Improving extended range seasonal predictions of intense Atlantic hurricane activity. Weather Forecast. 8, 345-351. [ Links ]
Elsner J. B. and T. H. Jagger, 2006 Prediction models for annual U.S. hurricane counts. J. Climate 19, 2935-2952. [ Links ]
Gray W. M., 1968. Global view of the origin of tropical disturbances and storms. Mon. Weather Rev. 96, 669-700. [ Links ]
Gray W. M., 1977. Tropical cyclone genesis in the western North Pacific. J. Meteorol. Soc. JPN 55, 465-482. [ Links ]
Gray W. M., 1984a. Atlantic seasonal hurricane frequency. Part I. El Niño and 30 hPa quasi biennial oscillation influences. Mon. Weather Rev. 112, 1649-1668. [ Links ]
Gray W. M., 1984b. Atlantic seasonal hurricane frequency. Part II. Forecasting its variability. Mon. Weather Rev. 112, 1669-1683. [ Links ]
Hagan M. T. and M. B. Mehnaj, 1994. Training feedforward networks with the Marquardt algorithm. IEEE Transactions on Neural Networks 5, 989-993. [ Links ]
Kim H. S., H .H. Chang, P. S. Chu and J. H. Kim, 2010. Seasonal prediction of summertime tropical cyclone activity over the East China Sea using the least absolute deviation regression and the Poisson regression. Int. J. Climatol. 30, 210-219. [ Links ]
Klotzbach J. and J. Philip, 2008. Refinement to Atlantic basin seasonal hurricane prediction from 1 December. J. Geophys. Res. 113, D17109, doi:10.1029/2008 D010047.1-11. [ Links ]
Kotal S. D., S. K. Roy Bhowmik, P. K. Kundu and A. K. Das, 2008. A statistical cyclone intensity prediction (SCIP) model for Bay of Bengal. J. Earth Syst. Sci. 117, 157-168. [ Links ]
Kotal S. D., P. K. Kundu and S. K. Roy Bhowmik, 2009. Analysis of cyclogenesis parameter for developing and nondeveloping low-pressure systems over the Indian Sea. Nat. Hazards 50, 389-402. [ Links ]
Kuligowski R. J. and A. P. Barros, 1998. Experiments oin short-term precipitation forecasting using artificial neutral networks. Month Weather Rev. 126, 470-482. [ Links ]
Lehmiller G. S., T. B. Kimberlain and J. B. Elsner, 1997. Seasonal prediction models for North Atlantic basin hurricane location. Mon. Weather Rev. 125, 1780-1791. [ Links ]
Liu K. S. and J. C. L. Chan, 2003. Climatological characteristics and seasonal forecasting of tropical cyclones making landfall along the South China coast. Mon. Weather Rev. 131, 1650-1662. [ Links ]
Lu M. M., P. S. Chu and Y. C. Lin, 2010. Seasonal prediction of tropical cyclone activity in the vicinity of Taiwan using the Bayesian multivariate regression method. Weather Forecast. 25, 1780-1795. [ Links ]
Marquardt D. W., 1963. An algorithm for least-squares estimation of non-linear parameters. J. Soc. Ind. Appl. Math. 11, 431-441. [ Links ]
Maqsood I., M. R. Khan and A. Abraham, 2002. Intelligent weather monitoring systems using connectionist models. Neural, Parallel & Scientific Computations 10, 157-178. [ Links ]
McCam D. W., 1992. A neural network short-term forecast of significant thunderstorm. Weather Forecast. 7, 525-534. [ Links ]
Mitra A. K., P. K. Kundu, A. K. Sharma and S. K. Roy Bhowmik, 2010. A neural network approach for temperature retrieval from AMSU-A measurements onboard NOAA-15 and NOAA-16 satellites and a case study during Gonu cyclone. Atmosfera 23, 225-239. [ Links ]
Nath S., S. D. Kotal and P. K. Kundu, 2013. Analysis of a genesis potential parameter during pre-cyclone watch period over the Bay of Bengal. Nat. Hazards 65, 2253-2265. [ Links ]
Nicholls N., 1979. A possible method for predicting seasonal tropical cyclone activity in the Australian region. Mon. Weather Rev. 107, 1221-1224. [ Links ]
Norton C., P. S. Chu and T. A. Schroeder, 2011. Estimating changes in future heavy rainfall events for Oahu, Hawaii: A statistical downscaling approach. J. Geophys. Res.-Atmos. 116, D17110, doi:10.1029/2011JD015641. [ Links ]
Palmen E. N., 1948. On the formation and structure of the tropical hurricane. Geophysica 3, 26-38. [ Links ]
Pozzi M., B. A. Malmgren and S. Monechi, 2000. Sea surface temperature and isotopic reconstruction from nannoplankton data using artificial neural networks. Palaeontol. Electron. 3, 4-14. [ Links ]
Ramirez N. D. and A. Veneros, 2004. Upper air information and neural networks to estimate hurricane intensity. 26th Conference on Hurricanes and Tropical Meteorology. American Meteorological Society, Miami, May 2-7. [ Links ]
Ramirez N. D. and J. M. Castro, 2006. A transfer function model to predict hurricane intensity. 27th Conference on Hurricanes and Tropical Meteorology. American Meteorological Society, Monterey, Ca., April 23-28. [ Links ]
Richaume P., F. Badran, M. Crepon, C. Mejia, H. Roquet and S. Thiria, 2000. Neural network wind retrieval from ERS-1 scatterometer data. J. Geophys. Res. 105, 8737- 8751 [ Links ]
Roy Bhowmik S. K., 2003. An evaluation of cyclone genesis parameter over the Bay of Bengal using modal analysis. Mausam 54, 351-358. [ Links ]
Roy Bhowmik S. K., S. D. Kotal and S. R. Kalsi, 2007. An empirical model for predicting intensity of tropical cyclone over the Bay of Bengal. Nat. Hazards41, 447-455. [ Links ]
Schroeder T., J. Fischer, M. Schaale and F. Fell, 2002. Artificial-neural network- based atmospheric correction algorithm: Application to MERIS data. Proc. SPIE. Int. Soc. Opt. Eng. 4892, 124-132. [ Links ]
Ustaoglu B., H. K. Cigizoglu and M. Karaca, 2008. Forecast of daily mean, maximum and minimum temperature time series by three artificial neural network methods. Meteorol. Appl. 15, 431-445. [ Links ]
Vos F., J. Rodriguez, R. Below and D. Guha-Sapir, 2009. Annual disaster statistical review 2008. Centre for Research on the Epidemiology of Disasters (CRED), Brussels, Belgium, 33 pp. Available at: http://www.cred.be/sites/default/files/ADSR_2009.pdf. [ Links ]
Watterson I. G., J. L. Evans and B. F. Ryan, 1995. Seasonal and interannual variability of tropical cyclogenesis: diagnostics from large-scale fields. J. Climate 8, 3052-3066. [ Links ]
Werner A. and N. J. Holbrook, 2011. A Bayesian forecast model of Australian region tropical cyclone formation. J. Climate 24, 6114-6131. [ Links ]
Willmott C. J., 1982.Some comments on the evaluation of model performance. B. Am. Meteorol. Soc. 63, 1309-1313. [ Links ]
WMO, 2014. Tropical cyclone operational plan for the Bay of Bengal and the Arabian Sea. Technical document WMO/TD No. 84. (Tropical Cyclone Programme Report No. TCP-21.) World Meteorological Organization, Geneva. Available at: www.wmo.int/pages//prog/www/tcp/documents/TCP-21Edition2014_final.pdf. [ Links ]
Young I. R., 2006. Directional spectra of hurricane wind waves. J. Geophys. Res. 111, C08020, doi:10.1029/ 2006JC003540. [ Links ]

