


Servicios Personalizados
Revista
Articulo
 Inglés (pdf)
 Artículo en XML
 Referencias del artículo
 Enviar artículo por email
Indicadores
-
 Citado por SciELO
 -
 Accesos
Links relacionados
-
 Similares en
SciELO
Similares en
SciELO
Compartir

 Permalink
Atmósfera
versión impresa ISSN 0187-6236
Atmósfera vol.23 no.2 Ciudad de México abr. 2010
The interannual variability of midwestern temperatures and precipitation as related to the ENSO and PDO
K. BIRK
Department of Soil, Environmental and Atmospheric Sciences, University of Missouri–Columbia, Columbia, Missouri, and National Weather Service, Bismarck, ND, USA
A. R. LUPO, P. GUINAN
Department of Soil, Environmental and Atmospheric Sciences, University of Missouri–Columbia, Columbia, Missouri, USA. Corresponding author: A. R. Lupo; e–mail: LupoA@missouri.edu
C. E. BARBIERI
Department of Parks, Recreation, and Tourism, University of Missouri–Columbia, Columbia, Missouri, USA
Received May 18, 2009 ; Accepted September 25, 2009
RESUMEN
Se examinaron registros históricos de temperatura y precipitación en la región del Medio Oeste de los EUA a fin de determinar si la variabilidad interdecadal asociada con la Oscilación Decadal del Pacífico (PDO por sus siglas en inglés) modula la variabilidad interanual de los climas de esta región asociados con la Oscilación del Sur El Niño (ENSO por sus siglas en inglés). El análisis de espectro de poder demuestra que existen variabilidades significativas asociadas al ENSO en series temporales de 3 a 7 años e interdecadales entre 12 y 15 años; hay además un período de aproximadamente 21 años entre estas series temporales. Se sugiere que esta variabilidad interdecadal representa periodos temporales en los cuales la PDO actúa como modulador de la variabilidad de los climas del Medio Oeste asociada al ENSO. Así mismo, en este estudio se determinó que la variabilidad de los climas del Medio Oeste asociada con el ENSO era bastante pronunciada durante los períodos +PDO (p. ej., 1925–1946 y 1977–1999) y mucho menor durante los períodos –PDO (p. ej., 1900–1924; 1947–1976; and 2000 al presente). Estos resultados sugieren que los impactos del ENSO en los climas del Medio Oeste varían en escalas interdecadales. Más aún, los climas estacionales registrados durante un ENSO en particular, no necesariamente se repetiran en otros ENSO similares posteriores. En consecuencia, desde una perspectiva operacional, la variabilidad interdecadal deber ser considerada como sobrepuesta a las variaciones interanuales a fin de obtener pronósticos estacionales de largo plazo más precisos.
ABSTRACT
Long–term temperature and precipitation records in the Midwest are examined in order to determine if interdecadal variability associated with the Pacific Decadal Oscillation (PDO) acts to modulate the El Niño Southern Oscillation (ENSO) related interannual variability of Midwestern climates. Power spectrum analysis demonstrates that significant ENSO related variability between 3 and 7 years as well as significant interdecadal variability between 12–15 years and at approximately 21 year time periods exist within these time series. This interdecadal variability is suggested to represent the time periods in which the PDO acts to modulate the ENSO–related variability of Midwestern climates. In addition, it was determined in this study that the ENSO–related variability of Midwestern climates was very high during the +PDO periods (e.g., 1925–1946 and 1977–1999) and was much lower during the –PDO (e.g., 1900–1924, 1947–1976, and 2000 to present) periods. These results suggest that the ENSO–related impacts on Midwestern climates change on interdecadal time scales. Further, the seasonal climates experienced during a particular ENSO event may not necessarily mimic those of another similar ENSO event in the future. Thus, from an operational point of view, in order to obtain more skillful seasonal long–term forecasts, the interdecadal variability should be considered as being superimposed upon the interannual variations.
Keywords: El Niño, Pacific Decadal Oscillation, temperature variability, precipitation variability.
1. Introduction
Natural climate variability has been studied extensively in recent years, including an examination of El Niño Southern Oscillation (ENSO) related variability of: Atlantic hurricane activity (O'Brien et al., 1996; Bove et al., 1998; Lupo and Johnston, 2000; Lupo et al., 2008a), sea surface temperatures (SST; Mokhov et al., 1997; Mokhov et al., 2004), regional climate (Wunsch, 1999, Eichler and Higgins, 2006), snowfall events (Kunkel and Angel, 1999; Berger et al., 2002; Lupo et al., 2005), blocking events (Wiedenmann et al., 2002; Barriopedro et al., 2006), and mid–western tornado events (Marzban and Schaefer, 2001; Akyuz et al., 2004). It is well documented (Hoskins et al., 1983; Kung et al., 1990, 1992, 1993; Lau, 1997; Lupo and Bosart, 1999) that the variability of SST in the Pacific Basin can substantially impact the general circulation of the atmosphere on short (seasonal) and long time (interannual) scales. Specifically, coupled ocean–atmosphere events such as the ENSO have been linked to significant interannual variations in local and regional climates (Kung and Chern, 1995; Lupo et al., 2007). Similarly, interdecadal variations in the climate of North America have been recently connected with the Pacific Decadal Oscillation (PDO) (Mantua et al., 1997; Minobe, 1997; Gershunov and Barnett, 1998; Lupo et al., 2007).
Anomalous SST distributions alter the heating distributions of the tropical troposphere which significantly influence the general circulation of the atmosphere. This alteration can produce significant changes in regional climates by directly influencing the frequency and intensity of extratropical cyclones (Key and Chan, 1999; Eichler and Higgins, 2006), as well as blocking anticyclones (Wiedenmann et al., 2002). The occurrence or lack of occurrence of blocking during a season can determine the climate characteristics of a region (warm and wet, cold and dry, etc.: Quiroz, 1984; Lupo et al., 2008b). Therefore, understanding the nature of these interannual SST variations as well as how interannual variability itself varies on long time scales, are critical components to consider in long–range seasonal forecasting (one to six months) (Lupo et al., 2007, 2008b).
It has been hypothesized using observations to build models that interdecadal variations in SST's associated with longer–term oscillations can have an impact on the strength and character of ENSO (Tsonis et al., 2007; Swanson and Tsonis, 2009). The study of Lupo et al. (2007), which was an extension of the work done by Kung and Chern (1995), suggested that Pacific Region SST associated with ENSO tend to have different structures during different phases of the PDO. The work of Kung and Chern (1995) used principal component analysis as well as cluster analysis in order to classify monthly mean Pacific Region SST into seven distinct anomaly distributions (A–G). A similar analysis of SST anomalies from 1870–1991 was performed by Enfield and Mestas–Núñez (1999) and Mestas–Núñez and Enfield (1999, 2001).
The seven SST clusters of Kung and Chern (1995) were shown to have a corresponding influence on the mid–level mean atmospheric circulation. They showed that four different SST clusters represented La Niña or neutral conditions, while three were associated with El Niño in the tropical Pacific from 1955–1993 (see their Fig. 1). Then, Lupo et al. (2007, 2008) extended the time period of study to include 1994–2007, and they showed that the SST distributions could be grouped by different phases of the PDO. Specifically, they suggested that strong El Niño and weak La Niña SST distributions commonly occurred during the +PDO (1977–1999). Conversely, stronger La Niña and weaker El Niño SST distributions were predominant during the –PDO. In general, El Niño events during –PDO featured warm SST anomalies residing more within the east–central tropical Pacific.
The Lupo et al. (2007) results suggest that the character of ENSO events are modulated by the long–term SST variability associated with the PDO. Other studies, such as Ebbesmeyer et al. (1991), Mestas–Núñez and Enfield (1999), Hidalgo and Dracup (2003), and others, support a shift in the Pacific Basin's climate regime around 1977, coincident with the PDO shift. There has been some uncertainty in the literature relative to the change in the SST in the Pacific around the year 2000 (Biondi et al., 2001), but the recent study by Swanson and Tsonis (2009) suggest that a climate shift occurred around the years 2001–2002, including changes in the behavior of long–term indexes like the PDO. Minobe (2004) suggested that it may be difficult to establish the timing of, or even if, the later shift has occurred due to the erratic behavior of the PDO in the last 30 years. Nonetheless, the 1977 change, in which Ebbesmeyer et al. (1991) was one of the first to identify, was stronger and more consistently identified than other shifts in the North Pacific climate during the 20th century (Litzow, 2006).
The objective of this research is to determine if changes in the PDO occurrences have significantly affected the ENSO–related interannual variations in mid–western monthly averaged temperatures and precipitation. Mantua et al. (1997), who first used the term PDO, showed that interdecadal variability in the climate of the Pacific Northwest could be found and correlated with ecological variables such as salmon productivity. Then, the hypothesis is that long–term variability associated with the PDO acts to modulate the ENSO–related variability on interdecadal timescales, thus causing significant changes in the ENSO–related variability of Mid–western climates. Torrence and Compo (1998) show interdecadal variability in the ENSO index from 1880 to 1995. This hypothesis can be further supported by studies by Gu and Philander (1995) and Mokhov et al. (2000, 2004), who have shown that the amplitude and period of ENSO tends to be modified on long time scales. Similarly, a study done by Gershunov and Barnett (1998) using sea level pressure (SLP) records as well as heavy daily precipitation (HPF) suggest that a strong El Niño (La Niña) signal occurs during years characterized as a positive (negative) PDO.
In order to support the objective above, monthly averaged temperature and accumulated precipitation climatological records were acquired from several first order observing stations in Missouri and adjacent states, which are presented in section 3. A statistical analysis was performed in order to quantify interannual variability in the Mid–western temperatures and precipitation, and then to identify any relationships that exist between ENSO and PDO variability. In section 4, the methodology of Mokhov et al. (2000, 2004) will be used on the time series of temperature and precipitation to demonstrate that significant ENSO–related interannual and interdecadal variability exists. Then, we will examine the large–scale synoptic patterns and blocking. An extensive study relating the long–term oscillations associated with the PDO with ENSO variability in Mid–western temperatures and precipitation is unique to this study. Knowledge of how ENSO behaves during different phases of the PDO would improve long–range forecasts in our region (Changnon et al., 1999). Improved monthly and seasonal forecasting would benefit the agricultural community as well as longer–term economic decision–making activities such as energy usage planning.
2. Data and methodology
2.1 Data
The dataset used in this analysis contains time series of mean monthly temperature and precipitation records dating back to the early 20th century for various first–order observation stations across Missouri and adjacent states. These data were obtained from the Missouri Climate Center and the Midwestern Regional Climate Center (http://mcc.sws.uiuc.edu). Monthly average temperature was provided by these centers in degrees Fahrenheit, while monthly precipitation was provided in inches. These were then converted to centigrade for temperatures and millimeters for the precipitation measurements.
A total of 24 stations were arbitrarily chosen in order to obtain a broad geographical distribution across the study region (Fig. 1). The region includes all of Missouri (MO), Iowa (IA), southern Minnesota (MN), western Illinois (IL), northern Arkansas (AR), northeastern Oklahoma (OK), eastern Kansas (KS), and southeastern Nebraska (NE); with a total of seven, three, one, five, four, two, one, and one station in each state, respectively. In order for a station to qualify for selection, it had to meet the following criteria: 1) the time series must extend back to 1900, 2) the dataset could not have been missing more than 10 percent of data, and 3) the station must not have moved more than twice during the length of the dataset. Months containing missing data were simply replaced by the time series mean for that particular month, in order to ensure a continuous record that did not change the overall mean of the observed data. A few stations did experience location changes during the late 1960s and early 1970s, but there was no evidence found to suggest that these moves resulted in significant changes in the climatology.
Anomalous seasonal planetary flow regime composites were constructed using the National Center for Environmental Prediction (NCEP) gridded reanalysis (Kalnay et al., 1996). This data set contains gridded reanalysis of 500 hPa geopotential height anomalies stored in 144 x 73 point arrays with a spatial resolution of 2.5° latitude by 2.5° longitude global grid. These data are archived and available online through the Climate Diagnostics Centers website (http://www.cdc.noaa.gov/data/reanalysis/).
2.2 Definitions
A 105 year period was used in this study starting with January 1900 and ending in December 2004. These time periods were chosen because they represent sufficiently long time scales in order to identify and describe significant interannual as well as interdecadal variability. After compiling complete time–series of temperature and precipitation data for each station the data were stratified by the phase of ENSO (El Niño, La Niña, or neutral; Changnon et al., 1999) as well as the PDO phase (Mantua et al., 1997). Simple means were then calculated for each sample. Also, temperature and precipitation distributions were constructed. These distributions were created simply by calculating each month's temperature and precipitation anomaly probabilities using the entire dataset mean and standard deviation for that particular month. For this analysis, both temperature and precipitation anomalies could be approximated a normal distribution, and these were tested at the 90% confidence level (Lupo et al., 2003). Therefore, those months in which the temperature or precipitation anomaly were greater than (less than) one standard deviation were considered to be warm or wet (cold or dry); otherwise they were considered to be normal. This was done in order to identify if large scale variations in the general circulation associated with SST variations in the Pacific basin produced significantly different climate conditions over the region.
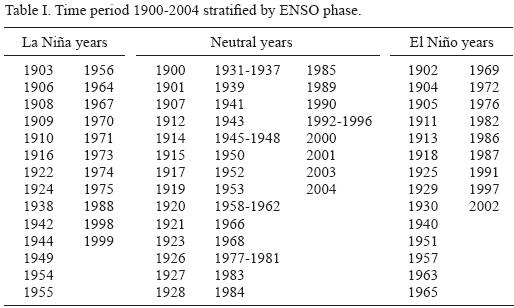
The ENSO definition used in this study follows the Japan Meteorological Agency (JMA) ENSO index. This is a widely accepted definition of ENSO that has been used in many other climatologically studies (O'Brien et al., 1996; Bove et al., 1998; Lupo and Johnston, 2000; Smith and O'Brien, 2001; Berger et al., 2002; Wiedenmann et al., 2002; Akyuz et al., 2004). According to this definition, a particular phase of ENSO (El Niño, La Niña or neutral) is determined based on a 5 month running mean of spatially averaged sea surface temperature (SST) anomalies contained within an area between 4° S–4° N, 150° W–90° W in the tropical Pacific basin. In order for a particular year to be classified as an El Niño (La Niña) year the SST anomaly must be 0.5°C (–0.5 °C) or more (less) for 6 consecutive months including the months of October, November and December. Alternatively, values between 0.5 and –0.5 °C are classified as a neutral year. The ENSO year is defined to start on October 1 and persists through the following September. So, for example, the 1997 El Niño year started in October 1, 1997 and persisted through September 1998. A comprehensive list of ENSO years, binned by ENSO phase, dating back to 1900 are found in Table I, more information regarding the JMA ENSO index can be found on the Center for Ocean and Atmospheric Prediction Studies (COAPS) website (http://www.coaps.fsu.edu).
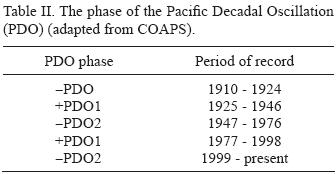
The Pacific Decadal Oscillation (PDO) is a long–term fluctuation in the Pacific Basin SST that has a period of 50 to 70 years (Mantua et al., 1997; Minobe, 1997). Mantua et al. (1997) define the two distinct phases of the PDO, known as the positive PDO and the negative PDO. They refer to the high phase of the PDO as the positive PDO (+PDO). This particular phase is characterized by cold western and north central Pacific waters and warm eastern and tropical Pacific waters. An anomalously deep Aleutian low is also a common characteristic of the +PDO. Conversely, the low phase of the PDO, the negative PDO (–PDO) characterizes directly opposite conditions. A complete list showing the period of each phase of the PDO can be found in Table II.
2.3 Statistical testing
This study performed a simple statistical analysis through the assumption that the distribution of monthly temperature and precipitation were nearly normal. Once years were classified by their corresponding phase of ENSO and PDO, means were tested in order to analyze and compare ENSO, and PDO related variability. A two–tailed "standardized test statistic" (z*) was the technique used for the comparison of the sample means (z*; Neter et al., 1988). Means for the total time series studied served as the "expected" frequencies of occurrence. Distributions of the monthly temperature and precipitation binned by category (e.g. warm–wet, warm–dry, cool–wet, cool–dry, etc.) were tested using the chi–squared goodness of fit test. This test used the total observed distribution as the "expected" frequency following Lupo et al. (1997). This technique is superior to using an approximated distribution because these may not accurately represent the actual distributions. All statistical tests assumed the null hypothesis, that no prior relationship is present among the variables being tested and confidence levels of 90% or higher are considered to be significant results here.
2.4 The method of cycles
The methodologies used here to demonstrate interannual and interdecadal variability from a one–dimensional time series are described in Mokhov et al. (2004), and will be called the method of cycles following Mokhov and Eliseev (1998), Mokhov et al. (2000) and Federov et al. (2003). The techniques used in these references are based on standard dynamic analysis techniques for physical systems (e.g., Lorenz, 1963). Here we use the time series of temperature and precipitation for each station as was done in Lupo et al. (2007). The basis for this analysis is derived by constructing simple phase plots of the first derivative of the time series versus the time series itself. If ideally, the function represented by the cyclic time series is sinusoidal (or approximately sinusoidal), a simple two–dimensional phase plot of the first derivative versus the time series itself will yield a circular set of trajectories about some mean state (see Lupo et al., 2007, Fig. 1b). However, the phase plot may suggest that there are periods of time during the record where the trajectories imply the monthly mean temperature record was stable (behaves like a damped oscillator), and there are periods of time when the record was unstable. Then, the system behaves similar to that suggested by Fedorov et al. (2003), who examined Pacific Region SST, and they suggest that the ENSO phenomenon behaved like a slightly damped oscillator, but was sustained by modest disturbances. This suggests that there are times in which the long–range monthly temperatures may be more predictable, instead of assuming that the system is solely chaotic or unpredictable at this time–scale.
The main objective here was to identify interannual and interdecadal periodicities within our time series of monthly averaged temperature and precipitation, similar to Mokhov et al. (2000, 2004). However, the filtering procedure used in their references was modified here. Mokhov et al. (2000, 2004) presented results using a two–year running mean filter. The consequences of using a filtering technique of this type is that it either requires having two additional years worth of data in the analysis period, or the loss of two years of information. Instead, here a simple second–order Shapiro (1970) filter is adopted to filter low order variability from the one–dimensional time series. This filtering technique was used since it utilizes the entire length of the time series, with the exception of the two endpoints. The symmetric nature of this filter ensures that there are no phase–shifts of the lower–order variability, and no significant aliasing error. The two–year running mean filter, such as that used in Mokhov et al. (2000, 2004), does not possess these same features (Shapiro, 1970).
Finally, in order to identify the periods of significant variability within the filtered time series, the method of power spectra analysis was performed. The power spectra were calculated using Fourier transformations and wavelets. The wavelet technique is similar to that of Torrence and Compo (1998), and they describe the procedure in more detail. The mother wavelet adopted here is the Morlet wavelet, and has the form;
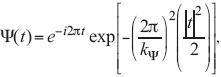

where t in units of a year, and kψ is constant and represents the width of the Gaussian envelope of the mother wavelet. As the value of kψ is increased the width of the Gaussian envelope increases, which causes the time resolution of the wavelet coefficients to be significantly reduced. In order to maintain good time and frequency resolution, the value of kψ was set to 6 following Gu and Philander (1995). The wavelet coefficients were calculated in terms of Fourier transformations of the form:
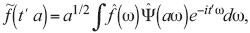

where it is the translation parameter, a is the dilation parameter which determines the width of the wavelet,  is the signal in the frequency domain, and
  is the Fourier transformation of the mother wavelet. Fourier transformations were calculated using the Fast Fourier Transform method. Here, 35 wavelet coefficients were calculated, with each coefficient representing the number of oscillations per year. This number of coefficients was chosen in order to capture both interannual and interdecadal variations. The Morlet wavelet has been used as the wave basis in other published climate studies such as Gu and Philander (1995) and Hu et al. (1998), who studied decadal variations in the amplitude of the Southern Oscillation, and interdecadal variability of precipitation in the central United States, respectively.
3. Analysis of the PDO–related ENSO temperature and precipitation variability
It is important to first note that although studying the ENSO–related variability of local climates is not necessarily a new endeavor, and has been done by many of the previous studies referenced above, longer–term interdecadal PDO–related Midwestern climate variability and, more importantly, its effects on the ENSO–related climate variability has not been the focus of previous studies. In this section, our interest lies in determining if the magnitude and frequency of the climate anomalies associated with each phase of ENSO changed during the opposite phases of the PDO. In other words, we are interested in how the interdecadal variability associated with the PDO act to modulate the ENSO–related interannual variability. It was determined if the ENSO variability was greater within one phase of the PDO, or if for example El Niño (La Niña) events were amplified during +PDO (–PDO).
Considering this, the strength of the monthly temperature and precipitation departures as well as the frequency of monthly means above or below the long term mean during ENSO years were then examined within each PDO time frame. It is noteworthy, however, that the time period from 1900 to 1909 was excluded from this analysis. These first ten years were not included due to PDO phase uncertainty prior to 1910. Therefore, the total sample here includes: 10 (5) +PDO El Niño (La Niña) years, 10 (17) –PDO El Niño (La Niña) years, and 29 +PDO (24 –PDO) neutral years. Also, in the discussion below we will use stations that best represent the climatological character of particular sub–regions discussed, and the years used for each station across the entire region are consistent with the information presented above (see also Tables I, II).
3.1 Positive and negative PDO El Niño events
3.1.1 Temperatures
Midwestern temperature departures and variability with respect to ENSO phase was analyzed in conjunction with the PDO here. A detailed analysis indicates that the +PDO phase demonstrated stronger ENSO–related departures and variability throughout most of the year. This was especially true during the winter, spring and fall seasons for the northern half of the region. By far, the most substantial ENSO–related temperature variability during the +PDO period occurred in the winter season months throughout much of the northern Midwest (northern MO, IA, NE and MN). For example, at the Minneapolis, MN station (Table III), ENSO variability (last column –defined as the largest difference between all combinations of the differences between the El Niño, La Niña, and neutral phase temperature anomalies) during the +PDO period in the winter and spring season, was nearly 2.0° and 1.2° C higher than that found during the –PDO period, respectively. This was especially true during the months of February and April.
Also, ENSO–related temperature departures and variability within other cities of the northern midwestern region (Des Moines, IA and Columbia, MO) proved to be higher during the +PDO period due in large part to the tendency for this region to experience significantly warmer (e.g., at 99 and 90% confidence levels, respectively) than average months during these events (Figs. 2a, b, and Tables IVa, b). This was especially true during the winter, spring and even the summer seasons. Only the fall season months were found to experience significantly cooler mean conditions. Note that Figure 2 shows the temperature departure frequencies during different phases of ENSO and for +PDO. Above (below) normal months are those that fall greater than one standard deviation above (below) the monthly mean.
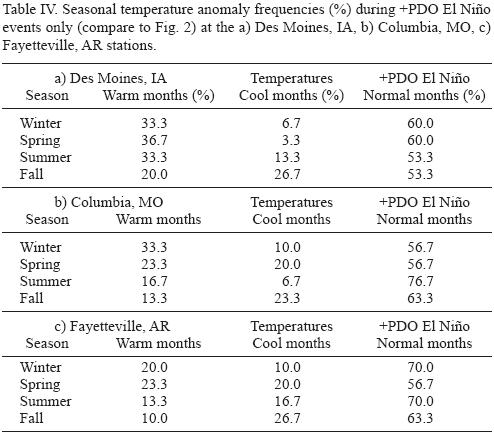
Interestingly, although the ENSO–related temperature variability was found to be substantially higher in the winter season within the northern Midwest during the +PDO1 period, the same could not be said for areas farther south. The most pronounced differences were found to occur during the winter months. During these months, stations within the southern half of the region (e.g., Fayetteville, AR) revealed nearly equal to slightly higher ENSO–related temperature departures and variability during the –PDO period (Table V). Also, an analysis of Figure 2c and Table IVc shows that during +PDO El Niño events monthly temperature frequencies were found to be nearly evenly distributed between warm and cool months throughout the entire ENSO year. In some cases, however, especially within the southwestern portion of the study region a significant cool bias was discovered. For instance, at the Ardmore, OK station (not shown), temperature departures were found to be skewed significantly (95% confidence level) towards cool months throughout the ENSO year. This was especially true during the spring, summer, and fall seasons. The winter season revealed similar, but less robust than those found within the northern midwestern region.
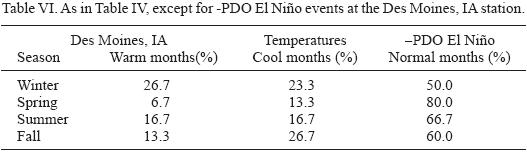
In contrast to their +PDO counterpart, the –PDO El Niño events were found to behave drastically different. An analysis of the monthly temperature frequencies during –PDO El Niño events (black bars in Figs. 2a, b) in the northern and central region, for example, the Des Moines, IA (Table VI) and Columbia, MO stations reveals that the percentage of cool and normal months increase dramatically, while a relative dearth of warm months exist in comparison to +PDO El Niño events. Thus, temperature departure were actually found to show a slight cool bias throughout the year, with temperature frequencies skewed toward cool months (Figs. 2a, b), except for winter. In spite of this, temperature frequencies during the winter season were found to be skewed significantly (90% confidence level) towards warmer months in the northern region. Finally, the temperature distributions during –PDO El Niño events did not deviate significantly from the total time series distributions anywhere within the study region.
3.1.2 Precipitation
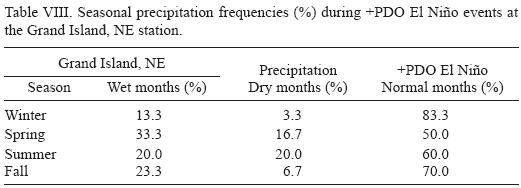
Precipitation frequencies during +PDO El Niño events was found to produce slightly wetter conditions within the extreme southern and western regions (Fig. 3). This was especially true during spring and fall seasons. Annual precipitation in these areas during the +PDO El Niño events were approximately 25.5 to 51 mm above the climatological annual average. None of the wetter than normal annual conditions represented by the Grand Island, NE station (Tables VIIa, VIII) proved to be significant at the 90% confidence level. Wetter than normal conditions, however, were consistent with the equatorward displacement of the storm track over eastern North America (Eichler and Higgins, 2006), and their study encompassed primarily this +PDO time frame. When these frequencies were stratified by season, some stations in the west and south did show statistically significant departures (90–95% confidence levels) associated with wet months during the winter and the spring seasons (not shown).
In contrast, areas encompassing the central, northern and eastern regions were much dryer on an annual basis during +PDO El Niño events, and this was especially true during the spring and summer seasons (Table VIIb, c). In fact, the driest mean annual conditions during the +PDO periods were found to occur in these areas during El Niño events. The most significant dry region was within the central portion of the region (e.g., southeast MO, southern IL and eastern OK). For example, Table VIIb shows that annual precipitation during these events at the Carbondale, IL station was nearly 150 mm dryer than average. Additionally, precipitation frequencies in this general region were found to be associated with dry months (Fig. 3b). The dryer mean conditions proved to be statistically significant at far eastern region stations (90% and 95% confidence levels).
Precipitation during –PDO El Niño events was found to be near average to slightly dryer than average within the southern half of the region and near average to slightly wetter within the northeastern portion of the study region (not shown). None of these results were statistically significant. In the southeastern portion of the region, however, some of the driest mean conditions during the –PDO period occurred, similar to their +PDO counterpart (see Table VIb). The precipitation frequencies within the southeastern region were found to be significantly different (at the 90% confidence levels) from those of the total time series frequencies with more wet months evident than dry months (Fig. 3b).
3.1.3 Temperature and precipitation departures
Furthermore, when temperatures and precipitation departures were considered together as a bivariate frequency distribution, most areas within the eastern two–thirds of the region were found to have more warm/dry months during +PDO El Niño events (e.g., Fig. 4). This was especial true during the late spring and summer months and was the most pronounced within the northern half of this region, which is consistent with Lupo et al. (2007). Meanwhile, areas encompassing the western third of the region were found to contain a nearly equal number of both warm/dry months and cold /wet months. In addition, these bivariate frequencies, especially within the northern half of the region, proved to be significant at 90–99% confidence levels throughout the region (see e.g., Fig. 4a).
The bivariate frequencies during –PDO El Niño events produced nearly an equal number of warm/wet, warm/dry, cold/wet and cold/dry months (Fig. 4a). This was true throughout most of the region, with the exception of the western regions, where slightly more cold/wet months were found at the Manhattan, KS and Grand Island, NE stations (not shown). In general a comparison of Fig. 4a, b shows that the occurrences of warm/dry months and warm/normal precipitation months decreased drastically during –PDO El Niño events. Thus, it is not axiomatic that warm/dry and cold/wet conditions will be associated everywhere or during every phase of ENSO. However, none of the bivariate frequency distributions during –PDO El Niño events proved to be statistically significant anywhere in the region.
3.2 Positive and negative PDO La Niña events
3.2.1 Temperatures
Both –PDO and +PDO La Niña events were found to produce warmer than normal years (Fig. 5), especially within the southern two–thirds of the region during the fall and winter seasons. Mean temperature departures during the +PDO period were found to be slightly warmer than those found during the –PDO period. As an example, Table IXa shows that mean temperatures were 0.3° warmer during +PDO La Niña events at the Fayetteville, AR station. Due to the small sample size of +PDO La Niña events (5 total events), these results were not statistically significant. During –PDO events, however, and especially within the southwest region (Fig. 5c), the results were significant at the 90% confidence level.
Although significantly warmer mean temperatures were discovered during these events a simple analysis of the temperature frequencies during both +PDO and –PDO La Niña events yield that, in general (e.g., Fig 5, Tables IX, X), the distribution between warm and cold months was nearly even. A comparison of the two La Niña temperature frequencies to those of the total time series (white bar in Fig. 5) shows that +PDO La Niña events did not tend to deviate much from the total time series frequency distribution. The –PDO events, on the other hand did deviate significantly for some stations (e.g. 90–99% confidence levels, Table X). The main reason for this lies in the fact that during +PDO La Niña events there was a dearth of extreme events (e.g., warm and cool months) and as a consequence there are far more normal months during these events throughout the ENSO year.
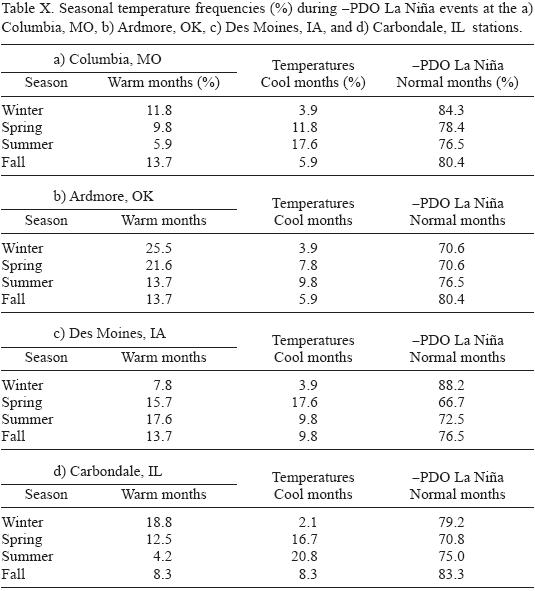
A seasonal analysis of these –PDO events reveals that, during the fall and winter seasons, temperature frequencies were skewed significantly (90–99% confidence levels) towards warm months (e.g., Fig. 5b, c, and Table X). In contrast, the spring and summer seasons were found to be skewed significantly at some stations (90–99% confidence levels) towards cooler months, especially within the southern and eastern portions of the region. The northern Midwest (e.g., IA, NE, and MN, Table Xc) revealed similar results to those found farther south during the spring months, however, during the summer months, temperatures were found to be insignificantly skewed towards warmer months.
3.2.2 Precipitation
Unlike +PDO La Niña events, –PDO La Niña events produced dryer than average conditions throughout most of the entire region, with the exception of the southeastern portion of the region (e.g., Tables VIa, c). Annual precipitation at the Grand Island, NE and Columbia, MO stations were more than 35 mm below average. In contrast, areas encompassing the southeastern portion of the region, however, were found to be wetter than average, especially during the spring and summer seasons (e.g., Table VIIb). Table VIIb shows that annual precipitation at the Carbondale, IL station was nearly 50 mm above average during –PDO La Niña events. In fact, a couple stations in southern MO and AR were more than 125 mm wetter than normal, even so, these were not significant at the 90% confidence level. The lower (higher) mean annual precipitation found in parts of MO and IA (southern IL and eastern AR) proved to be significant (not significant) at 90% confidence levels.
3.2.3 Temperature and precipitation
Finally, the bivariate frequency distributions revealed that –PDO La Niña events were found to produce nearly an equal number of warm/wet, warm/dry, and cold/wet months in most areas (e.g, Fig. 6a). Figure 6a displays the bivariate frequencies of temperatures and precipitation at the Columbia, MO station during –PDO La Niña events. A comparison at this station shows that there were significantly more dry/normal temperature months during –PDO La Niña events. Furthermore, it is apparent that there are far fewer warm/normal precipitation and cold/normal precipitation months during these events. The bivariate frequency distribution (Fig. 6a) proved to be significantly different from the total distribution at a 90% confidence level. Similar results were found at other stations throughout most of the region.
In contrast to the Columbia station, areas within the far southwestern section of the study region (e.g., Ardmore, OK, Fig. 6b), were found to experience significantly more warm/dry months during –PDO La Niña events. The majority of these months were found to occur during the spring and early summer seasons. Also, in addition, another significant difference that is apparent in Fig. 6b is the frequency of cold/normal precipitation months. Overall, there is a relative dearth of these months found at the Ardmore station during –PDO La Niña events. Because of these differences, the bivariate frequency distribution at the Ardmore, OK station during –PDO La Niña events proved to be significant at the 95% confidence level.
3.3 Positive and negative PDO neutral events
3.3.1 Temperatures
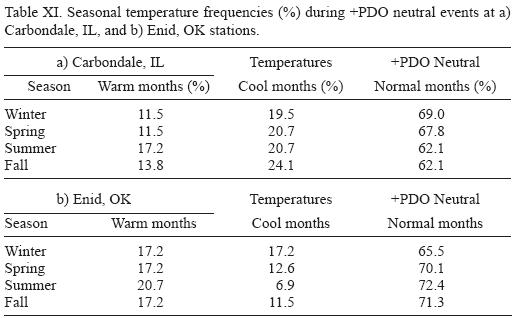
In contrast to El Niño and La Niña events, +PDO1 and –PDO neutral events were found to deviate little from one another (Fig. 7, and Table XI). This was true mainly for the western two thirds of the study region. Mean annual temperature departures within this general region were found to be near to slightly below normal throughout most of the region. Areas in the east (e.g., IL, Fig. 7c), however, experienced slight differences in neutral event temperature departures occurring in different phases of the PDO. For instance, in areas of IL, annual temperatures during +PDO neutral events were found to be cooler than average. In fact, temperatures in many areas in IL and extreme eastern MO were found to be skewed significantly (90–95% confidence levels) towards cool months (Fig. 7c). This was true for all seasons, but was the most pronounced during the winter and fall season months (Table XIa).
During –PDO neutral events just the opposite was true. Table IXb shows that at the Jacksonville, IL station annual temperature departures during +PDO1 La Niña events were 0.6° cooler than average, while during the –PDO, these same events were found to produce annual temperature departures that were 0.4° warmer than average. Only the warmer annual mean temperatures here were significant at 90% confidence level. This indicates that the eastern portion of the study region was more sensitive than the western region to changes in the phase of the PDO during neutral ENSO events.
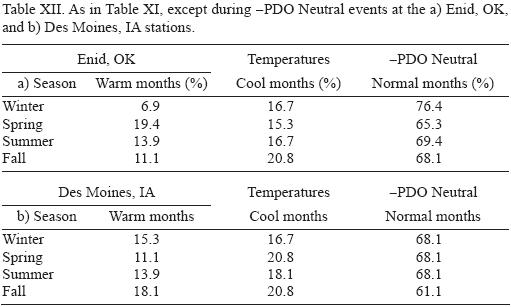
The area encompassing the western half of the study region displayed frequencies skewed slightly towards warm months during +PDO events. The most robust results here were found within the southwest portion of the region, at the Enid, OK station (Fig. 7a). But the total temperature frequencies were not statistically significant. This was true during the spring, summer and fall months, but was the most pronounced and significant at the 90% confidence level during the summer months (Table XIIa).
3.3.2 Precipitation
Precipitation during +PDO and ENSO neutral events was found to be wetter than average throughout the study region. This was especially true during the spring, summer and fall season months. The annual precipitation was found to be anywhere from 25 to 75 mm above average during +PDO neutral events (Tables VIIb, c). These wetter mean conditions also proved to be significant at 90–95% confidence levels at some stations in the entire region. Furthermore, in the east (IA, IL, MO) precipitation was found to be significantly (90% confidence levels) skewed towards wet months. The only exception to this occurred at the Grand Island, NE station (Table VIIa). Here annual precipitation was slightly (7.6 mm) below average.
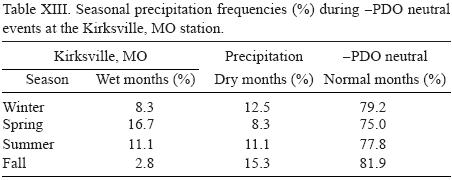
In contrast, precipitation departures during –PDO neutral events was found to be dryer than average throughout the entire region (Table VII). Although this was the case in general, very few areas were found to be more than 38 mm below average during these events. Because of this, the dryer annual mean conditions found did not prove to be significant in most areas during these events. Some precipitation frequencies in MO and northern IL, however, were found to be statistically (e.g., with 90%–99% confidence levels) associated with dryer months (not shown). This was especially true during the winter and fall season months (Table XIII).
3.3.3 Temperature and precipitation
The bivariate frequency distributions during +PDO and ENSO neutral events were shown for the Kirksville, MO, Enid, OK, and the Carbondale, IL stations, adjacent to their respective total time series frequencies in Figure 8. Although the number of warm/wet and warm/dry months showed little difference from the expected number of occurrences, the number of cold/dry and cold/wet months deviated significantly. Specifically, during these events, there was a dearth of cold/dry months at the Kirksville, MO and Enid, OK stations. Areas within the southeast region, however, experienced far more cold/dry months. In addition, the number of occurrences of cold/wet months was found to increase during these events at both the Kirksville, MO and Carbondale, IL stations, while just the opposite was observed at the Enid, OK station.
Considering temperature and precipitation together shows that, in contrast to +PDO neutral events, most areas during –PDO neutral events were found to produce similar occurrences of warm/dry and cold/dry months, fewer warm/wet and cold/wet months (Fig. 9b). Figure 9b shows that at the Farmington, MO station there were fewer overall occurrences of all extreme events (e.g., warm/wet, warm/dry, cold/wet, and cold/dry), and as a consequence, there were more normal occurrences. With the exception of the Springfield station (Fig. 9a) statistically significant at the 95% confidence level) none of the bivariate frequency distributions during –PDO neutral events proved to be significantly different from the total frequencies.
4. Dynamic and synoptic analysis and discussion
4.1 Further analysis of monthly average temperatures and precipitation
The analysis performed in the previous section strongly suggests the existence of significant ENSO–related interannual, as well as PDO–related interdecadal variations in midwestern monthly averaged temperature and precipitation. In order to further understand the nature of these cyclical variations, the methodology of Mokhov et al. (2000, 2004) was used on the monthly average temperature and precipitation data. These techniques are described in detail in Lupo et al. (2007) and in section 2 of this paper.
Figure 10a displays the filtered (see Section 2) time series of monthly average temperatures at the Des Moines, IA station. Also shown are the phase plots of the first time derivative of temperature versus the temperature time series itself (Fig. 10b). Figure 10a suggests that the temperature series contains variability on different time scales. The phase plot trajectory (Fig. 10b) displays time periods in which the system appears to be approximately periodic. In this diagram a sinusoidal oscillation (e.g., ideal annual cycle) would be represented as circular trajectories around the intersection of the annual mean (abscissa) and the 0.0 line on the ordinate. In addition, there are periods in which the system appears to become unstable (either moving away from 0.0 line on the ordinate or moving up or down the abscissa) and rapidly shifts to a new mean state, before which a new quasiperiodic condition is achieved. A section of the trajectory could be extracted to examine an individual year or years.
In general, the amplitude of the variability of temperatures is high within the northern Midwestern region (Fig. 10a). An examination of Figure 10a suggests there are two outstanding periods evident in the time series in which the variability is relatively high in comparison to other periods. These correspond to the periods of approximately 200 to 500 months (approximately 1917–1942) and again from 900 to 1200 months (approximately 1975–2000). The variance of the temperature series within these two subperiods separately were 1.9 and 1.8°C, respectively. These two time periods occur roughly in conjunction with the +PDO time period, thus suggesting that the ENSO–related temperature variability is higher during the +PDO period. The temperature series in the period between those two eras displayed relatively low variance (1.2 °C) and corresponds roughly to the –PDO period. These results support those found in the previous chapter, which also showed the ENSO–related variability to be higher during the +PDO periods.
Then, in order to identify the significant periodicities within the times series, power spectra were constructed and analyzed. Figure 10c display the power spectrum analysis of the filtered monthly temperature time series constructed using Fourier coefficients, while Figure 10d display the power spectrum constructed from wavelet coefficients for comparison. Also shown in the figures, is the 95% confidence level against a continuum background of white noise, represented by the blue line in the two figures. Not surprisingly, multiple periods of significant variability emerge in the analysis. More specifically, strong ENSO–related variability is found with significant peaks between 3 and 5 years with the strongest peak near 4 years (Fig. 10c). Note, that in the wavelet spectra, the 4 year peak is not present. In addition, significant interdecadal variability is evident in both Figure 10c and 10d at time periods of approximately 9 and 12–15 years (e.g., similar to Enfield and Mestas–Núñez, 1999; Mestas–Núnez and Enfield, 1999), and 20–25 years (same references and similar to Minobe, 2000). The former low frequency variations are suggested here to be representative of interdecadal PDO–related variability. The longest time interval may capture the multidecadal PDO variability (e.g., Minobe, 2000). An analysis of precipitation variability (not shown) yielded similar results to those discussed above for monthly temperature variability, but were also similar to those of Hu et al. (1998) who also analyzed midwestern precipitation using wavelet techniques.
The results discussed here for temperature and precipitation periods of variability match well with the time periods of variability of tropical Pacific Region SST found in the Mokhov et al. (2004) study. Considering this, it is plausible to suggest that local short and long term variations in monthly temperatures identified in this analysis are related to SST variations via the impact they have on altering the general circulation of the atmosphere. This is also further supported by the statistical analysis performed in the previous two.
Other studies have shown stronger +PDO ENSO–related variability for various natural phenomenon related to temperature and/or precipitation such as snowfall in the region (Berger et al., 2002). Also, Gershunov and Barnett (1998) found a stronger El Niño response for this part of North America during the +PDO and this is in agreement with our results here. Further, studies of the general circulation during the +PDO period (Hurrell et al., 1995) demonstrated that some of the strongest ENSO related variability in the troposphere can be found over the North America region, and Mokhov et al. (2004) implies that globally, ENSO is the one of the most robust climate variations in the general circulation on time scales less than a decade.
4.2 Synoptic analysis
In order to qualitatively correlate midwestern climates to SST variations 500 hPa height anomalies are used in order to analyze changes in the general circulation of the atmosphere during different ENSO events. Here, only 500 hPa heights are studied as many studies have shown monthly and seasonal heights to have a strong equivalent barotropic structure (Namias, 1982, 1983; Hoskins et al., 1983; Kung and Chern, 1995; Lupo and Bosart, 1999). In general, a long term mean 500 hPa height field would feature ridging (troughing) over the western (eastern) portion of the North American continent (Lupo and Bosart, 1999).
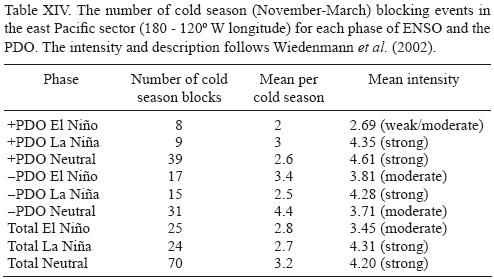
Additionally, studies such as Quiroz (1984) have shown that strong blocking in the east Pacific sector correlates to cold winter weather over the study region. Wiedenmann et al. (2002) show that the Pacific region as a whole tends to experience more blocking during La Niña years, and these tended to be stronger and longer–lived events. Lupo et al. (2008b) correlate cool summers in this study region with active blocking years. Table XIV shows the number and intensity of blocking events for the cold seasons as stratified by ENSO years for the east Pacific sector. Note that overall, there are similar numbers of blocking events regardless of ENSO phase for this sector, however, in concert with the Wiedenmann et al. (2002) results, the blocking events are stronger (and longer lived, not shown) in La Niña and neutral years.
+PDO El Niño events were dominated by statistically significant warmer than average years in the northern half of the Midwest region. This occurred in spite of the fact that the fall season months of October and November were found to be significantly cooler than the climatological average. The warmest anomalies during these events were mainly confined to the winter and spring seasons. However, although these events could not be statistically associated with either wet or dry conditions during the winter season, drier than average conditions were found throughout most of the eastern two thirds of the region during the spring season. Additionally, +PDO El Niño events were statistically found to be associated with wetter than average fall season months.
Figure 11a displays a winter season with mean 500 hPa height anomalies which occurred during the strong 1997 +PDO El Niño event. It is similar in form to the composites for El Niño months of Kung and Chern (1995), and with their F–type SST anomalies (Lupo et al., 1997). During these events, anomalous ridging (toughing) is evident over the northwestern continental United States and over western Canada (eastern Pacific). This corresponds to fewer and weaker blocking events (Table XIV). In addition, anomalous troughing is evident within the south central portion of the US during the winter and spring seasons. This behavior suggests the presence of weaker zonal winds over the US as well as a split flow over the North American continent, with a southerly displaced jet stream, as mentioned by Eichler and Higgins (2006) in their study of ENSO cyclone tracks. Such a pattern acts to displace the polar branch of the upper–level jet to much higher latitudes into northern Canada. This would support the much warmer mean conditions found over the midwestern region during the winter and spring seasons. Meanwhile, the dryer mean conditions found during the winter and spring seasons may be explained by the fact that the moisture and energy generally associated with the subtropical jet is forced farther south along with the subtropical branch of the jet.
The previous fall season (Fig. 11b) shows similar features to the winter and spring seasons over the western portion of the North American continent. However, in contrast to the winter and spring seasons, anomalous troughing is found to occur over much of the eastern half of the North American continent. This acts to enhance the strength of the Icelandic Low (see Kung and Chern, 1995), and as a consequence forces the polar jet to migrate farther south into the Midwestern region during this season. This general behavior would support cooler mean temperatures and can also help explain the tendency for an increase in fall season precipitation, based on the existence of an upper level jet pattern over the study region. Additionally, considering that +PDO years tended to be dominated by the occurrence of more strong El Niño events, this would help explain the upward trend in fall season snowfalls in the middle of the domain found in the Berger et al. (2002) study.
Examining the results found for the 2002 –PDO El Niño event (Fig. 11c) suggests that strong ridging is evident over the western North American continent. Similar behavior was found during +PDO El Niño events above, however, ridging was much stronger and tended to be displaced to the north and west during this –PDO event. This resembles El Niño events with D–type SST anomalies (Kung and Chern, 1995; Lupo et al., 2007). This supported more blocking, especially in the extreme eastern Pacific, but these events were short–lived and weaker than typical winter season events (Table XIV). In addition, stronger negative anomalies are found within the vicinity of the Icelandic low, resulting in anomalous troughing within the central and eastern US. This behavior would support cool and dry conditions over the southern and eastern portions of our study region and warm and wet conditions within the northwestern region. In spite of this, these events tended to produce much cooler seasons than their +PDO counterpart. This was especially true during the winter season, when there were more blocking events (Table XIV). Additionally, these events were found to be associated with much drier than average conditions (see Lupo et al., 2007). This was especially true during the winter season within the southern and eastern portions of the study region.
Overall, the +PDO periods tended to be associated with stronger El Niño events, while the –PDO periods tended to be associated with weaker El Niño events (see also Gershunov and Barnett, 1998; Lupo et al., 2007). Clarke and Li (1995) found that strong El Niño events tended to posses strong warm SST anomalies within the far eastern tropical Pacific, while weaker El Niño events tended to posses weak warm SST anomalies located more in the central tropical Pacific region. Considering this, the difference in location and strength of warm SST anomalies (and hence the diabatic heating, – e.g., Tilly et al., 2008) may be responsible for this shift in the 500 hPa height pattern over the North American continent (Kung and Chern, 1995) as well as the strength of the height anomaly, and hence the drastically different climate conditions found during these two events.
The La Niña winter season height anomalies (Fig. 11d) suggest the tendency for strong and persistent north Pacific blocking (Table XIV) to occur during these events (e.g., Kung and Chern, 1995; Wiedenmann et al., 2002), as suggested by the positive height anomalies within this region. This is representative of a B–type La Niña winter (Kung and Chern, 1995; Lupo et al., 2007). In addition, strong downstream troughing is evident over eastern Canada and the north central and northeastern portions of the continental US. This would act to drive the storm track through the upper Midwestern region, while the southern portion of the Midwest would be dominated by zonal flow. This general behavior could explain the tendency for areas within the far northern portion of the Midwestern region (e.g., NE, IA, and MN) to be cooler than average during the winter season, while areas farther south would tend to be warmer. Additionally, the northwest and zonal flow over the southern Midwestern region during the winter season would most likely posses more Pacific origin moisture (Berger et al., 2002). Coupled with energy from the polar jet located within the northern Midwest would help explain the wetter than average conditions found in the southern and eastern regions.
During the summer season, post La Niña events were found to be significantly cooler and dryer than average throughout most of the region, with the exception of the southeastern region where cool and wet conditions resided. Fig. 11e shows that there is a tendency for summer season ridging over the northwestern two thirds of the continental US consistent with Kung and Chern (1995), while more of a zonal flow sets up within the southeastern US. Considering that all but the southeastern region would be directly down stream of this upper level ridge, it is not to surprising that most of the area experienced significantly cooler and dryer conditions during summer season –PDO La Niña events. The drier than normal conditions over the region agrees with the results of Lupo et al. (2007, 2008b). Meanwhile, areas within the southeastern portion of the region would be far enough downstream of this western US ridge, and more likely to receive an influx of Gulf moisture in order to explain the wetter and cooler mean conditions found there.
Examining the 500 hPa height anomalies during a winter season +PDO neutral event (Fig. 11f) it is apparent that there is a tendency for anomalous ridging to occur over extreme western Canada and Alaska. This is consistent with the composites for E–type anomalies (Kung and Chern, 1995; Lupo et al., 2007). Meanwhile, farther east, anomalous troughing is evident over much of Canada and the central and eastern portions of the continental US. This is consistent with the fact that Neutral events were found to produce some of the coolest mean conditions during the +PDO periods, especially during the winter season. In addition, some of the wettest mean conditions during +PDO periods occurred during neutral events, most likely as a result of a more active storm track running through the region.
However, in contrast to their +PDO counterpart, –PDO neutral events were found to produce much dryer mean conditions within the southern Midwestern region. This was especially during the spring season. Fig. 11g displays the 500 hPa height anomalies which occurred during a spring season –PDO Neutral event. These events also show a strong tendency for relatively strong ridging in western Canada and strong troughing in eastern Canada and the US. This is a pattern similar to Fig. 11c which featured a D–type El Niño winter (Lupo et al., 2007). Also, in addition, there is a tendency for troughing within the southern US, especially in the southwest. This general pattern would suggest the existence of a split upper–level jet over the western two–thirds of the US, with the northern branch of the jet being forced up into northern Canada, while the southern subtropical jet would be forced to run through the tropics in the Gulf of México. A pattern such as this would result in more energetic systems with slightly cooler temperatures within the northern Midwestern region, and much less active storm systems farther south due to a dearth of energy and moisture (consistent with the results of Lupo et al., 2005). Finally, it is noted that the discussion in this section is based on five representative events and not composites, thus the sample size is small.
5. Summary and conclusion
Midwestern climate variability is examined on both interannual and interdecadal time scales through the use of monthly average temperature and precipitation time series from multiple surface observation stations across Missouri and adjacent states. In order to identify the predominant periods of significant variability within these time series, the techniques of Mokhov et al. (2004) were used with a modification of the filtering technique (Lupo et al., 2007). In addition, monthly temperature and precipitation data were binned into their corresponding ENSO phase, as well as by PDO phase similar to the strategy of Changnon et al. (1999). This was done in order to identify whether the interdecadal variability, identified within the time series and associated with the PDO, acts to modulate the ENSO–related variability. Statistical analysis was performed on each sample. First, sample means were calculated for each sample and tested against the entire time series mean values using a simple z* test statistic. Then, temperature and precipitation distributions were constructed for each sample and tested against the entire time series distribution using a chi squared goodness of fit test. Finally, seasonal 500 hPa height anomalies were utilized in order to qualitatively correlate ENSO events to observed Midwestern climates.
Phase plot analysis, as well as the power spectrum analysis embedded within the method of cycles demonstrates that significant ENSO–related interannual and PDO–related interdecadal variability exists within the time series of Midwestern month average temperature and precipitation data. The significant periods of variability identified occurred at approximately 4–5, 12–15, and 22 years. We acknowledge here that this variability may only be strong in the period we have studied which included a large fraction of the instrumental record. Studies such as Biondi et al. (2001) note that the interdecadal variability found recently was less robust in the proxy records preceding the 20th century. These particular periods of variability are of similar magnitude to those found in previous studies of sea surface temperature variability within the Pacific basin (Mokhov et al., 2004). Therefore, this suggests that sea surface temperature variability produces a large impact on Midwestern climates by influencing the general circulation of the atmosphere.
Considering this, when the ENSO–related interannual variability of monthly averaged temperature and precipitation were analyzed within a PDO–related interdecadal time frame, it was determined that during the +PDO period, El Niño events were found to be statistically associated with warmer than average temperatures. This was especially true during the winter and spring seasons and was the most pronounced within the northern half of the Midwestern region. This was found to occur as a consequence of strong anomalous upper–level ridging over the western North American continent during the winter and spring seasons, which acted to drive the polar jet to much higher than normal latitudes. In addition, precipitation during these events was found to be statistically associated with wetter than average months within the extreme northwestern section of the Midwestern region, and this was especially true during the spring season months. However, just the opposite was true within the southeastern region, where significantly dryer than average conditions resided, especially during the spring and summer season months. Similarly, –PDO La Niña events were found to be statistically associated with warmer than average temperatures in the winter and fall seasons within the southern half of the Midwestern region. This occurred mainly as a result of the tendency for more eastern Pacific blocking events and their tendency drive the storm track through the northern half of the Midwestern region. Areas farther south were instead found to be dominated by zonal flow, and hence more Pacific origin air masses. Meanwhile, precipitation during these events was found to be significantly dryer than average, especially during the spring season in areas encompassing the western two thirds of the study region. In contrast to significant precipitation signal during the constructive ENSO/PDO epochs, the destructive ENSO/PDO epochs did not show an association with significant precipitation anomalies, similar to the results of Gershunov and Barnett (1998).
The results of this study therefore suggest that the behavior of ENSO events is strongly determined by the phase of the PDO. Overall, there proved to be more of an ENSO–related impact on Midwestern monthly temperatures and precipitation when ENSO events occurred constructively with the PDO phase (e.g., +PDO El Niño, and –PDO La Niña events). This behavior suggests that the expected climatic conditions commonly associated with a particular ENSO event may not necessarily mimic those of another ENSO event. Instead, the occurrence and amplitude of the ENSO phenomenon can change over an extended period of time, resulting in a modulated ENSO response in climatic parameters on interdecadal timescales. Then, from an operational forecasting point–of–view, in order to improve the skill level in long term seasonal forecasts interdecadal variability should be considered as being superimposed on interannual variations.
Acknowledgments
The authors would like to thank the two anonymous reviewers for their thorough reviews and comments on the initial manuscript. Their suggestions have greatly improved this work.
References
Akyuz F. A., M. D. Chambers and A. R. Lupo, 2004. The short and long–term variability of F2 or stronger (significant) tornadoes in the Central Plains. Transactions of the Missouri Academy 38, 26–45. [ Links ]
Barriopedro D., R. García–Herrera, A. R. Lupo and E. Hernández, 2006. A climatology of Northern Hemisphere blocking. J. Clim. 19, 1042–1063. [ Links ]
Berger C. L., A. R. Lupo, P. Browning, M. Bodner, C. C. Rayburn and M. D. Chambers, 2002. The climatology of northwest Missouri snowfall events. Long term trends and interannual Variability. Phys.Geog., 23, 427–448. [ Links ]
Biondi F., A. Gershunov and D. R. Cayan, 2001. North Pacific decadal climate variability since 1661. J. Clim. 14, 5–10. [ Links ]
Bove M. C., J. B. Elsner, C. W. Landsea, X. Niu and J. J. O'Brien, 1998. Effects of El Niño on U.S. landfalling hurricanes, revisited. B. Am. Meteorol. Soc., 79, 2477–2482. [ Links ]
Changnon D., T. Creech, N. Marsill, W. Murrell and M. Saxinger, 1999. Interactions with a weather sensitive decision maker: A case study incorporating ENSO information into a strategy for purchasing natural gas. B. Am. Meteorol. Soc. 80, 1117–1125. [ Links ]
Clarke A.J. and B. Li, 1995. On the timing of warm and cold El Niño–Southern Oscillation events. J. Clim. 10, 2571–2574. [ Links ]
Ebbesmeyer C. C., D. R. Cayan, D. R. McClain, F. H. Nichols, D. H. Peterson and K. T. Redmond, 1991. 1976 step in Pacific climate: Forty environmental changes between 1968–1975 and 1977–1984, 120–141. Proceedings of the 7th Annual Climate (PACLIM) Workshop, April, 1990, California Department of Water Resources, Interagency Ecological Study Program Tech. Rep. J. L. Betancourt and V. L. Tharp, Eds. Asilomar, California, USA 26, 115–126. [ Links ]
Eichler T. and W. Higgins, 2006. Climatology and ENSO–related variability of North American extratropical cyclone activity. J. Clim. 19, 2076–2093. [ Links ]
Enfield D. B. and A. M. Mestas–Nuñez, 1999. Multiscale variabilities in global sea surface temperatures and their relationships with tropospheric climate patterns. J. Clim. 12, 2719–2733. [ Links ]
Federov A. V., S. L. Harper, S. G. Philander, B. Winter and W. Wittenberg, 2003. How predictable is El Nino? B. Am. Meteorol. Soc. 84, 911–920. [ Links ]
Gershunov A. and T. P. Barnett, 1998. Interdecadal modulation of ENSO teleconnections. B. Am. Meteorol. Soc. 79, 2715–2725. [ Links ]
Gu D. and S. G. H. Philander, 1995. Secular changes of annual and interannual variability in the Tropics during the past century. J. Clim. 8, 864–876. [ Links ]
Hidalgo H. G. and J. A. Dracup, 2003. ENSO and PDO effects on hydroclimatic variations of the upper Colorado River Basin, J. Hydrometeorol. 4, 5–23. [ Links ]
Hoskins B. J., I. N. James and G. H. White, 1983. The shape, propagation, and mean–flow interaction of large–scale weather systems. J. Atmos. Sci. 40, 1595–1612. [ Links ]
Hu Q., C. M. Woodruff and S. E. Mudrick, 1998. Interdecadal variations of annual precipitation in the Central United States. B. Am. Meteorol. Soc. 79, 221–230. [ Links ]
Hurrell J. W., H van Loon and D. J. Shea, 1995. The mean state of the troposphere. NCAR Tech Memo # NCAR/CAS/95–08, D. Karoly and D. Vincent eds., 83 pp. [ Links ]
Kalnay E., M. Kanamitsu, R. Kisler, W. Collins, D. Deaven, L. Gandin, M. Iredell, S. Saha, G. White, J. Woolen, Y. Zhu, M. Chelliah, W. Ebisuzaki, W. Higgins, J. Janowiak, K.C. Mo, C. Ropelowski, J. Wang, A. Leetmaa, R. Reynolds, R. Jenne and D. Joseph, 1996. The NCEP/NCAR 40–year reanalysis project. B. Am. Meteorol. Soc. 77, 437–471. [ Links ]
Key J. R. and A. C. K. Chan, 1999. Multidecadal global and regional trends in 1000 mb and 500 mb cyclone frequencies. Geophys. Res. Lett. 26, 2053–2056. [ Links ]
Kung E. C., C. C. DaCamara, W. E. Baker, J. Susskind and C. K. Park, 1990. Simulations of winter blocking episodes using observed sea surface temperatures. Q. J. Roy. Meteor. Soc. 4, 273–291. [ Links ]
Kung E. C., W. Min, J. Susskind and C.K. Park, 1992. An analysis of simulated summer blocking episodes. Q. J. Roy. Meteor. Soc. 118, 351–363. [ Links ]
Kung E. C., J. Susskind and C. C. DaCamara, 1993. Prominent northern hemisphere winter blocking episodes and associated anomaly fields of sea surface temperatures. Terr. Atmos. Ocean Sci., 4, 273–291. [ Links ]
Kung E. C. and J.–G. Chern, 1995. Prevailing anomaly patterns of the Global Sea Surface temperatures and tropospheric responses. Atmósfera 8, 99–114. [ Links ]
Kunkel K. E. and J. R. Angel, 1999. Relationship of ENSO to snowfall and related cyclone activity in the contiguous United States. J. Geophys. Res., 104, 19425–19434. [ Links ]
Lau N. C. 1997. Interactions between global SST anomalies and mid–latitude atmospheric circulation. B. Am. Meteorol. Soc.78, 21–33. [ Links ]
Litzow M. A., 2006. Climate regime shifts and community reorganization in the Gulf of Alaska: How do recent shifts compare with 1976/1977? ICES J. Mar. Sci. 63, 1386–1396. [ Links ]
Lorenz E.N., 1963. Deterministic, non–periodic flow. J. Atmos. Sci. 20, 130–141. [ Links ]
Lupo A. R., R. J. Oglesby and I. I. Mokhov, 1997. Climatological features of blocking anticyclones: A study of Northern Hemisphere CCM1 model blocking events in present–day and double CO2atmospheres. Clim. Dynam. 13, 181–195. [ Links ]
Lupo A. R. and L. F. Bosart, 1999. An analysis of a relatively rare case of continental blocking. Quart. J. Roy. Meteorol. Soc. 125, 107–138. [ Links ]
Lupo A. R. and G. Johnston, 2000. The interannual variability of Atlantic Ocean Basin hurricane occurrence and intensity. National Weather Digets 24, 1–11. [ Links ]
Lupo A. R., D. Albert, R. Hearst, P. S. Market, F. Adnan Akyuz and C. L. Allmeyer, 2005. Interannual Variability of Snowfall Events and Snowfall–to–Liquid Water Equivalents in Southwest Missouri. National Weather Digest 29, 13–24. [ Links ]
Lupo A. R., E. P. Kelsey, D. K. Weitlich, I. I. Mokhov, F. A. Akyuz, P. E. Guinan and J. E. Woolard, 2007. Interannual and interdecadal variability in the predominant Pacific Region SST anomaly patterns and their impact on a local climate. Atmósfera, 20, 171–196. [ Links ]
Lupo A. R., T. K. Latham, T. Magill, J. V. Clark, C. J. Melick and P.S. Market, 2008a. The interannual variability of hurricane activity in the Atlantic and East Pacific regions. National Weather Digest 32, 119–135. [ Links ]
Lupo A. R., E. P. Kelsey, D. K. Weitlich, N. A. Davis and P. S. Market, 2008b. Using the Monthly classification of global SSTs and 500 hPa height anomalies to predict temperature and precipitation regimes one to two seasons in advance for the mid–Mississippi region. National Weather Digest 32, 11–33. [ Links ]
Mantua N.J., S. R. Hare, Y. Zhang, J. M. Wallace and R.C. Francis, 1997. A Pacific interdecadal climate oscillation with impacts on salmon production. B. Am. Meteorol. Soc. 78, 1069–1079. [ Links ]
Marzban C. and J. T. Schaefer, 2001. The correlation between US tornadoes and Pacific sea surface temperatures. Mon. Wea. Rev. 129, 884–895. [ Links ]
Mestas–Nuñez A. M. and D. B. Enfield, 1999. Rotated global modes of non–ENSO sea surface temperature variability. J. Clim. 12, 2734–2746. [ Links ]
Mestas–Nuñez A. M. and D. B. Enfield, 2001. Eastern equatorial Pacific SST variability: ENSO and non–ENSO components and their climatic associations. J. Clim. 14, 391–402. [ Links ]
Minobe S., 1997. A 50–70 year climatic oscillation over the North Pacific and North America. Geophys. Res. Lett. 24, 683–686. [ Links ]
Minobe S., 2000. Spatio–temporal structure of pentadecadal variability over the North Pacific. Prog. Oceanogr. 47, 381–408. [ Links ]
Minobe S., 2004. Updated assessments of the 1998/99 climate change over the North Pacific. Neo–Science of Natural History: Integration of Geoscience and Biodiversity Studies (S. F. Mawatari and H. Okada, Eds.). Proceedings of International Symposium on "Dawn of a New Natural History– Integration of Geoscience and Biodiversity Studies", March 5–6 2004, Sapporo, 103–106 pp. [ Links ]
Mokhov I. I., V. A. Bezverkhny and A. V. Eliseev, 1997. Quasi–biennial oscillations of the atmospheric temperature regime: Tendencies of change. Izvestiya, Atmos. Ocean. Phys. 33, 533–541. [ Links ]
Mokhov I. I. and A. V. Eliseev, 1998. Tendencies of change of QBO characteristics for zonal wind and temperature of equatorial lower stratosphere. Izvestiya, Atmos. Ocean. Phys. 34, 327–336. [ Links ]
Mokhov I. I., A. V. Eliseev and D. V. Khvorostyanov, 2000. Evolution of characteristics of the climate variability related to the El Niño / La Niña phenomena. Izvestiya, Atmos. Ocean. Phys., 36, 741–751. [ Links ]
Mokhov I. I., D. V. Khvorostyanov and A. V. Eliseev, 2004. Decadal and Longer–term Changes in ENSO Characteristics. I. J. Climatol. 24, 401–414. [ Links ]
Namias J., 1982. Anatomy of great plains protracted heat waves (especially the 1980 U.S. summer drought). Mon. Wea. Rev. 110, 824–838. [ Links ]
Namias J., 1983. Some causes of the United States drought. J. Clim. Appl. Met. 22, 30–39. [ Links ]
Neter J., W. Wasserman and G. A. Whitmore, 1988. Applied Statistics, 3rd Ed. Boston, MA. Allyn and Bacon, 1006 pp. [ Links ]
O'Brien J. J., T. S. Richards and A. C. Davis, 1996. The effect of El Niño on U.S. landfalling hurricanes. B. Am. Meteorol. Soc. 77, 773–774. [ Links ]
Quiroz R. S., 1984. The climate of the 1983–1984 winter – a season of strong blocking and severe cold over North America. Mon. Wea. Rev. 112, 1894–1912. [ Links ]
Shapiro R., 1970. Smoothing, filtering, and boundary effects. Rev. Geophys. 8, 737–761. [ Links ]
Smith S. R. and J. J. O'Brien, 2001. Regional snowfall distributions associated with ENSO: Implications for seasonal forecasting. B. Am. Meteorol. Soc. 82, 1179–1191. [ Links ]
Swanson K. L. and A. A. Tsonis, 2009. Has climate recently shifted? Geophys. Res. Lett. 36, L06711, doi:10.1029/2008GL037022, 2009. [ Links ]
Tilly D. E., A. R. Lupo, C. J. Melick and P.S. Market 2008. Calculated height tendencies in a Southern Hemisphere blocking and cyclone event: The contribution of diabatic heating to block intensification. Mon. Wea. Rev. 136, 3568–3578 [ Links ]
Torrence C. and G. P. Compo, 1998. A practical guide to wavelet analysis. B. Am. Meteorol. Soc. 79, 61–78. [ Links ]
Tsonis A. A., K. L. Swanson and S. Kravtsov, 2007. A new dynamical mechanism for major climate shifts. Geophys. Res. Let. 34, L13705, doi:10.1029/2007GL030288, 2007. [ Links ]
Wiedenmann J. M., A. R. Lupo, I. I. Mokhov and E. A. Tikhonova, 2002. The climatology of blocking anticyclones for the Northern and Southern Hemisphere: Block intensity as a diagnostic. J. Clim. 15, 3459–3474. [ Links ]
Wilks D. S., 2006. Statistical Methods in the Atmospheric Sciences, 2nd ed. Int. Geophys Series number 91, Academic Press, 627 pp. [ Links ]
Wunsch C., 1999. The interpretation of Short Climate Records, with Comments on the North Atlantic and Southern Oscillations. B. Am. Meteorol. Soc. 80, 245–257. [ Links ]

