


Servicios Personalizados
Revista
Articulo
 Inglés (pdf)
 Artículo en XML
 Referencias del artículo
 Enviar artículo por email
Indicadores
-
 Citado por SciELO
 -
 Accesos
Links relacionados
-
 Similares en
SciELO
Similares en
SciELO
Compartir

 Permalink
Atmósfera
versión impresa ISSN 0187-6236
Atmósfera vol.14 no.1 Ciudad de México ene. 2001
Volatile organic compounds emissions from gasoline and diesel powered vehicle
V. Múgica
Universidad Autónoma Metropolitana-Azcapotzalco. Av. San Pablo No. 180, Col. Reynoso Tamaulipas Azcapotzalco, 2200 México, D. F.
E. Vega, G. Sánchez, E. Reyes, J. L. Arriaga
Instituto Mexicano del Petróleo, México, D. F.
J. Chow, J. Watson, R. Egami
Desert Research Institute, Reno, NV, USA
(Manuscript received Jan. 27, 2000; accepted in final form July 3, 2000)
RESUMEN
En este trabajo se caracterizaron las emisiones de compuestos orgánicos volátiles provenientes de vehículos a gasolina y a diesel. Para ello, se diseñaron diversas campañas de muestreo en la Zona Metropolitana de la Ciudad de México, en túneles, cruceros y estaciones de camiones de carga y autobuses. Las muestras se analizaron con cromatografía de gases obteniéndose más de 250 compuestos distintos, de los cuales aproximadamente 60 corresponden a más del 80% de las emisiones. Los compuestos más abundantes son los de dos carbonos, resultado de la combustión, y compuestos relacionados con la composición de las gasolinas como es el caso del isopentano, los xilenos y el tolueno, entre otros. Los perfiles obtenidos en túneles y cruceros fueron similares con excepción de los compuestos de 3 y 4 carbonos que se encontraron en mayor proporción en los perfiles de cruceros, lo cual se debe probablemente a la mezcla con el aire ambiente. Los perfiles correspondientes a camiones de carga y autobuses tienen un menor contenido de compuestos de dos carbonos y un mayor contenido de xilenos, tolueno y etilbenceno. Estas variaciones en la proporción de los compuestos mencionados permiten diferenciar el perfil de vehículos a gasolina y el perfil de vehículos que utilizan diesel.
ABSTRACT
In this research, volatile organic compound emissions were characterized from gasoline and diesel vehicles. Sampling campaigns in the Metropolitan Area of Mexico City were designed and carried out in tunnels, crossroads, and truck and bus terminals. The samples were analyzed with gas chromatography getting more than 250 different compounds, being more or less 60 of them the 80% of all the emissions. The most abundant are the two carbon compounds, as a result of the combustion, and compounds related to fuels composition, like isopentane, xylenes, toluene among others. The profiles obtained in tunnels and crossroads were very similar with the exception of the 3 and 4 carbon compounds, which were found in bigger proportion in the profiles at crossroads. This may probably be due to the blend with the ambient air. The profiles corresponding to trucks and buses have a smaller content of two carbon compounds and a bigger content of xylenes, toluene and ethylbenzene. The variations in the proportion of the compounds allow to differentiate the profiles of vehicles using gasoline and diesel.
1. Introduction
The atmospheric pollution present in the majority of the big cities, has become a big problem that requires prioritary attention because the health of a great number of people is at risk. In Mexican cities, among them the Metropolitan Area of Mexico City (MAMC), the ozone is the pollutant that represents the biggest problem of air pollution, for that reason it is imperative the control of their precursors, the nitrogen oxides (NOx) and the volatile organic compounds (VOC). The last emission inventory of MAMC has reported that every year are emitted to the atmosphere more than one million thousands tons of VOC, and that the three and a half million vehicles are the main cause of them, representing the 54% (DDF, 1996, see references). For this situation it is very important to know with the best possible detail the characteristics of these VOC emissions, because it will provide not only a better knowledge of the species present at the atmosphere but also the necessary information to control them.
One of the ways to know the characteristics of the emissions of VOC has been through the determination of the emission profile from different sources. This means to characterize in quantitative form the chemical species in order to know their proportion in the total emitted mass. The characterization of these profiles has been carried out in other countries for several investigators. Sigsby et al. (1987) characterized the emissions of 46 cars using a chassis dynamometer. McCabe et al. (1992) determined the emissions from the combustion of diverse fuels. Bailey and Eglesston (1993), Haszpra and Szilagyi (1994), Conner et al. (1995) and Duffy and Nelson (1996) characterized the vehicle emissions in diverse places. Studies carried out in tunnels by Lonneman et al. (1986), Pierson et al. (1996) and Sagebiel et al. (1996), among others. Fujita et al. (1994), applied the profiles obtained in the receptor model CMB (Chemical Mass Balance).
In Mexico, with the aim of having data for a box model, Young et al. (1997) carried out measurements in a tunnel of the MAMC; Mugica et al. (1998) conducted a study in the same tunnel to get emission profiles and Vega et al. (2000) compared the results obtained in a dynamometer study with those obtained in the tunnel. The profiles have been useful in order to have a better knowledge of the emitted species and for the application of receptor models which have concluded that the principal VOC sources in the city are the vehicle fleet, the usage and marketing of LP gas, the asphalt operations and the use of paintings (Watson et al, 1990; Mugica et al, 1999; Vega et al, 1999).
The main objective of this work was the characterization of vehicle emissions in crossroads, tunnels and bus and truck terminals in the MAMC. With these emission profiles we will have a better knowledge about the difference between the VOC emitted by vehicles that use gasoline and those that use diesel. On the other hand, it will be possible to apply a receptor model in order to determine the contribution of the sources to the pollution by VOC.
2. Methodology
2.1 Sampling
For VOC sampling, 6 l stainless steel SUMMA® canisters were used according to the TO-14 method for sampling and analysis of VOC, of the Environmental Protection Agency (Winberry et al, 1988). These canisters were cleaned in the laboratory by repeated evacuation and pressurization with humidified helium chromatography grade (99.99% purity), at nearly 100°C prior to sampling, and they were certified as described by US-EPA Method TO-14. A flow regulator of critical orifice was used to adjust the feeding flow between 80 to 13 ml/min and therefore, to control the sampling time. Lines of Teflon were connected to the canisters to get the samples at a high of three meters inside the tunnel. At cross roods the sampling was at ground level.
The sampling campaigns were conducted in the first week of March of 1998. The weather was dry, around 26°C. Determinations of the speed and the direction of the wind were not made, but it was estimated that in all the sampling days the speed of the wind was less than 1.5 m/s. Vehicle were counted and classified three times during ten minutes. The differentiation between gasoline powered vehicles and diesel powered vehicles was visual considering as diesel vehicles all the buses and trucks bigger than five tons.
2.2 Sampling sites selection
To obtain the best source profile it is necessary to avoid the influence of other sources to ensure that the emissions come from the source that is being characterized. Avenues with intense traffic and terminal places where the vehicle source domain were selected as well as tunnels in which there are less influence from other sources.
The main difference between the two selected tunnels was the type of vehicle and the area of the city. The first one is near the downtown area with gasoline powered vehicles because the access is prohibited to heavy vehicles, buses and trucks. The second tunnel is in an industrial zone northwest of the city in which there is transit of gasoline and diesel powered vehicles. Three cross roads were selected due to they present heavy traffic and different proportion between gasoline and diesel powered vehicles.
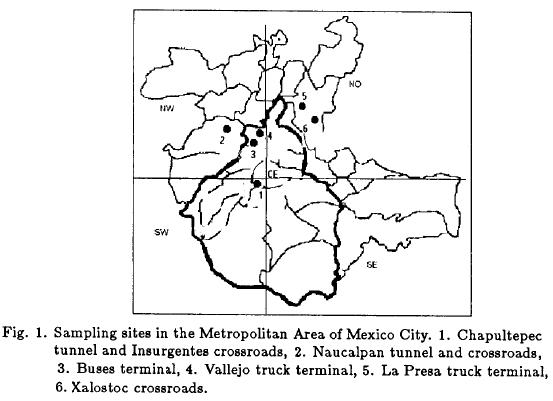
The first tunnel is located in Chapultepec Ave., near the downtown. It is 365 m long, 7.77 m wide and 4.30 m high. As it was mentioned before most vehicles are gasoline powered. This is an area with residences, restaurants, business and commercial facilities. Two air vents are located at 60 m from the entrance and 67 m from the exit. The Teflon sampling line was installed in the second air vent. Four samples were taken in two days. The first two integrated samples were taken from 7:30 to 10:00 and from 12:30 to 15:40 trying to cover the time with more traffic. The second tunnel is located northwest of the MAMC in Independencia Ave., between the Ciencias y Humanidades High School and Naucalpan market. In this tunnel there are both gasoline and diesel-powered vehicles. A residential and an industrial zone surround the tunnel. The tunnel has one way lane from north to south. It is 280m long, 10 m wide and 9m high in one section and 6 m in other. Teflon lines were installed at 70 m before the tunnel exit in an air vent. Heavy traffic is only in the morning. The two-hour integrated samples were taken at 7:20 and 9:40.
Three crossroads were selected; the first one is located at Niza and Insurgentes, very close to Chapultepec Ave. tunnel. Some buses drove through, but the majority were gasoline powered vehicles. There were two sampling days, the first one with four sampling periods of two hours each at 8:30, 1:00, 13:30 and 15:40. The second day there were three two hours sampling periods at 7:50, 10:15 and 12:30. The second crossroads is 300 m away from the Naucalpan tunnel exit. In this cross roads there are four avenues and the number of vehicles (gasoline and diesel powered) were three times larger than in the first crossroads. There were two sampling periods of two hours each at 7:00 and 9:30. The last crossroads is located northeast of the city in the Xalostoc industrial zone, in Via Morelos and Emiliano Zapata. The two hours sampling were at 12:45, 15:00 and 7:15.
To determine the profiles of powered diesel vehicles, three places were selected: one bus terminal and two truck terminals. The bus terminal is located on Cien Metros Ave at the northeast of MAMC. There were two sampling days. All the samplings lasted two hours each. Sampling times in the second day were at 13:30, 15:15, 14:10 and 16:00 at different exits of the bus terminal. During the sampling periods buses were coming in and out all the time. The first truck terminal is located on Vallejo Ave and there is a constant movement of trucks at the two terminal entrances. There were two sampling sites of two hours each; 18:30 and 20:45. The other truck terminal is located at "La Presa" zone in the municipality of Tlanepantla, northeast of the city. Residential and some industries surround the zone. The schedules for the samplings in the two different places of the site were at 7:45, 9:00, 10:00 and 7:30, 8:45, 10:00. Each had duration of one hour. In Table 1 there is a summary of the proportion of gasoline and diesel powered vehicles estimated during the sampling. It is important to mention that in the MACM there are approximately 28 000 LP gas powered vehicles (less than 1% of the total fleet, Schifter et al., 2000). This had to be ignored because it is not easy to distinguish this kind of vehicles.
2.3 Analysis
VOC determination was carried out with a high-resolution gas chromatograph equipped with a flame ionization detector model Hewlett-Packard 5890 Series 11 Plus, after a cryogenic preconcentration. The chromatographic column used for this analysis was a CHROMPACK Plot fused silica capillary column of 60m long and an internal diameter of 0.32mm, with Al2O3/KCl as stationary phase. A separate gas chromatograph (TREMETRICS, Series 9000) was dedicated to the analysis of two carbon compounds. The oven temperature program was -50°C during 3 min., and after to reach 200°C at 8°C/min.
3. Results
3.1 Tunnel emissions
Measured concentrations of individual organic species showed a significant variation from canister to canister. However, when individual species concentrations were normalized to the total measured VOC, the abundance of individual species was similar for the samples of each tunnel. As it is showed in Table 2 for the study in the Chapultepec tunnel the most abundant compounds were acetylene, isopentane, xylenes, toluene, methyl terbutil éter (MTBE), ethylene, 224 trimetilpentane, propane and nbutane. In comparison whit the results obtained in 1996 (Mugica et al, 1998), it should be emphasized the increment in the MTBE proportion that was 1.87% in 1996 compared to 3.77% in 1998; the content of isopentane and toluene increased from 5.7% to 7.7% and from 5.4% to 6.7%, respectively. There was also an increment for substituted 224 trimethylpentane and 234 trimethylpentane from 1.34% to 3.90% and from 0.64% to 1.55%, respectively. On the other hand, the concentrations of some lineal organic compounds such as npentane and nhexane had approximately a 30% decrease. The differences mentioned above are consistent with the fuel changes in the last years. Leaded Nova gasoline was taken away from the market. To have a better combustion, the oxygen compound (MTBE) was increased in the fuels. A new gasoline Premium was introduced with more content of isoparafinic compounds and Magna gasoline had an increment of those compounds to reach high-octane levels.
Comparing the results of the Chapultepec and Naucalpan tunnels, great similarities were noticed in the content of most of the compounds. Especially the most abundant such as isopentane, toluene, xylene isomers, 224 trimethylpentane, ethylene, npentane, MTBE, methylpentanes, nhexane, and benzene. The more notorious differences are presented in the content of two-carbon compounds in particular acetylene, which has a lower abundance in the Naucalpan tunnel than in the Chapultepec one. There is a larger proportion of propane and butane (which are compounds associated to LP gas) in the Naucalpan tunnel than in the Chapultepec one with 3.47% vs. 5.94% and with 3.11% vs. 4.32%, respectively. As it was mentioned above, close to Naucalpan tunnel there are industries that use LP gas as fuel and it is possible that there are more content of those compounds in the ambient air. The total VOC concentrations were similar.
3.2 Crossroads emissions
In Table 2 it is possible to appreciate the developed profiles for crossroads. In the Naucalpan crossroads the vehicular flow was more intense than in the other two and maybe for that reason the abundance of two carbon compounds was higher. The most abundant compounds are in general the same as in the tunnels, but for the three cases the proportion of butanes and propane is larger. In the average for the three crossroads the standard deviation is 65% for propane and 30% for nbutane, because in Xalostoc crossroads the proportion of those compounds were higher than 13% and 6% in comparison with the 5% and 3.5% on the other two crossroads. These high contents of propane and nbutane have been reported by other investigators and are due to the presence of several gas industries close to Xalostoc cross roads (Blake and Rowland, 1996; Vega et al., 2000).
In Xalostoc 26% were diesel-powered vehicles, 13% in Naucalpan, and 12% in Insurgentes avenue. The total concentration of VOC was twice as much in Naucalpan because the amount of vehicles was many times higher.
When tunnel and crossroads profiles are compared it is possible to appreciate that the content of propane and nbutane is higher for crossroads, because they are open spaces and there is more influence of ambient air. This means that in crossroads exist the influence of another source, which could be the use and marketing of LP gas. Meanwhile, in the tunnels, the obtained profiles are more exact because they are more isolated.
3.3 Emissions from bus and truck terminals
The characterized emissions in the bus and truck terminals were quite similar, but there were found differences as can be appreciate in Table 2. The content of two carbon compounds: propane and ethylbenzene is a little bigger in the bus terminal than in the truck terminal, whereas the content of MTBE, toluene and isopentane are a little bigger in the truck terminals. Variation can be due to the different engines, control equipment and technology of each type of vehicle. In all the cases the xylenes isomers were the most abundant species with an average of 15%, followed by toluene with 9%, propane with 63.9%.
The comparison of some species, which are present in the gasoline and diesel, powered vehicle profiles is shown in Figure 2. The gasoline powered vehicle profile corresponds to the Chapultepec Ave. tunnel emissions where the presence of diesel powered vehicle was less than 1%. The diesel powered vehicle profile corresponds to the average of emissions in bus and truck terminals. It is also presented an average of the emissions at crossroads where there are both kinds of vehicles. The content of aromatic compounds such as xylenes and toluene is higher in the diesel powered vehicle profile. In the gasoline powered vehicle and combined vehicle profiles there were no more than 11% of xylene nor more than 7% of toluene. Also a higher abundance of ethylbenzene in the diesel powered vehicle profile was observed. It was evident the low abundance of two carbon compounds in diesel powered profiles that had an average of 5% against the 13% in the gasoline powered vehicle profile. In the combined vehicle profile it could be observed the diminution of two carbon compounds and the increasing of some aromatic compounds (xylenes and toluene) in comparison to the gasoline powered vehicle profile due to the presence of diesel powered vehicles.

4. Conclusions
VOC emissions from the vehicular fleet of the MAMC were characterized in tunnels, crossroads, and bus and truck terminals. In general the most abundant species are ethylene and acetylene, isopentane, toluene, xylenes, and MTBE. The developed tunnel profiles are more representatives of the gasoline powered vehicles, because there is no influence from other sources, as in crossroads where there are more contents of propane and nbutane coming from the ambient air. In Xalostoc where gas industries are installed, the increment of those species was evident. There were differences detected between the gasoline and diesel powered vehicle profiles. The content of two carbon compounds (mainly ethylene and acetylene) is lower for diesel powered vehicles, as the result of a different kind of combustion compared to the gasoline powered vehicles. Other difference is the increase in the content of some aromatic compounds, specially toluene, ethylbenzene, and xylenes in the diesel powered vehicles profile. These results allow to establish that the profiles have enough particularities to be used in the CMB receptor model application. In addition, it is possible to have some idea of the type of emissions that we could have if the use of diesel were increased or diminished in the MAMC.
Acknowledgements
The Mexican Petroleum Institute FIES program supported this project. The project is the result of the conjointed effort among the Azcapotzalco Metropolitan University, Desert Research Institute, and Mexican Petroleum Institute. Authors wish to acknowledge M. Germán Arellano for the translation of the paper, Dra. Elba Ortiz for obtaining the permissions in some sampling sites and to the staff of the three institutions who collaborated in the sampling campaigns.
REFERENCES
Bailey, J. and S. Eggleston, 1993. The contribution of gasoline fuelled vehicle exhaust to the UK speciated hydrocarbon inventory. Science Total Environment. 134, 263-71. [ Links ]
Blake, D. R. and F. S. Rowland, 1995. Urban leakage of liquefied petroleum gas and its impact on Mexico City Air Quality, Science. 269, 953-956. [ Links ]
Conner, T., W. Lonneman and R. Seila, 1995. Transportation-Related Volatile Hydrocarbon Source Profiles Measured in Atlanta. J. Air & Waste Management Association. 45, 383-389. [ Links ]
DDF, Gobierno del Estado de México, Secretaría de Medio Ambiente Recursos Naturales y Pesca, Secretaría de Salud, 1996. Programa para mejorar la Calidad del Aire en el Valle de México (PROAIRE). [ Links ]
Duffy, B. and P. Nelson, 1996. Non-methane exhaust composition in the Sydney Harbour Tunnel: A focus on benzene and 1,3-butadiene. Atmospheric Environment. 30, 2759-2768. [ Links ]
Fujita, E., J. Watson, J. Chow, and L. Zhiqlang, 1994. Validation of CMB receptor model applied to HC source apportionment in the Southern Cal. Air Quality Study. Environmental Science y Technology. 28, 1633-1649. [ Links ]
Haszpra, L. and I. Szilagyi, 1994. Non-methane hidrocarbon composition of car exhaust in Hungary. Atmospheric Environment. 28, 2609-2614. [ Links ]
Lonneman, W. A., R. L. Seila. and S. A. Meeks, 1986. Non- methane organic composition in the Lincoln Tunnel. Environmental Science and Technology. 20, 790. [ Links ]
McCabe, R., W. Siegl, W. Chun, J. Perry, Jr., 1992. Speciated hydrocarbon emissions from the combustion of single component fuels. Journal of Air and Waste Management Association. 42, 1071. [ Links ]
Mugica, V., 1999. Determinación de los perfiles de emisión de compuestos orgánicos volátiles en la ZMCM y su aplicación en el modelo CMB. Dissertation thesis. [ Links ]
Mugica, V., E. Vega, J. L. Arriaga and M. Ruiz, 1998. Determination of Motor Vehicle Profiles for Non-Methane Organic Compounds in Mexico City Metropolitan Area. Journal of Air and Waste Management Association. 48, 1060-1068. [ Links ]
Pierson, W., A. Gertler, N. Robinson, J. Sagebiel, B. Zielinska, G. Bishop, D. Stedman, R. Zweidinger and W. Ray, 1996. Real-world automotive emissions summary of studies in the Fort McHenry and Tuscarona Mountain tunnels. Atmospheric Environment. 30, 2233- 2256. [ Links ]
Sagebiel, J., B. Zielinska, W. Pierson, A. Gertler, 1996. Real World emissions and calculated reactivities of organic species from motor vehicles. Atmospheric Environment. 30, 2287-2296. [ Links ]
Schifter, I., L. Díaz, E. López, R. Rodríguez, S. Avalos and V. Guerrero, 2000. An Evaluation of the LPG Vehicles Program in the Metropolitan Area of Mexico City. J. Air & Waste Management Association. 50, 301-309. [ Links ]
Sigsby, J., S. Tejada, W. Ray, J. Lang and J. Duncan, 1987. Volatile organic compound emissions from 46 in use passenger cars. Environmental Science and Technology. 21, 466-475. [ Links ]
Vega, E., V. Mugica, L. Diaz y F. Ramos, 2000. Estudio Comparativo de perfiles de emisiones vehiculares en túnel y dinamómetro, 2000. Revista Internacional de Contaminación Ambiental. Vol. 16, 55-69. [ Links ]
Vega, E., V. Mugica, R. Carmona and E. Valencia, 2000. Hydrocarbon source apportionment in Mexico City using the chemical mass balance receptor model. Atmospheric Environment. 34, 4121-4129. [ Links ]
Watson, J., N. Robinson, J. Chow, and R. Henry, 1990. The USEPA/DRI Chemical mass balance receptor model CMB 7.0. Environm. Software. 5, 38-49. [ Links ]
Winberry, W. T. Jr., N. T. Murphy and R. M. Riggin, 1988. Method TO-14 Compendium of methods for the determination of toxic organic compounds in Ambient Air, EPA 600-4-89.018 U.S. Environmental Protection Agency, Research Triangle Park. [ Links ]
Young, A., E. Betterton, L. Saldivar, 1997. Photochemical box model for Mexico City. Atmósfera. 10, 161- 178. [ Links ]

