


Servicios Personalizados
Revista
Articulo
 Inglés (pdf)
 Artículo en XML
 Referencias del artículo
 Enviar artículo por email
Indicadores
-
 Citado por SciELO
 -
 Accesos
Links relacionados
-
 Similares en
SciELO
Similares en
SciELO
Compartir

 Permalink
Atmósfera
versión impresa ISSN 0187-6236
Atmósfera vol.14 no.1 Ciudad de México ene. 2001
Effect of hydrocarbons and nitrogen oxides on ozone formation in smog chambers exposed to solar irradiance of Mexico city
J. Sandoval F., O. Marroquín de la R., J. L. Jaimes L., V. A. Zúñiga L., E. González O. and F. Guzmán López-Figueroa
Instituto Mexicano del Petróleo, Subdirección de Protección Ambiental, Gerencia de Ciencias del Ambiente, Eje Central Lázaro Cárdenas 152, Col. San Bartolo Atepehuacan, Deleg. Gustavo A. Madero, C. P. 07730, México, D. F.
(Manuscript received Jan. 19, 1999; accepted in final form July 3, 2000)
RESUMEN
Se realizaron experimentos de cámaras de esmog con el aire de la ciudad de México para determinar las respuestas de los niveles máximos de ozono a los cambios en las concentraciones iniciales de hidrocarburos, HC y óxidos de nitrógeno, NOx. Por lo general, se llenaron 8 bolsas con aire matutino de la Ciudad de México. En algunas cámaras, las concentraciones iniciales fueron cambiadas de ±25% a ±50%, añadiendo varias concentraciones de una mezcla de HC, aire limpio y/o NOx. La concentración de O3 y NOx, en cada cámara, fue monitoreada a lo largo del día para determinar el máximo de O3.
El efecto de los HC y el NOx fue determinado por comparación del máximo de ozono formado en las cámaras que fueron perturbadas por adición o reducción de HC y/o NOx, con aquella que fue llenada únicamente con aire matutino del día. Los resultados de máximos de ozono de los ocho experimentos realizados día a día fueron usados para construir las isopletas de ozono con respecto a las concentraciones de HC y NOx iniciales que contenía cada bolsa cada mañana. Para las condiciones iniciales promedio que se midieron, la estrategia más eficiente para reducir el máximo de ozono es aquella que consiste en reducir los NOx.
ABSTRACT
Outdoor smog chambers experiments were performed on air to determine the answer of maximum ozone levels, to changes in the initial hydrocarbons, HC, and nitrogen oxide NOx. These captive-air experiments under natural irradiation were carried out. Typically, eight chambers were filled with Mexico City air in the morning. In some of those chambers, the initial HC and/or NOx concentrations were varied by 25% to +50% by adding various combinations of a mixture of HC, clean air, or NOx (perturbed chambers). The O3 and NOx concentration in each chamber was monitored throughout the day to determine O3 (max).
The initial HC and NOx concentration effects were determined by comparing the maximum ozone concentrations measured in the perturbed and unperturbed chambers. Ozone isopleths were constructed from the empirical model obtained of measurements of the eight chambers and plotted in a graph whose axes were the initial HC and NOx values. For the average initial conditions that were measured in Mexico City, It was found that the most efficient strategy to reduce the maximum concentration of O3 is the one that reduces NOx.
1. Introduction
At Mexico City metropolitan area (MCMA) ozone has reached levels that have forced authorities to take a group of actions with the purpose of improving the quality of air. Despite all the actions taken, ozone levels have not diminished to desirable values. This is why it is of vital importance to make studies about the effects of primary contaminants as HC and NOx, to establish controls to permit to reduce ozone concentration (Kelly and Gust, 1990).
To establish controls it is necessary to determine strategies based in studies that allow finding the contribution of ozone precursors. The association between ozone concentrations in environmental air, and changes on the initial ozone precursors (HC and NOx), has been studied in smog chambers. This experiments with captive-air, are referred to those in which the morning environmental air is the main source of reactants, and most of them have been fulfilled outdoors (EPA-600, 1976). Many researchers (Jaffe, 1967; Jeffries et al., 1975; Ripperton et al., 1976; Kelly, 1980, 1987; Kelly-Gunst, 1990 and Gunst-Kelly, 1993) have used teflon chambers to make experiments in different urban areas, because such chambers are a good way to simulate photochemical reactions.
These experimental systems have been used to investigate photochemical reactions in polluted air, and represent a good empirical approximation the response of ozone formation process to changes in the initial concentrations of HC and NOx.
Outdoors chambers are exposed to solar irradiance and operation is under environmental temperature, with or without artificial mixtures. Chambers currently used are made of 0.5 mm teflon film, mounted on natural fiber nets.
In this work we followed the methodology of solar irradiation of captive-air in smog chambers to evaluate the response of maximal ozone formation to different perturbations on initial concentrations of primary contaminators (HC and NOx). It was done in a similar way of tests made by Nelson A. Kelly in Los Angeles California City in 1987. With this experiments we pretend to begin in looking for a strategy that let us reduce ozone formation in Mexico City.
2. Experimental
2.1. Site
Experiments were done at the installations of the Mexican Petroleum Institute at Mexico City. The institute is located on Azcapotzalco-La Villa Avenue between Eje Central Lázaro Cárdenas and Vallejo Avenue, two ways with a high vehicle traffic on the north of the city and close from Vallejo Industrial area, considered as an important source of ozone precursors emission.
2.2. Design of experiments
Experimental design was focused mainly in determining the influence of precursors (HC and NOx) on ozone formation, for this we analyzed four experimental levels with respect of initial concentration of HC and NOx, two reduction levels under environmental level (-25% and -50%), environmental level, and a level over environmental level (+25%). This corresponds to a factorial design of 42, which would involve 16 combinations of HC-NOx every day. Nevertheless in this design there was only done half of it.
Tests were selected in a way to accomplish the objectives of simulate control strategies by the effect of precursors, proportionate replicas in which more than one chamber had mixtures prepared in the same way and minimized the confusing effects of everyday variation. To carry out the experiments 9 chambers were used. One chamber was used as control chamber.
2.3. Experimental chamber
Figure 1 shows a matrix for the experiments with environmental air, numbers 1 to 6 indicate the group of experiments done in a certain day with changes in percentage on initial concentrations of HC and NOx (8 experiments each day). Both, daily experimental selections, as well as initial experimental concentrations of HC and NOx in each experiment were randomly determined.
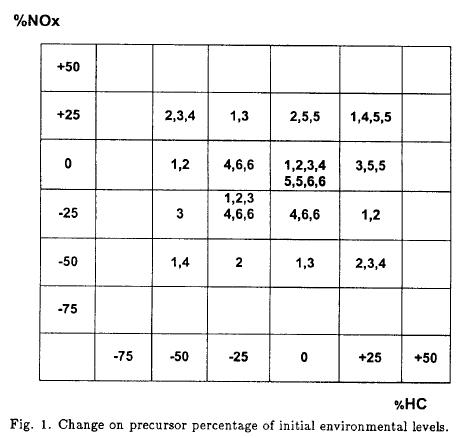
This work was performed on 14 days, which allowed us to make 112 addition and dilution tests on the base of changes of percentage on initial HC and NOx concentrations.
Besides this, experiments with clean air (ultra zero grade air with less than 0.1 ppm of hydrocarbons) which are described latter.
Putting together the experiments with morning air and clean air, a total of 136 experiments were done in 17 days. Most of the experiments were replicas to get reliable information and ensure that the problems presented during experimentation would not avoid result interpretation.
2.4. Preparation of mixtures in chambers
Mixtures of HC-NOx, were prepared filling the chambers with morning air, followed by HC and/or NOx depending on the day experiment. The clean air diluent was MG HC-free air, which contains only a few ppbC of reactive HC. NOx and hydrocarbons gases used in the mixture preparation were at a concentration of 10 000 ppm for NO and 39 060 ppmC for HC nitrogen balance. The hydrocarbons mixture compounds were propane, n-butane, toluene and propylene in a proportion of 40.6%, 30.1%, 27.4% and 1.9%, respectively. This proportion of alkanes, aromatics and defines, is common in the metropolitan area of Mexico City. (Instituto Mexicano del Petróleo, 1994).
Injection of synthetic gases of HC and NOx, was made using Hamilton syringes, from 5-100 ml, the gas from cylinders was injected to current clean air when it was fed to the chamber. This technique was very accurate and reproductibly for adding HC and NO.
2.5. Chamber operation and measurements
All experiments were performed in 500 liters chambers constructed from 2 mil (0.005 mm) FEP- Teflon, Type A film that was heat-sealed around the edges. Nine chambers were mounted on nets in a 3x3 matrix lm above a plywood platform. The middle chamber was a control chamber used for HC and carbonyl and temperature measurements. The eight chambers around the control chamber were used for HC-NOx mixtures.
The chambers, which contained air from the day, they were evaluated before at 6.00 h for leaks in the morning. Each damaged chamber was changed. The chambers were evacuated, refilled with 30 liters of clean air, reevacuated and then filled. After that, the mixtures were prepared, the measurements started almost at 9.00 h.
The measurements discussed in this report are HC, NOx, O3, ultraviolet flux and temperature. HC samples were caught in canisters from the control chamber and analyzed by gas chromatography in accordance to the EPA TO-14 protocol.
The initial HC in the treated bag was calculated from the treatment it received and the analysis in of the hydrocarbon in the control bag. The NOx and O3 were measured each 58 minutes in each chamber until 17.00 using a Thermo Environment Inc. 42 analyzer equiped with a nylon filter to remove nitric acid and a Thermo Environment Inc. 49 analyzer respectively.
Temperature was taken within the chamber with an aspirated thermocouple and with a single thermocouple outside of it. Ultraviolet flux with an Eppley ultraviolet radiometer located next to the experimental system was measured too.
2.6. Clean air experiments
Experiments in addition to that related strategy control were conducted to check for problems. These experiments included: (1) irradiation of clean air and of chemically reactive compounds in clean air; (2) Chambers-wall-loss and line loss determinations for NOx and O3, and (3) measurements on temperature inside and outside and chamber. The last two types of experiments showed that wall and line losses were negligible, as were temperature differences between air inside and outside of the chambers.
Most of the experiments were of the first type. Irradiation of identical surrogate HC-NOx-clean air mixtures on different days to get information about effects of meteorological variables such as temperature and ultraviolet flux on O3 (max) were examined.
3. Results
3.1. Data base
The data base consists of hourly measurements of NOx and O3, initial HC in a control bag, temperature, and ultraviolet flux outside the bags. The data base comprises 136 experiments run on 17 days. The initial HC and NOx concentrations, temperature and ultraviolet flux were taken into account as independent variables; the dependent variable was O3 (max).
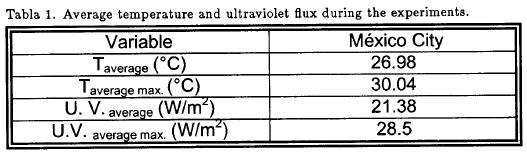
The temperature and ultraviolet radiation conditions during the CAI experiments are summarized in Table 1, which gives the average ambient on the base of diary O3 (max).
The CAI data base was used to determine the adequacy of the experimental program to assess the experimental error, and to find out an empirical model for O3 (max). These results were used as test variables.
3.2. Replica experiments
These experiments were conducted by filling two chambers with the same atmosphere air or prepared mixture; the chamber-to-chamber differences had a small replica effect on O3 formation. Figure 2 shows O3 formation in replicas using both ambient air and two reactive HC-NOx or NOx mixtures added in atmosphere air.
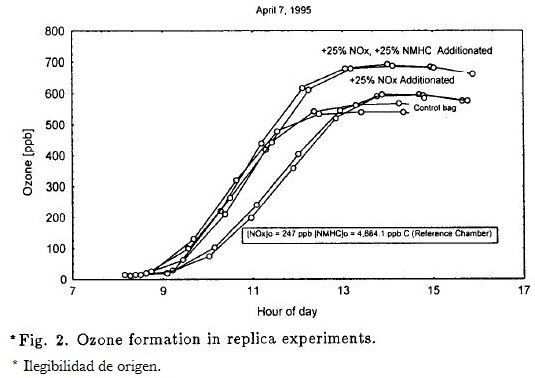
The O3 profiles were very similar, as well as the O3 (max) attained in each chamber for the given mixture. The differences in the O3 (max) average took into account all replica experiments were 4.27%. This excellent reproduction was similar to studies done in Los Angeles.
3.3. Temporal profile of O3
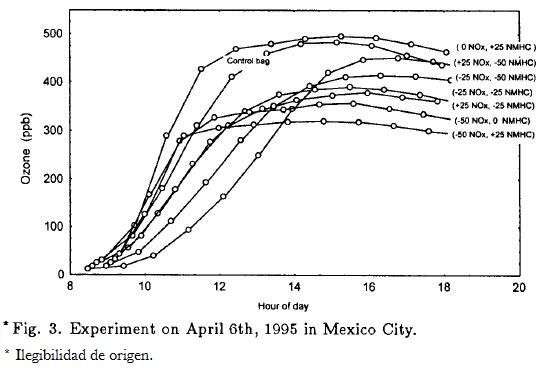
The effects of perturbations on the O3 concentrations for all mixtures followed a sigmoidal kinetic curve, which is typical of a catalytic reaction. An initial induction period was followed by a sharp increase to O3 (max), and then by very little change. O3 (max) occurred between 14.00 and 16.30 h. NOx-rich mixtures reached O3 (max) after the other mixtures.
The O3 profiles can be clearly observed in Figure 3, which shows the results of one experimental day (April 6, 1995). The bag that underwent a 50% in NOx and a 25% increase in HC showed a large reduction in O3 (max) and a long induction period relative to the reference chamber. A comparison of the reference chamber with the one that had a 25% of increment in HC slightly exceeded O3.
3.4. Day-to-day variations in initial HC and NOx, and effects of induced perturbations on O3(max)
Figure 4a and 4b show the initial HC and NOx in the bags on each day. The daily variability in the control bag was large; HC varied from 1490 to 5962 ppb and NOx varied from 37.4 to 271 ppb. In order to the natural variation, the induced perturbation expanded the experimental region slightly. 93% of the HC/NOx ratio ranged from 9 to 32, and the average ratio was 20.6 for all experiments in atmosphere air.
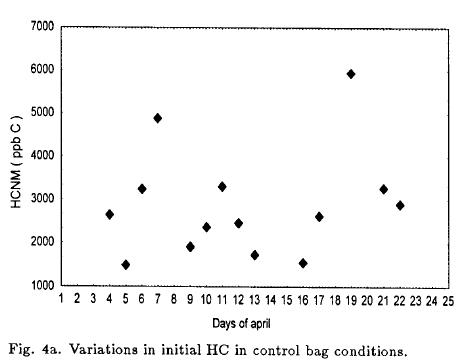
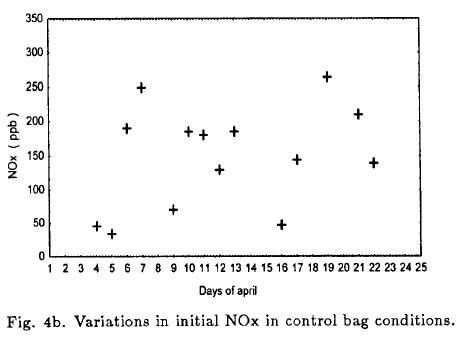
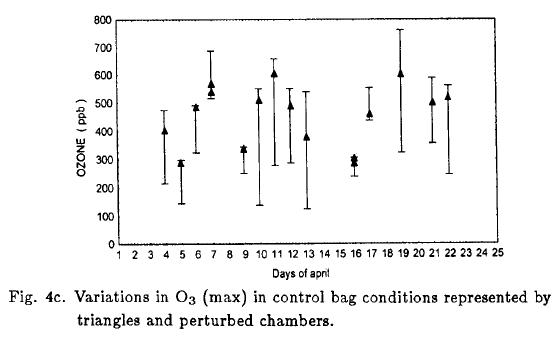
Figure 4c shows the day-to-day variations in O3 (max). The control bags show a strong variation in the capacity of environment morning air to generate O3, triangles represent O3 (max) formed in the reference chamber, and they ranged from 290 to 600 ppb. Figure 4c also shows the perturbations effects on O3 (max) in each chamber, the vertical line represent the variation range of them in an experimental day.
3.5. The effects of temperature and ultraviolet flux on O3 (max) in surrogate HC-NOx-clean air irradiations
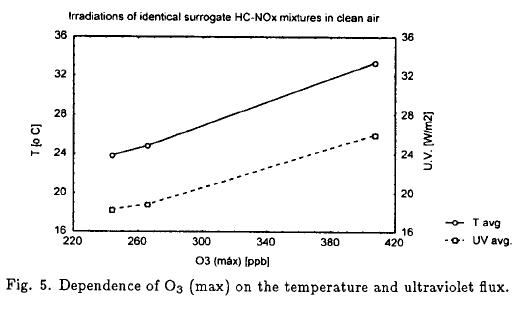
Perturbations of the initial HC and NOx concentrations in the CAI were controlled, but the variations in the temperature and ultraviolet flux were not controlled. These meteorological variables were assessed using two bags with the same mixture. During the first four day of experimentation the average concentration of NOx was calculated and taken in count a HC/NOx ratio of 20 (Instituto Mexicano del Petróleo, 1994) was possible to get the HC concentration. The mixtures with 2.8 ppmC of HC and 140 ppb of NOx in clean air were prepared and irradiated on 3 days.
Figure 5 shows a plot of O3 (max) vs T(avg) and ultraviolet flux(avg). The difference between O3 (max) for the same day replicas averaged only 7.5%. These results show that O3 (max) formation is directly proportional to temperature and ultraviolet flux.
4. Discussion of ozone control strategies
4.1. Empirical O3 (max) model
The results attained in environment air were used to determine a functional relationship between O3 (max), and the initial HC and NOx, temperature and ultraviolet flux:
O3 (max) = f [HC, NOx, temperature, ultraviolet flux]
Multiple regression modeling was used to select the optimum combination of predictor variables for an empirical O3 (max) model. The relationship was investigated by including terms in the mathematical model such as HCx and NOxy where x and y = 0.5, 1, 2 and 3.
The four-level design allowed fitting the O3 measurements using polynomial models that are up to cubic order in HC and NOx. Cross products and ratios, such as HCx, NOxy, HCx/NOxy, and NOxy/HCx, were also considered. These terms represent interaction between HC and NOx. The effects of temperature and ultraviolet flux were investigated by including T(avg), T(max), ultraviolet flux (avg) and ultraviolet flux(max) in linear form. Kelly and Gunst used this procedure in 1990 in Los Angeles California. The procedure provides an efficient means for determining the regression model with high coefficients of determination R2, for various subgroups of predictor variables. Terms such as NOxy/HCx, where y > x, were consistently found to be important.
Kelly and Gunst got the best-fit model for O3 (max) in Los Angeles by:
O3(max) = 129 + 2.8 NOx - 6.8 NOx2/HC + 19(Tavg - 21.1)
Note: The average temperature was 21.1°C.
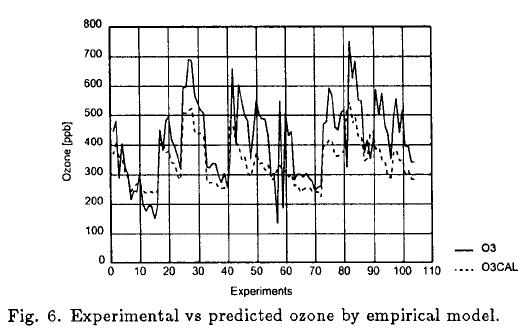
While for Mexico City, we got the best-fit when R2 = 0.76 by:
O3(max) = 195.063 + 1.12 NOx- 0.5 NOx2/HC + 0.115(Tpvg - 26.98)
Note: The average temperature was 26.98°C.
The model contains two terms to fit the dependency of O3 (max) on the initial HC and NOx precursors concentrations, and one term to fit the temperature dependency.
Figure 6 shows predicted values by the empirical model vs experimental O3 (max) obtained in Mexico City.
The empirical model let us get an isopleth diagram. Figure 7 shows contours of constant O3 concentration (isopleths) that were generated.
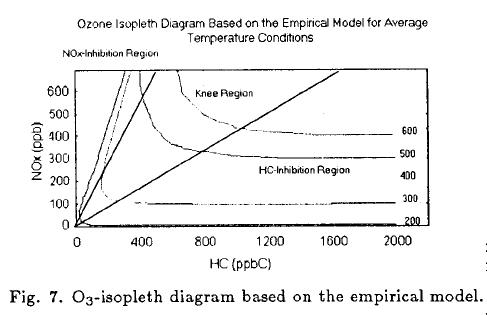
The empirical O3 isopleths are similar in shape to those generated by a mechanistic model. Thus, the empirical model is consistent with the chemical phenomena shown to be responsible of O3 formation under laboratory conditions. The model predicts the NOx-inhibition, the Knee and the HC- saturation regions. The characteristics of the three distinct regions shown in Figure 7 provide the foundations for discussions of O3 control strategies.
4.2. Conditions for control-strategy calculations
Ozone control can be evaluated with the empirical model developed from CAI experiments. Nevertheless the CAI experiments are not exact simulations of the real atmosphere. In the real atmosphere there are HC and NOx emissions into the air parcel and dilution during the day. Finally, the chambers reached higher O3 (max) than the one which was observed in the atmosphere on a given day. So less O3 is formed in the atmosphere due to dilution and dispersion.
We focussed on control strategies that reduce O3 (max) by 50%; specifically, changes in O3 (max) from 600 to 300 ppb found in the unperturbed chambers. O3 (max) control strategies were evaluated for initial HC/NOx ratios of 10, 20 and 30, due that 93% of all HC/NOx ratios were between 9 and 32 (in average 20.6) in the unperturbed chambers.
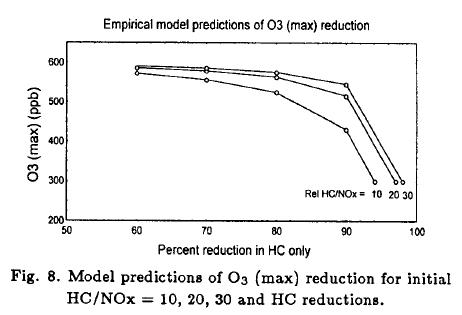
4.3. O3 (max) response to HC reductions
The response of O3 (max) to percentage changes in HC (NOx fixed) is shown in Figure 8. These HC reductions cause changes from the HC-saturation region to the Knee region in Figure 7. A 50% reduction in O3 (max) requires 94-98% reductions in HC for initial HC/NOx ratios of 10-30. There is a nonlinearly in the response of O3 (max) to reductions in HC alone after 80% of reductions or more.
4.4. O3(max) response to NOx reductions
The response of O3 (max) to percentage changes in NOx (HC fixed) is shown in Figure 9. These NOx reductions cause changes into the HC-saturation region in Figure 7. A 50% reduction in O3 (max) requires 74% reductions in NOx for initial HC/NOx ratios of 10-30. Variations are scarcely perceptible, due to the term 0.5NOx2/HC, which changed very little.
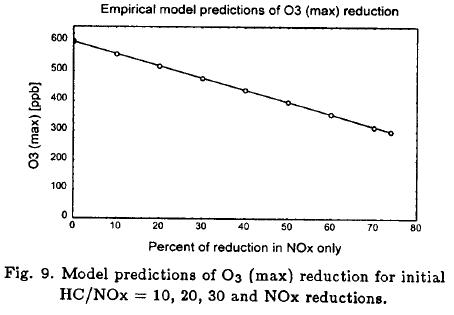
Atmosphere air in Mexico City (the control bag) usually had a HC/NOx ratio in the HC-saturation region of the isopleths curves shown in Figure 7. That means that a change in HC or NOx would move the system along HC-saturation region. So that, the best O3-control strategy is to reduce NOx emissions.
5. Conclusions
It was found that the daily variability of the initial HC and NOx concentrations, which are precursors of ozone formation, was large for each day the experiment was run. Despite this, an empirical model could be developed to correlate HC, NOx, and T(avg) to O3 (max). The empirical model was qualitatively similar to that Empirical Kinetic Modeling Approach Ozone Isopleths Model particularly. By the way, positive effect of temperature on O3 (max) was confirmed on captive air irradiation.
Ozone control strategies can be evaluated with the empirical model developed. For a 50% reductions in O3 (max), NOx reductions alone are clearly more effective than HC reductions. For this strategy a 74% reduction in NOx is needed for average temperatures and HC/NOx ratios prevalent in Mexico City.
Acknowledgments
This work was supported by PEMEX-Refinación, Gerencia de Investigación y Desarrollo Tecnológico.
The authors acknowledge the members of Atmosphere Chemistry Laboratory at Mexican Petroleum Institute for VOC4s analysis and Modeling Group for helping with the isopleths.
REFERENCES
Dunker, A. M., 1988. G.M. Research Laboratories Publication GMR-5844, Warren, MI. EPA-600, 1976. EPA-600/3-029, April, 1976. [ Links ]
Gunst, R. F. and N. A. Kelly, 1993. Technometries, vol. 35, No. 3. [ Links ]
Instituto Mexicano del Petróleo, 1994. Internal report of Mexican Petroleum Institute, Gerencia de Ciencias del Ambiente. [ Links ]
Jaffe, R. J., 1967. Air Pollut Control Assoc., 17, 460. [ Links ]
Jeffries, H., D. Fox and R. Kamens, 1975. EPA-650/3-75/011. [ Links ]
Kelly, N. A., 1980. Air Pollution Control Assoc. Montreal, Quebec, Canada.
Kelly, N.A., 1987. Air Pollutions Control Association Specialty Conference Hartford, Connecticut, USA. [ Links ]
Kelly, N. A. and R. F. Gunst, 1990. Atmosferic Environment, vol. 24A. No. 12, pp. 2991-3005. [ Links ]
Ripperton, L. A., J. E. Sickes, and C. W. Eaton, 1976. EPA-600/3-76/107. [ Links ]

