


 nueva página del texto (beta)
 Inglés (pdf)
 Artículo en XML
 Referencias del artículo
 Enviar artículo por email
 Citado por SciELO
  Similares en
SciELO
Similares en
SciELO 
 Permalink
Introduction
Soil CO2 is generated by rhizo-microbial respiration and organic matter microbial decomposition, and CO2 diffusion from the soil to the atmosphere, known as soil CO2 efflux, is the main carbon output from forest ecosystems (Lopes de Gerenyu et al., 2011; Leon et al., 2014). Soil water content and soil temperature explain around 60% of the spatial and temporal variation in soil CO2 efflux in most tropical forests (Luo and Zhou, 2006; Vargas and Allen, 2008; Satakhun et al., 2013). Soil CO2 efflux varies seasonally because of changes in soil water content (Kosugi et al., 2007; Katayama et al., 2009), and daily due to diel temperature variation (Vargas, Detto, Baldocchi, and Allen, 2010; Hanpattanakit et al., 2015). Soil topography can be an indirect factor affecting soil CO2 efflux because of the release of mineral nutrients from upper to lower areas or by flooding in low areas, which limits oxygen diffusivity (Lopes de Gerenyu et al., 2011; Wood, Matthews, Vandecar, and Lawrence, 2016; Cusack et al., 2019).
Most research on soil CO2 efflux for tropical forests has been done in wet tropical forests worldwide (Schwendenmann, Veldkamp, Brenes, O'Brien, and Mackensen, 2003; Sotta et al., 2004; Kosugi et al., 2007; Katayama et al., 2009; Kume et al., 2013; Tanner, Smith, Curry, and Twist, 2014; Hanpattanakit et al., 2015), despite that about 40% of tropical forests are seasonally dry forests (Sánchez-Azofeifa et al., 2005; Miles et al., 2006; Kume et al., 2013), which show a high proportion of soil carbon storage, compared to wet tropical forests (Mooney, 2011). In Mexico, of the few soil CO2 efflux studies that have been done in forests, most were in tropical dry forests of the Yucatan Peninsula (Cueva, Robles, Garatuza, and Yépez, 2016). In these studies, mean soil CO2 efflux (Vargas, 2012a, b) is like that of other tropical forests, even wet ones (Zanchi et al., 2012). Moreover, a study, done in a tropical dry forest after perturbation by a hurricane, shows that soil CO2 concentration can reach >7500 mg L-1 and reports the highest worldwide soil CO2 efflux (Vargas and Allen, 2008).
The Yucatan Peninsula has an important extension of tropical dry forest, where about 80% of the total forest carbon is in the soil (Geoghegan, Lawrence, Schneider, and Tully, 2010). The center of this peninsula shows some topographic features with low hills alternating with flat areas. Soils in the hills are much thinner but richer in organic matter and mineral nutrients, such as nitrogen and potassium, than those of flat areas (Dupuy et al., 2012). However, the thin layer of mineral soil and the exposed rocks on hills make it technically hard to measure soil CO2 efflux there. Therefore, to assess the effect of seasonality, soil CO2 efflux was measured in a semideciduous tropical forest in the center of the Yucatan Peninsula, in flat areas close to and far from hills during a year, during three marked seasons: early dry, dry, and rainy. The transition season (early dry season) is environmentally intermediate between the wet and the dry season and is distinct in most of the Yucatan Peninsula. This season shows lower air temperatures (below 20 °C) than in the wet and the dry seasons, strong winds (greater than 80 km h‑1), scattered rains (20-60 mm) and is locally known as “nortes” (Orellana, 1999). Because temperature has a strong effect on respiration (Vargas and Allen, 2008; Lambers and Oliveira, 2019), we expected that, in the early dry season, soil CO2 efflux values would also be intermediate between values of the wet and the dry season, also because of the low rainfall; and that soil temperature would have a greater influence in this season than in the other two seasons. Since water availability is the main limiting factor in tropical dry forests, and there are no seasonally flooded forests in our study area, we expected that soil CO2 efflux would be higher close to hills than far from them, especially in the wet season, because of organic matter runoff from the hills. Finally, we expected higher soil CO2 diel effluxes during the warmer hours of the early dry and wet seasons compared to the cooler night hours.
Materials and Methods
Study site
This study was done in Kaxil Kiuic Biocultural Reserve (20° 06’ 33” N, 89° 32’ 55” W, hereafter Kaxil Kiuic), located in the center of the Yucatan Peninsula, Mexico (Figure 1). A tropical dry forest of about 1800 ha characterizes Kaxil Kiuic, with a warm subhumid local climate (Aw), with a mean annual air temperature of 26 °C and a mean annual precipitation of 1000-1200 mm (Orellana, Islebe, and Espadas, 2003). In Kaxil Kiuic, rainfall is unequally distributed throughout the year in three distinct seasons: dry (March to May), wet (June to October), and early dry (November to February). The dominant vegetation is a medium-stature semideciduous tropical forest, in which 50-75% of the trees shed their leaves during the dry season and canopy height is 13-18 m in late-successional forests (Dupuy et al., 2012).
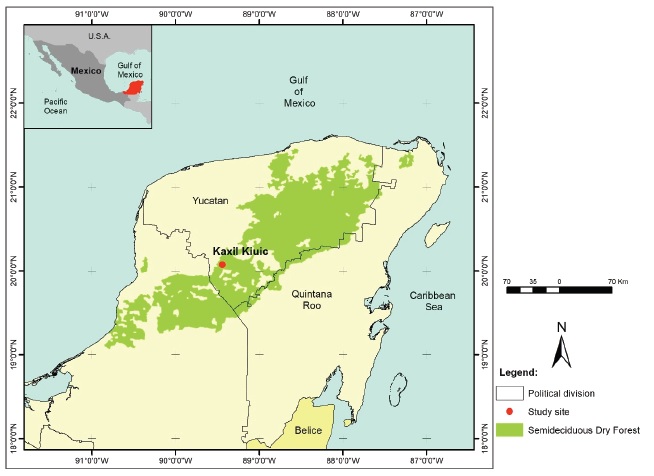
Figure 1: Location of the Kaxil Kiuic Biocultural Reserve showing the extension of the semideciduous tropical forest in the Yucatan Peninsula.
Kaxil Kiuic’s topography is shaped by flat areas and hills, whose altitude does not attain a height above 180 m asl, and with slopes between 10 and 25° (López-Martínez et al., 2013). The geomorphology of this region consists of karstic limestone. Cambisol and luvisol soils predominate in flat areas, and leptosol soils on hills and sites with rocky outcrops (Bautista-Zuñiga, Batllori, Ortiz, Palacio, and Castillo, 2003a). In the study area, leptosols predominate (Estrada-Medina, Canto, De los Santos, and O’Connor, 2016). Soils in the hills are much thinner but richer in nitrogen and potassium, organic carbon, and rocks than soils in flat areas (Dupuy et al., 2012). Also, hills have higher density and species richness, but lower aboveground biomass than flat areas (Hernández-Stefanoni, Dupuy, Tun-Dzul, and May-Pat, 2011).
Microenvironmental measurements
Microenvironmental conditions above the canopy were obtained from a meteorological tower that operated for several years in Kaxil Kiuic, which was less than a km from the study sites. Environmental parameters were photosynthetic photon flux (mol m-2 s‑1; LI190SB, LI-COR, Lincoln, NE), rainfall (mm; 525 Series, Texas Electronics, Dallas, TX), air temperature and humidity (HMP155A, Campbell Scientific, Logan, UT); additionally, soil temperature at 0.15 m depth (°C, TCAV, Campbell Scientific), and soil volumetric water content at 0.3 m depth (m3 H2O m-3 soil; CS625, Campbell Scientific) were also recorded. All sensors were connected to a data logger (CR3000, Campbell), data were recorded every 10 s, and 30-min averages were stored.
Soil CO2 efflux measurements
Measurements for soil CO2 efflux were completed in 7 plots of 400 m2 of late-successional forest, which were located within 4 clusters (1 ha each). These plots correspond to the Kaxil Kiuic monitoring forest carbon site and are based on the sampling used by the National Forest and Soil Inventory of Mexico (CONAFOR, 2011). Within the 7 plots, 8 subplots (2 in one of the plots) were set for the actual measurements of soil CO2 efflux (3 sampling points per subplot, 24 total). In each sampling point, 3 polyvinyl chloride (PVC) rings (0.2 m diameter, and about 0.08 m height), 4 m apart from each other, were inserted 0.05 m into the soil one month before the measurements. Twelve of the sampling points were in flat areas far from hills and the other twelve close to the limit of the base of a hill in different plots. Two of the sampling points were in the same plot approximately 20 m apart (one far and one close to the limit of the base of a hill).
Soil CO2 efflux was measured monthly, from March 2015 to February 2016, for two to three days using a dynamic-closed chamber system, whose diameter was 0.2 m, connected to an infrared gas analyzer (LI-8100A, LI-COR). Separation among PVC rings, inside each plot, and time for each measurement was established by preliminary measurements. For each sampling point, soil CO2 efflux was measured for two minutes. Soil temperature (8100 201 Omega Soil Temperature Probe, Omega Engineering Inc., Stamford, CT) and soil volumetric water content (Theta Probe ML2x, The Macaulay Land Use Research Institute and Delta T Devices, Cambridge, UK) were measured at 0.1 m depth into the soil next to each PVC ring at the same time as soil CO2 efflux was being measured. The order of measurements was maintained for all monthly measurements. For seasonal analysis, soil CO2 efflux measurements were in three groups: from March to May (dry season); from June to October (rainy season); and from November to February (early dry season).
Additionally, soil CO2 efflux, temperature, and volumetric water content were measured each hour for 24-h periods within each season. A chamber, coupled to a solar panel and a car battery, was placed in one randomly selected site in a flat area and programmed to measure the three variables each hour. Due to logistic constraints, there was only one measurement during the dry season (May 2015); two measurements during the wet season (September and October 2015); and three measurements during the early dry season (November and December 2015, and February 2016).
Soil organic carbon content
Around the end of the wet season, a soil sample (250 g, at a depth of 0.2 m) was extracted close to each group of PVC rings; thus, eight soil samples (four at the limit of the base of hills and four far from hills) were collected. Each sample was thoroughly mixed, and 50 g of it were dehydrated and crushed with a mortar, to obtain a 2 mg sample to measure organic carbon content in an elemental analyzer (Flash 2000 OEA, Thermo Scientific, USA). Measurements were done three times for each sample, and the results were averaged.
Data analysis
Differences in soil CO2 efflux and total carbon content between locations (close to and far from hills) were tested using t-tests, while differences in soil CO2 efflux among months and seasons were assessed using a repeated-measures ANOVA. To find the best model for the relationship of soil CO2 efflux with soil temperature and soil volumetric water content, simple and multiple linear regression analyses were applied for the season and for the whole year. Soil CO2 efflux and temperature during each 24 h measurement were plotted as time series, as well as mean diurnal photosynthetic photon flux, the diel air temperature above the canopy, soil temperature and volumetric water content at 0.15 m and 0.3 m, respectively, and cumulative precipitation from November 2014 to February 2016 to explore diel and seasonal trends of these variables during the study period. All analyses were done using R language version 3.1.0 (R Core Team, 2014). Means ± standard deviations are used in all figures and tables.
Results and Discussion
Instantaneous photosynthetic photon flux (PPF) above the canopy varied greatly during the day as well as among seasons with the highest mean values during the dry season (April-May) and lowest instantaneous and mean values during the early dry season (November-January; regularly lower than 800 μmol m−2 s−1) (Table 1, Figure 2a). During the early dry season mean air and soil temperatures were the lowest, compared to the dry and wet seasons (Table 1, Figure 2b). Cumulative precipitation was highest during the wet season, lowest during the dry season, and intermediate during the early dry season (Table 1, Figure 2b).
Table 1: Mean maximum photosynthetic photon flux (PPF), mean air temperature above the canopy, mean soil temperature at 0.15 m depth and cumulative precipitation for each season and across the year of this study (March 2015 to February 2016) in Kaxil Kiuic. Data are mean ± standard deviation.
| Season | Maximum PPF | Air temperature | Soil temperature | Cumulative precipitation |
| μmol m-2 s-1 | - - - - - - - °C - - - - - - - | mm | ||
| Dry | 1890.4 ± 230.9 | 28.2 ± 1.9 | 27.9 ± 1.9 | 42.4 |
| Wet | 1813.7 ± 245.7 | 26.7 ± 1.6 | 26.6 ± 1.6 | 559.2 |
| Early dry | 1438.1 ± 288.6 | 23.0 ± 2.7 | 23.3 ± 1.8 | 249.7 |
| Year | 1646.0 ± 333.9 | 25.9 ± 2.9 | 25.9 ± 2.4 | 851.2 |
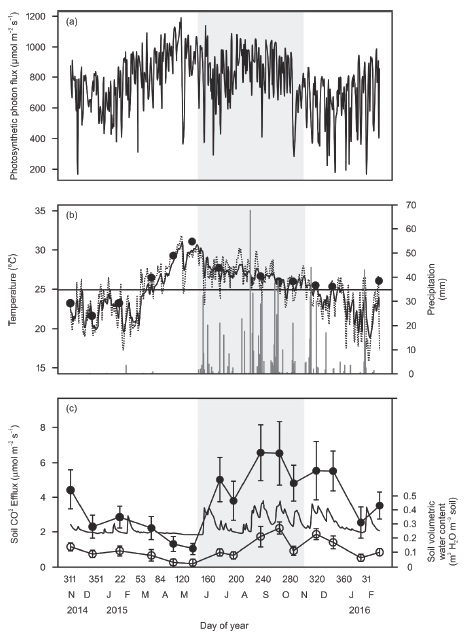
Figure 2: Monthly mean soil CO2 efflux, soil temperature, soil volumetric water content and micrometeorological measurements in the study site. Shaded area indicates the rainy season. (a) Photosynthetic photon flux above the canopy. (b) Soil temperature at 0.15 m depth (continuous line) and air temperature above the canopy (dashed line), and daily precipitation (bars). Closed symbols are mean soil temperature in the sampling sites. Horizontal line is the annual mean for air and soil temperature. (c) Mean soil CO2 efflux ± standard deviation (closed symbols) and mean soil volumetric water content at 0.1 m depth ± standard deviation (open circles, n = 24) during monthly sampling campaigns. Continuous line (without symbols) is the daily soil volumetric water content at 0.3 m depth.
Soil volumetric water content (at 0.3 m depth) followed rainfall and showed peaks in the early dry and wet seasons (Figure 2c) and dropped after a few days if no additional rainfall occurred. In the dry season, the soil volumetric water content showed the lowest values (Figure 2c). These results indicated that the early dry season in Kaxil Kiuic has three characteristics that allow us to separate it from the dry and the wet seasons: first, because of some sporadic rains, soil water content was similar to the mean annual volumetric water content and intermediate between the rainy and the dry season (Table 2, Figure 2b, c); second, average soil and air temperatures were lower than the annual mean (Figure 2b); and third, mean maximum PPF was lower than in the dry and wet seasons (Table 1, Figure 2a).
Table 2: Mean soil CO2 efflux, soil temperature, and soil volumetric water content at 0.1 m depth in the sampling points, for each season and for the year of the study. Data are mean ± standard deviation. Different letters indicate significant differences (P < 0.05).
| Season | Soil CO2 efflux | Soil temperature at 0.1 m depth | Soil volumetric water content |
| μmol m-2 s-1 | °C | m3 H2O m-3 soil | |
| Dry | 1.5 ± 0.4a | 29 ± 2.2 | 0.04 ± 0.03a |
| Wet | 5.3 ± 1.2c | 26.7 ± 0.9 | 0.15 ± 0.08b |
| Early dry | 4.1 ± 0.9b | 25.1 ± 1.3 | 0.14 ± 0.07b |
| Year | 4.0 ± 2.2 | 27 ± 1.9 | 0.12 ± 0.08 |
Annual mean soil CO2 efflux was 4±2.2 μmol m-2 s-1 (Table 2), similar to mean values reported by Vargas (2012a) in a comparable dry forest (4.5 µmol m-2 s‑1) and in a study for 23 tropical wet forests of the Amazons (4.2±1.8 μmol m-2 s-1; Zanchi et al., 2012), but it was considerably higher than that estimated by Dai et al. (2014) for the same site using a forest dynamics model (0.6 μmol m-2 s-1). This difference between the soil CO2 efflux predicted with mathematical models and that observed in the field has also been reported for other tropical dry forests (Kume et al., 2013), and can reflect the lack of understanding on how water, mineral nutrients, physicochemical conditions, and even photosynthesis affect soil respiration processes (Sánchez-Azofeifa et al., 2005).
Mean soil CO2 efflux differed significantly among seasons (F 0.05, 71 = 352.21, P < 0.05, Table 2). As predicted, mean soil CO2 efflux in the early dry season was intermediate between the rainy and the dry seasons and was like the mean annual soil CO2 efflux in Kaxil Kiuic (Table 2). Transition seasons, such as the early dry season in Kaxil Kiuic, are common in tropical forests (Sotta et al., 2004; Kume et al., 2013; Song et al., 2013; Tanner et al., 2014). During these transition seasons, it has even been suggested that sampling size to measure soil CO2 efflux could be smaller than during the other seasons (Kosugi et al., 2007).
Soil CO2 efflux had a greater coefficient of variation during the dry (29%) than during the wet (26.7%) and early dry (25.1%) seasons. Furthermore, mean soil CO2 efflux varied significantly among months, with the greatest values recorded in August and September and the lowest in May (Table 3). Mean soil temperature at 0.1 m depth was 27±1.9 °C during the study period and did not differ significantly among seasons (Table 2). However, the lowest soil temperature was recorded in December and the highest in May (Table 3). Mean volumetric water content at 0.1 m depth during the study period was 0.12±0.08 m3 H2O m-3 soil. This variable differed among seasons and showed the highest values during the early dry and wet seasons (Table 2). In terms of monthly values, the highest mean soil volumetric water content was recorded in September and the lowest in May (Table 3).
Table 3: Monthly mean values of soil CO2 efflux, soil temperature and soil volumetric water content at 0.1 m depth in the sampling points during the study period. Data are mean ± standard deviation. Different letters indicate significant differences (P < 0.05).
| Month | Soil CO2 efflux | Soil temperature at 0.1 m depth | Soil volumetric water content | Dates when measurements were performed |
| μmol m-2 s-1 | °C | m3 H2O m-3 soil | ||
| March 2015 | 2.2 ± 0.7 a | 26.5 ± 0.9 | 0.08 ± 0.04 | 10 – 11 |
| April 2015 | 1.3 ± 0.4 b | 29.3 ± 1.3 | 0.03 ± 0.01 | 13 – 14 |
| May 2015 | 1.0 ± 0.03 c | 31.1 ± 1.3 | 0.02 ± 0.01 | 12 – 13 |
| June 2015 | 5.0 ± 1.3 dg | 27.7 ± 0.7 | 0.10 ± 0.02 | 23 – 24 |
| July 2015 | 3.8 ± 1.1 e | 27.1 ± 0.5 | 0.08 ± 0.02 | 14 – 15 |
| August 2015 | 6.5 ± 1.6 f | 26.7 ± 0.8 | 0.21 ± 0.07 | 25 – 26 |
| September 2015 | 6.5 ± 1.8 f | 26.0 ± 0.5 | 0.27 ± 0.04 | 21 – 23 |
| October 2015 | 4.8 ± 1.0 d | 25.9 ± 0.05 | 0.11 ± 0.03 | 14 – 15 |
| November 2015 | 5.5 ± 1.7 g | 25.5 ± 0.5 | 0.23 ± 0.04 | 17 – 19 |
| December 2015 | 5.5 ± 1.1 g | 25.4 ± .3 | 0.17 ± 0.04 | 14 – 15 |
| January 2016 | 2.5 ± 0.9 a | ― | 0.05 ± 0.02 | 26 – 27 |
| February 2016 | 3.5 ± 0.8 e | 26.1 ± 1.2 | 0.10 ± 0.02 | 23 – 24 |
| Year | 4.0 ± 2.2 | 27.0 ± 1.9 | 0.12 ± 0.08 |
In January 2016 the temperature sensor was damaged.
We expected that soil water content would explain seasonal changes of soil CO2 fluxes and that soil temperature would influence soil CO2 fluxes only during the early dry season. Although both variables influence soil CO2 effluxes, soil water content has been found to play a more important role in tropical forests and forest plantations than soil temperature (Vargas and Allen, 2008; Adachi, Ishida, Bunyavejchewin, Okuda, and Koizumi, 2009; Satakhun et al., 2013). Our results showed that soil CO2 fluxes during the early dry season were poorly explained by either soil temperature or water content (Table 4). In most ecosystems soil temperature influences soil CO2 effluxes only when the soil water content is high (Sotta et al., 2004; Adachi et al., 2009; Ruehr, Knohl, and Buchmann, 2010; Leon et al., 2014). In our study site, during the early dry season, soil volumetric water content was not a limiting factor (values were close to those of the rainy season), and soil temperature showed a broad range of variation from low to average values (Table 2, Figure 3). Then, changes in the vegetation (deciduousness starts during the early dry season) are probably one of the causes of this poor relationship between soil water content and soil CO2 production (Vargas et al., 2010; Leon et al., 2014), which needs to be explored.
Table 4: Linear regression models for soil CO2 efflux as a function of soil temperature and soil volumetric water content at 0.1 m depth by season and year. SF = soil CO2 efflux (μmol m-2 s-1), Θ = soil volumetric water content (m3 H2O m-3 soil) and T = soil temperature (°C).
| Season | Model | Adjusted R2 |
| Dry | SF = 0.8345 + 16.1213Θ | 0.44 |
| Wet | SF = 3.8983 + 9.4376Θ | 0.21 |
| Early dry | SF = −5.88533 + 0.41186T | 0.19 |
| SF = 2.0006 + 14.3965Θ | 0.29 | |
| Year | SF = 1.7946 + 17.3916Θ | 0.45 |
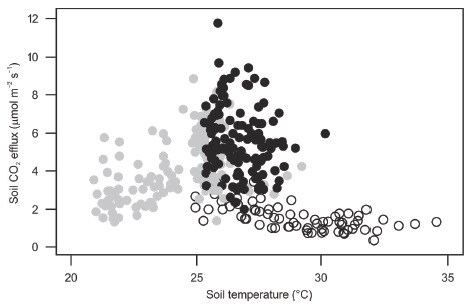
Figure 3: Soil CO2 efflux as a function of soil temperature during the study period in the Kaxil Kiuic Biocultural Reserve. Black closed circles are measurements for the wet season, gray closed circles for the early dry season, and open circles for the dry season.
During the study period, soil CO2 efflux was positively related to volumetric water content (Table 4, Figure 4). Yet, a negative relationship between soil CO2 effluxes and volumetric water content has been reported in some tropical forests (Adachi et al., 2005, Adachi, Bekku, Rashidah, Okuda, and Koizumi, 2006; Kosugi et al., 2007; Adachi et al., 2009; Song et al., 2013). In those studies, volumetric water content was never below 0.15 m3 H2O m-3, which was the maximum mean value in Kaxil Kiuic during the study period. Therefore, water availability may have been limiting soil CO2 efflux during the study period because the study site received less rainfall than the mean annual (851.2 mm versus 1150 mm).
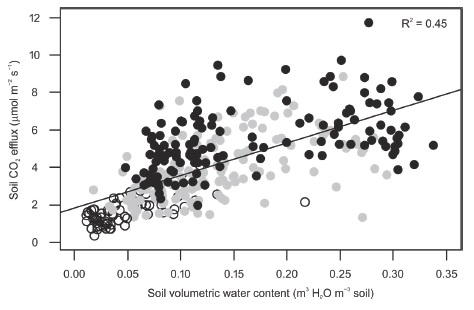
Figure 4: Soil CO2 efflux as a function of soil volumetric water content at 0.1 m depth during the study period. Black closed circles are measurements for the wet season, gray closed circles for the early dry season, and open circles for the dry season.
Although polynomial models that relate soil water content to soil CO2 efflux have been developed (Schwendenmann et al., 2003; Sotta et al., 2004; Adachi et al., 2009), they are difficult to interpret (Kosugi et al., 2007). In our study, only one polynomial model (soil water content to the third power) showed a slightly better fit than linear models, so we decided to keep the more significant linear models (Table 4).
Seasonal differences in soil CO2 efflux can be related not only to soil water content and temperature but also to the proportion of rhizo-microbial respiration. In a tropical forest, Lu et al. (2009) reported a lower proportion of soil CO2 efflux from rhizo-microbial respiration in the transition season than in the dry and rainy seasons. Similarly, Leon et al. (2014) noticed that soil CO2 efflux was higher in sites with higher vegetation cover, implying that rhizo-microbial respiration was likely increasing CO2 efflux. Leaf cover can be positively related to rhizo-microbial respiration as it is an indirect measure of tree productivity and carbon transfer to the roots (Luo and Zhou, 2006). In Kaxil Kiuic the highest leaf cover occurs in the rainy season, while some tree species start shedding their leaves during the early dry season suggesting that heterotrophic respiration can become more important for the soil CO2 efflux in early dry and dry seasons than in the rainy season. Nevertheless, soil volumetric water content was never lower than 0.2 m3 H2O m‑3 at 0.3 m depth in the study site (Figure 2c) and it has been indicated that, during dry seasons, the soil CO2 efflux can have a stronger correlation with the soil volumetric water content of deeper layers in the soil profile (Kume et al., 2013). Thus, evergreen trees can have a major role in deciduous forests because they are able to redistribute water to the soil surface during the dry season in certain areas (Nadezhdina et al., 2010). More studies on water redistribution and the proportion of rhizo-microbial respiration are needed to fully understand the functioning of this semideciduous dry tropical forest.
Soil CO2 efflux was consistently higher in sampling sites adjacent to hills than in sites far from hills, significantly so in March, June, July, September, and November (P < 0.05, Table 5). No differences in soil temperature and soil volumetric water content were found between the sites close to and far from the hills. However, the soil carbon content was higher in sites close to hills than in sites far from them (4.72±0.72% versus 3.39±0.19%; t = 3.4665, p = 0.01336). These values of organic carbon are in the range previously reported for these leptosols (4.6±0.4%); and carbonates reported in these types of soils are low (4.3±0.4%; Bautista-Zúñiga, Jiménez, Navarro, Manu, and Lozano, 2003b; Estrada-Medina, Bautista, Jiménez, González, and Aguilar, 2013; Estrada-Medina et al., 2016).
Table 5: Mean monthly soil CO2 efflux for soils adjacent to hills and soils far from hills in Kaxil Kiuic. Months marked with an asterisk are those with significant differences in soil CO2 efflux between sites (P < 0.05). Data means ± standard deviations.
| Month (2015 – 2016) | Soil CO2 efflux (mmol m-2 s2) | |
| Soils adjacent to hills | Soils far from hills | |
| March* | 2.6 ± 0.7 | 1.9 ± 0.4 |
| April | 1.5 ± 0.4 | 1.1 ± 0.4 |
| May | 1.6 ± 0.3 | 0.9 ± 0.3 |
| June* | 5.7 ± 1.2 | 5.0 ± 0.9 |
| July* | 4.5 ± 1.0 | 3.1 ± 0.7 |
| August | 7.1 ± 1.7 | 6.0 ± 1.3 |
| September* | 7.4 ± 2.1 | 5.7 ± 0.9 |
| October | 5.2 ± 1.0 | 4.4 ± 0.9 |
| November* | 6.5 ± 1.5 | 4.6 ± 1.3 |
| December | 5.8 ± 1.1 | 5.2 ± 1.1 |
| January | 2.7 ± 0.1 | 2.4 ± 0.9 |
| February | 3.8 ± 0.9 | 3.2 ± 0.5 |
| Study period | 4.4 ± 2.3 | 3.5 ± 1.8 |
Similar values of soil carbon content have been found in some secondary forests at different successional stages (Aryal, De Jong, Mendoza, Ochoa, and Esparza, 2017); however, although in this study differences in soil carbon were found in different soil layers, no association between organic matter or carbon content with soil CO2 efflux was found. An association between these variables has been reported for tropical forest plantations (Bae et al., 2013; Adachi et al., 2006; Epron et al., 2006). Moreover, in Kaxil Kiuic, phosphorous (P) content is much higher in soils from hills than in soils from flat areas (Dupuy et al., 2012) and a recent study reports that soil CO2 efflux increases during wet periods in soils with higher P content compared to lower P content (Cusack et al., 2019). Therefore, the higher soil CO2 efflux found in sites close to hills compared to sites far from hills may be related to higher soil C and P content in the former sites, possibly because of runoff from adjacent hills.
The limited six daily measurements of soil CO2 diel efflux were mostly within a small range of values (≤ 0.7 μmol m-2 s-1) and did not indicate any association with soil temperature, which showed a noticeable diel fluctuation only during May (dry season) and February (early dry season) (Figure 5). Some studies have reported high diel fluctuations of soil CO2 efflux and soil temperature, even during the dry season (Sotta et al., 2004; Adachi et al., 2009; Hanpattanakit et al., 2015), whereas other studies report no variation (Schwendenmann et al., 2003; Adachi et al., 2005; Kosugi et al., 2007). Tropical dry forests where soil CO2 efflux shows significant diel fluctuations have temperature amplitude of 3-6 °C (Sotta et al., 2004; Adachi et al., 2009; Hanpattanakit et al., 2015). In soils of Kaxil Kiuic, such amplitude was less than 1.1 °C during the wet season (Figure 5). It is recommended to do more 24-h cycles of soil CO2 efflux because of potential daily bias (Cueva, Bullock, López, and Vargas, 2017), especially during the early dry season and in different locations. Also, more measurements must be done in contrasting places such as open versus closed-canopy, and on sunny versus cloudy days to fully understand the dynamics of respiration within the soil of this study site. Additionally, further studies would allow a better understanding of soil CO2 efflux under unpredictable rainfall patterns due to global warming for this semideciduous tropical dry forest.
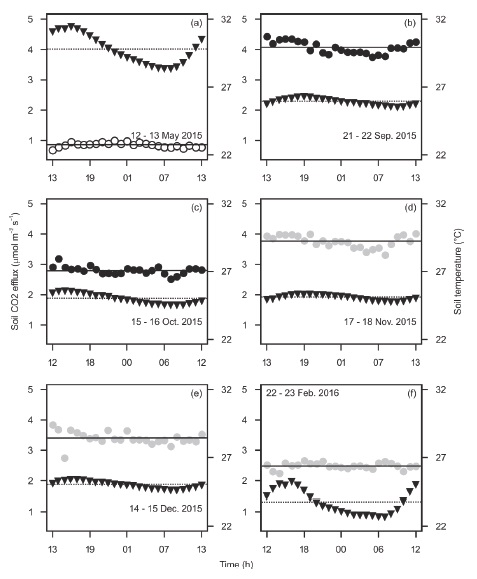
Figure 5: Daily changes of soil temperature (triangles) and soil CO2 efflux (circles) for different seasons. Open circles are for the dry season, closed circles for the wet season, and closed gray circles for the early dry season. Horizontal lines stand for the means of soil CO2 efflux (continuous) and soil temperature (dashed) during the 24 h period. Mean soil volumetric water content during each 24 h cycle was 0.02 (a), 0.3 (b), 0.12 (c), 0.28 (d), 0.19 (e), and 0.14 (f) m3 H2O m-3 soil. Each point is a single measurement.
Conclusions
Our results highlight the importance of measuring soil CO2 efflux in the semideciduous forest of Kaxil Kiuic, during the early dry season, when soil efflux was intermediate between the dry (lower soil CO2 efflux) and the wet seasons (higher soil CO2 efflux) and when soil CO2 efflux was influenced not only by volumetric water content but also by soil temperature. Moreover, sites close to hills showed a higher soil CO2 efflux than sites farther from hills in some months of the rainy and early dry season. These differences could result from runoff from adjacent hills, where some mineral nutrients are higher than in flat areas. Finally, no variation in soil CO2 efflux was found in any season when measuring 24-h cycles; other factors such as daily photosynthetic photon flux or tree species composition can be involved and need further study. More longitudinal and experimental studies in contrasting microclimatic and topographic conditions and with different tree and soil microbial species compositions are required to better understand the drivers of soil CO2 efflux in seasonally dry tropical forests, especially in the face of the current unrelenting climate change.
Availability of Supporting Data
The datasets used and/or analyzed during the current study are available from the corresponding author on reasonable request.
Authors’ Contributions
Conceptualization: F.A.M. and J.L.A. Methodology and data curation: F.A.M. and R.U.S. Statistical analysis: F.A.M. Supervision: R.U.S. and J.L.A. Validation: J.M.D. and J.L.A. Writing-original draft preparation: F.A.M. and J.L.A. Writing-review and editing: J.M.D. and R.U.S. Project administration and funding acquisition: J.L.A.

