


 nueva página del texto (beta)
 Inglés (pdf)
 Artículo en XML
 Referencias del artículo
 Enviar artículo por email
 Citado por SciELO
  Similares en
SciELO
Similares en
SciELO 
 Permalink
INTRODUCTION
The blood cockle Larkinia grandis (= Anadara grandis) (Broderip and Sowerby 1829) is a bivalve of comercial importance with distribution from Laguna Ballena in Baja California, Mexico, to Tumbes in northern Peru (Coan and Valentich-Scott 2012). Along with other ark clam species in the Arcidae family, L. grandis is extracted as part of the blood clam or “pata de mula” fishery along the Pacific coast of Mexico. The annual catch records for this species are made on the basis of reports by local fishermen to the authorities, with reported numbers frequently being lower than the actual extracted volume. Also, the catch record for this ark clam in official documents is not species-specific (CONAPESCA 2018), and there is currently no fishing ban to protect this bivalve (CONAPESCA 2017).
The relationships between shell dimensions and body weight are a useful tool for accurately interpreting the development and relative growth of bivalves. Previous research on L. grandis has provided information on age and growth (Cruz 1986), size and sexual maturity (Cruz 1987), and reproduction in the wild (Borda and Cruz 2004) and in cultures (Reynoso-Granados et al. 2012). However, most of this information has been documented for populations outside the Gulf of California. To our knowledge, morphometric studies of other Arcidae clams on the Pacific coast are scarce. Thus, the objective of this study was to evaluate the morphometric relationships (shell dimensions-weight) in a L. grandis population from the southeastern Gulf of California over the course of one year. The interaction between body weight and shell length is expected to better describe clam growth. This information is important for assessing growth and morphometric relationships in L. grandis and developing economically (fishery and aquaculture) and ecologically sustainable management plans for this species.
MATERIALS AND METHODS
Specimen collection was carried out monthly from August 2017 to July 2018 in El Cohui estuary (25º26′-19º38′ N, 105º48′-43º90′ W), Guasave municipality (Sinaloa, Mexico), in the central Gulf of California. The specimens (n = 80 every month) were hand-picked in the intertidal zone of the mangrove area and placed in a plastic container (50 L) with seawater for transportation to the laboratory. A Vernier caliper (0.01 mm) was used to measure shell length (SL) or máximum distance between the anterior and posterior margins, shell height (SH) or maximum distance from the umbo to the ventral margin, and shell width (SW) or maximum distance between the thickest parts of the 2 valves. Body weight (BW) was measured using a digital scale with 0.01 g accuracy.
Atypical values were cleaned from all datasets (Durbin-Watson’s test) and residuals were analyzed for normal distribution by the quantile-quantile plot (RStudio, R Core Team 2018). The relationships between the different shell dimensions and BW (n = 960) were estimated using the potential regression W = aLbe, where W is BW (g); L is SL, SH, or SW (mm); a is the intercept; b is the slope; and e is the typical error. In relations with different measurement units, when b = 3, BW-shell measurement relationships indicate isometric growth. The goodness of fit was analyzed using the Pearson correlation coefficient (r) (Sokal and Rohlf 1981). The coefficient of variation (CV) was calculated for all shell measurements as well as for BW. The estimation of the morphometric relationships between the variables was performed by adjusting the linear function of the data (least square method) using the formula LogY = Loga + b LogX + e (Ricker 1973), where LogY and LogX are the logarithm of SL and SH or BW and the logarithm of SH, SL, and SW, respectively; a is the intercept (initial growth coefficient); b is the slope (relative growth range of the variables); and e ≈ N(0, σ2 1) is a normal variate. The correction factor, CF =e 2 S 2 |Y; X/ 2, was used for the log-transformed values in order to avoid underestimations of mean values on the original scale. The degree of association between the variables was obtained with the coefficient of determination (R2). The confidence limits of b and the level of correlation (r) also were estimated. To identify significant differences in the isometric value of b (b = 1) or the allometric range (negative allometry b ˂ 1, or positive allometry b > 1) obtained in the linear regression, a Student’s t-test was applied (Ho: b = 1), with a 95% confidence level, using the following equation: t = (b - 1)/Sb, where t is the t-test value, b is the slope, and Sb is the standard error of the slope (Vasconcelos et al. 2018). Regression analysis was used to determine the morphometric data for the SL-SH, SL-SW, SH-SW, BW-SL, BW-SH, and BW-SW relationships (log-transformed).
RESULTS
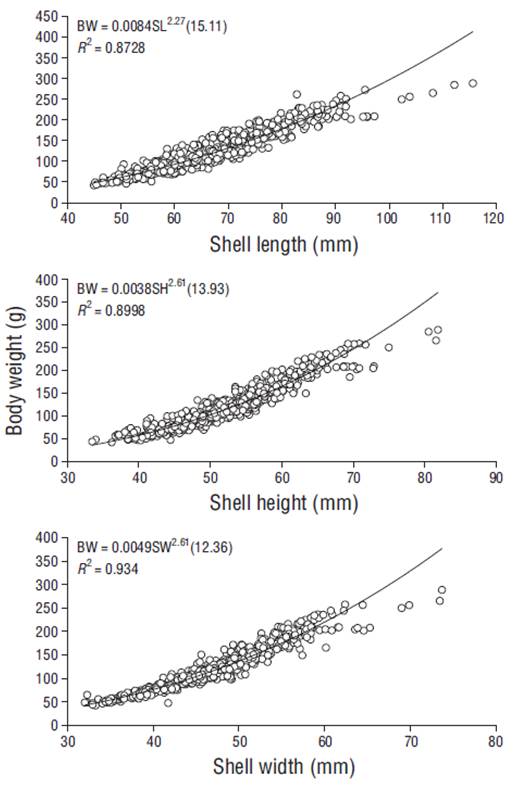
The shell dimensions considered in this analysis (n = 960) ranged from 44.57 to 142.00 mm for SL, from 31.15 to 85.50 mm for SH, and from 32.03 to 76.56 mm for SW, whereas BW varied from 41.90 to 337.00 g (Table 1). The CV values obtained for SL, SH, and SW were below 20%; however, the CV value for BW exhibited high dispersion (23%- 45%). The relationships between BW and SL, SH, and SW were nonlinear (Fig. 1). All coefficients of determination (R2) between BW and the different shell dimensions exceeded 0.87 and indicated negative allometric growth. The a and b values for the BW-SL and BW-SH relationships were 0.0084 and 2.27, and 0.0038 and 2.61, respectively. The strongest interaction was found between BW and SW (R2 = 0.934) and was expressed as BW = 0.0049SW2.61(12.36). The relationships between shell measurements showed r values between 0.88 (for SL-SW) and 0.95 (for BW-SH and BW-SW) (Table 2). Student’s t-tests revealed significant differences (P ≤ 0.05) in all L. grandis shell dimension-weight relationships, representing both negative (SL-SW and SH-SW) and positive (SL-SH, BW-SL, BW-SH, and BW-SW) allometric growth. The b values ranged from 0.8950 (for the LogSH- LogSW relationship) to 2.6240 (for the LogBW-LogSH interaction).
Table 1 Monthly descriptive statistical parameters for Larkinia grandis in the southeastern Gulf of California (2017-2018). SL = shell length, SH = shell height, SW = shell width, BW = body weight, SD = standard deviation, MAX = maximum limit, MIN = minimum limit, CV = coefficient of variation, CL95% = confidence limits for mean values at 95%.
| Parameter | Month | |||||||||||
| Aug | Sep | Oct | Nov | Dec | Jan | Feb | Mar | Apr | May | Jun | Jul | |
| SL (mm) | ||||||||||||
| Mean* | 80.86g | 81.09g | 69.11ef | 65.94cd | 66.84de | 62.18b | 63.65bc | 63.01b | 58.97a | 64.22bcd | 63.32bc | 70.00f |
| SD | 15.08 | 10.20 | 6.28 | 6.49 | 8.77 | 7.29 | 7.63 | 6.65 | 7.61 | 6.08 | 8.45 | 11.73 |
| MAX | 142.00 | 112.15 | 93.03 | 86.84 | 87.52 | 82.98 | 84.28 | 82.88 | 78.40 | 79.23 | 82.36 | 99.85 |
| MIN | 54.31 | 52.46 | 54.79 | 53.76 | 46.68 | 44.94 | 47.40 | 47.12 | 45.15 | 44.57 | 47.22 | 49.20 |
| CV (%) | 19 | 13 | 9 | 10 | 13 | 12 | 12 | 11 | 13 | 9 | 13 | 17 |
| CL95% | 79.48- | 79.71- | 67.73- | 64.55- | 65.45- | 60.80- | 62.27- | 61.62- | 57.58- | 62.83- | 61.94- | 68.62- |
| 82.24 | 82.47 | 70.48 | 67.31 | 68.21 | 63.56 | 65.03 | 64.38 | 60.34 | 65.59 | 64.70 | 71.37 | |
| SH (mm) | ||||||||||||
| Mean* | 60.43e | 61.75fe | 53.90cd | 51.57b | 52.39bc | 51.46b | 51.85b | 51.48b | 46.47a | 51.79b | 51.24b | 55.16d |
| SD | 8.80 | 6.40 | 4.76 | 6.05 | 6.76 | 6.10 | 6.37 | 4.90 | 6.57 | 3.87 | 5.53 | 8.18 |
| MAX | 81.84 | 80.53 | 70.12 | 85.50 | 69.26 | 70.29 | 64.74 | 64.05 | 61.59 | 63.65 | 64.61 | 72.04 |
| MIN | 45.17 | 44.31 | 43.61 | 43.92 | 36.73 | 36.22 | 31.15 | 38.52 | 33.48 | 40.28 | 37.08 | 39.53 |
| CV | 13 | 12 | 8 | 12 | 12 | 10 | 12 | 10 | 17 | 7 | 11 | 16 |
| CL95% | 59.44- | 60.76- | 52.91- | 50.58- | 51.40- | 50.47- | 50.86- | 50.49- | 45.48- | 50.80- | 50.25- | 54.18- |
| 61.41 | 62.73 | 54.88 | 52.55 | 53.37 | 52.44 | 52.83 | 52.45 | 47.45 | 52.76 | 52.21 | 56.14 | |
| SW (mm) | ||||||||||||
| Mean* | 53.54e | 53.99e | 48.65d | 45.58b | 47.97cd | 46.26bc | 47.32bcd | 46.11bc | 42.57a | 46.67bc | 45.99b | 49.17d |
| SD | 8.47 | 6.29 | 5.30 | 5.43 | 6.28 | 5.65 | 5.64 | 5.14 | 5.79 | 4.47 | 5.74 | 7.61 |
| MAX | 73.65 | 76.56 | 75.53 | 72.95 | 63.89 | 60.86 | 58.02 | 58.32 | 56.81 | 63.41 | 62.21 | 66.74 |
| MIN | 39.59 | 32.30 | 39.06 | 37.79 | 32.29 | 33.26 | 34.19 | 34.99 | 32.03 | 34.08 | 34.44 | 33.95 |
| CV | 14 | 14 | 10 | 12 | 13 | 11 | 13 | 11 | 17 | 10 | 12 | 17 |
| CL95% | 52.60- | 53.04- | 47.70- | 44.64- | 47.02- | 45.31- | 46.37- | 45.16- | 41.63- | 45.73- | 45.05- | 48.22- |
| BW (g) | 54.48 | 54.93 | 49.58 | 46.52 | 48.91 | 47.19 | 48.25 | 47.04 | 43.51 | 47.61 | 46.93 | 50.11 |
| Mean* | 172.07g | 173.71g | 133.18ef | 110.54bc | 128.08de | 115.31ab | 122.23cde | 110.40bc | 92.69a | 105.42ab | 109.93bc | 141.46f |
| SD | 62.37 | 41.97 | 33.98 | 32.54 | 48.62 | 35.81 | 37.88 | 32.52 | 33.71 | 24.19 | 39.25 | 63.94 |
| MAX | 337.00 | 309.10 | 281.60 | 214.60 | 265.80 | 235.70 | 215.00 | 205.80 | 184.10 | 182.90 | 244.20 | 329.00 |
| MIN | 74.50 | 64.50 | 69.20 | 47.10 | 48.00 | 41.90 | 50.40 | 47.50 | 43.60 | 46.00 | 50.10 | 51.20 |
| CV | 36 | 24 | 26 | 29 | 38 | 31 | 31 | 29 | 36 | 23 | 36 | 45 |
| CL95% | 165.53- | 167.17- | 126.64- | 104.00- | 121.54- | 108.77- | 115.69- | 103.86- | 86.15- | 98.88- | 103.39- | 134.92- |
| 178.60 | 180.24 | 139.71 | 117.03 | 134.61 | 121.84 | 128.76 | 116.93 | 99.22 | 111.95 | 116.47 | 147.99 | |
*Monthly mean values for each parameter; lines with diff erent letters denote signifi cant diff erences (ANOVA, P ≤ 0.05; SL: F = 49.53, P = 0.0001; SH: F = 38.85, P = 0.0001; SW: F = 22.89, P = 0.0001; BW: F = 29.00, P = 0.0001).
Table 2 Morphometric relationships (mm, log-transformed) and type of growth for Larkinia grandis in the southeastern Gulf of California (2017-2018).
| Equation | r |
b± SE
(CI 95%) |
t-test | Type of growth |
| LogSL = -0.0120 + 1.0658LogSH + 0.0280 | 0.93 | 1.0658 ± 0.0132 | -4.98* | +Allometric |
| (1.0400-1.0916) | ||||
| LogSL = 0.1696 + 0.9871LogSW + 0.0258 | 0.88 | 0.9871 ± 0.0168 | 0.77* | -Allometric |
| (0.9542-1.0200) | ||||
| LogSH = 0.2229 + 0.8950LogSW + 0.0280 | 0.90 | 0.8950 ± 0.0140 | 7.50* | -Allometric |
| (0.8676-0.9224) | ||||
| LogBW = -2.1264 + 2.3021LogSL + 0.0182 | 0.94 | 2.3021 ± 0.0269 | -48.40* | +Allometric |
| (2.2494-2.3548) | ||||
| LogBW = -2.4479 + 2.6240LogSH + 0.0188 | 0.95 | 2.6240 ± 0.0295 | -55.05* | +Allometric |
| (2.5662-2.6818) | ||||
| LogBW = -2.2905 + 2.6046LogSW + 0.0218 | 0.95 | 2.6046 ± 0.0281 | -57.10* | +Allometric |
| (2.5495-2.6597) |
r = correlation coefficient, b = slope, SE = standard error of b, CI = 95% confidence interval, SL = shell length, SH = shell height, SW = shell width, BW = body weight. Asterisk denotes a significant difference (P ≤ 0.05).
DISCUSSION
The blood cockle is a natural resource of economic importance on coasts along the Gulf of California, Mexico, yet growth and morphometry information is lacking for this species. The maximum and minimum shell lengths of the collected blood cockle specimens (44.57-142 mm) indicate that the morphometric analysis in the present study was performed on adult clams of reproductive age. For a wild population in Costa Rica, Cruz (1987) concluded that specimens of A. grandis measuring 21-24 mm total length (TL) were sexually mature adults. This coincides with Borda and Cruz (2004) reporting reproductive adulthood in A. tuberculosa at 25 mm TL. The CV for BW showed high dispersion (24%-45%), suggesting a possible reproductive event during sampling (Khalil et al. 2017). The shell measurement ranges, the 2 peaks observed for BW, and consequently the higher CV obtained for BW suggest the gonad maturation index as the main cause of the BW fluctuation (Menoud et al. 2016).
The regression equations for the relationships between BW and the 3 shell measurements indicate negative allometric growth in L. grandis, with values of b < 3. This means the BW increase is not proportional to the cube of SL. Gaspar et al. (2001) indicated that the negative allometric growth of bivalves is associated with adult specimens that remain mostly buried in sediment, where the shells are not exposed to waves, which was the case for the L. grandis population in this study. The slope of the BW-SL interaction (2.3021) for the entire L. grandis sample population was lower (2.356) than that reported by Cruz (1986) for the same species and lower (b = 3.188) compared with Anadara demiri in the Adriatic Sea, Italy (Morello et al. 2004). Since the present study spanned all 4 seasons, it is likely that the b values obtained for the interactions between BW and shell dimensions are strongly linked to the L. grandis reproductive strategy.
The correlation coefficient (r) of the log-transformed interactions ranged from 0.88 (SL-SW) to 0.95 (BW-SW and BW-SH), suggesting that BW-SW and BW-SH are the most appropriate morphometric relationships for describing the growth of L. grandis individuals from El Cohui, Sinaloa, directly in the field with the equations LogBW = -2.2905 + 2.6046Log SW + 0.0218 and LogBW = -2.4479 + 2.6240Log SH + 0.0188, without using a scale. Typically, the shape of an Arcidae cockle shell is elongated or squared (Meshram and Mohite 2016), and this is mainly determined by SL (máximum antero-posterior distance) and SW (maximum distance between the outermost edges of the 2 valves).
Our results represent essential preliminary information on the morphometry of L. grandis in El Cohui, Sinaloa, Mexico. We found that (1) the collected blood cockle population sample was dominated by adults; (2) the BW values suggest the occurrence of reproductive events during the sampling year; (3) the interaction between BW and Shell dimensions showed a nonlinear pattern; (4) all interactions between L. grandis measurements showed values of b < 1 for linear relationships and <3 for weight relationships, indicating negative allometric growth; and (5) BW-SW was the most solid relationship for describing this species’ relative growth. Also, this study is the first to provide essential morphometric data that confirms the current status of this blood cockle population and contributes to the development of strategies for the conservation and/or sustainable exploitation (fishery and aquaculture) of this economically important ark clam species on the southeastern coast of the Gulf of California.

