SciELO - Scientific Electronic Library Online

 
vol.43 número2Impacto del pastoreo del microzooplancton sobre la comunidad fitoplanctónica en una estación de surgencia costera localizada en la región norte de Baja California, MéxicoRespuesta de los productores primarios a la variabilidad hidrográfica en la región sur de la corriente de California índice de autoresíndice de materiabúsqueda de artículos
Home Pagelista alfabética de revistas  

Servicios Personalizados

Revista

Articulo

Indicadores

Links relacionados

  • No hay artículos similaresSimilares en SciELO

Compartir


Ciencias marinas

versión impresa ISSN 0185-3880

Cienc. mar vol.43 no.2 Ensenada jun. 2017  Epub 11-Jun-2021

https://doi.org/10.7773/cm.v43i2.2759 

Articles

Effects of the interannual variability of water column stratification on phytoplankton production and biomass in the northern zone off Baja California

Efectos de la variabilidad interanual de la estratificación de la columna de agua sobre la producción y biomasa del fitoplancton en la zona norte frente a Baja California

Eliana Gómez-Ocampo1  * 

Reginaldo Durazo2 

Gilberto Gaxiola-Castro1 

Martín De la Cruz-Orozco1 

Ramón Sosa-Ávalos3 

1 Departamento de Oceanografía Biológica, Centro de Investigación Científica y de Educación Superior de Ensenada, Carretera Tijuana-Ensenada, no. 3918, CP 22860, Ensenada, Baja California, México

2 Universidad Autónoma de Baja California, Facultad de Ciencias Marinas, Carretera Tijuana-Ensenada, no. 3917, CP 22860, Ensenada, Baja California, 22860, México

3 Centro Universitario de Investigaciones Oceanológicas, Universidad de Colima, Carretera Manzanillo-Barra de Navidad, km 20, CP 28860, Manzanillo, Colima, México


Abstract

The ocean off the Baja California Peninsula (Mexico) has been affected by interannual processes. Some of these processes have produced changes in oceanic circulation and the atmosphere, which have been reflected in the structure of the water column. Stratification, defined as the amount of energy needed to mix water throughout the water column, determines nutrient availability in the euphotic zone for phytoplankton growth. The aim of this study is to describe and relate the interannual variations of phytoplankton production and biomass with changes in the structure of the water column. To this end, we analyzed time series (1997-2016) for integrated Chlorophyll a, integrated primary production, pycnocline depth, mixed layer depth, and stratification indices along line 100 of the Investigaciones Mexicanas de la Corriente de California (IMECOCAL) program. The results showed 2 periods of high stratification and a decrease in phytoplankton production and biomass off Baja California, corresponding to the intrusion of subarctic water and El Niño 2015-2016. Finally, by using generalized additive models, we related 2 photosynthethic parameters-maximum photosynthetic rate and maximum light utilization coefficient-with water stratification. These relationships explained interannual variations in phytoplankton production in terms of water column stratification. The time series and the analysis reported here for IMECOCAL line 100 could be used to extrapolate the effects of interannual physical processes on phytoplankton in other zones off the Baja California peninsula.

Key words: phytoplankton; stratification; primary production; Baja California; IMECOCAL

Resumen

El océano frente a las costas de la península de Baja California ha sido afectado por diferentes procesos interanuales. Algunos de estos procesos han generado cambios en la circulación oceánica y en la atmósfera que se han reflejado en la estratificación de la columna de agua. La estratificación, definida como la cantidad de energía necesaria para mezclar una columna de agua, determina la disponibilidad de nutrientes necesarios para el crecimiento del fitoplancton. El objetivo de este artículo es describir y relacionar las variaciones interanuales de la biomasa y producción del fitoplancton con la estructura de la columna de agua. Para esto, se analizaron las series de tiempo (1997-2016) de clorofila a y producción primaria integradas, profundidad de la picnoclina y de la capa de mezcla y los índices de estratificación entre la superficie y los 100 y 200 m en la Línea 100 del programa Investigaciones Mexicanas de la Corriente de California (IMECOCAL). Los resultados mostraron que los periodos de mayor estratificación en la columna de agua fueron durante la intrusión de agua subártica 2002-2007 y El Niño 2015-2016, los cuales trajeron como consecuencia el mayor declive en la biomasa del fitoplancton (en ambos periodos) y de producción primaria (durante El Niño 2015-2016) en la zona norte frente a Baja California. Finalmente, se relacionaron la tasa fotosintética máxima y el coeficiente de utilización máxima de la luz, con el índice de estratificación por medio de modelos aditivos generalizados. Estas relaciones explicaron las variaciones interanuales en la producción primaria en correspondencia con la estratificación de la columna de agua. Las series de tiempo y el análisis presentado aquí para la línea 100 del IMECOCAL podrán ser extrapoladas a otras zonas frente a la península para entender la relación entre los procesos físicos con la biomasa y producción primaria del fitoplancton.

Palabras clave: fitoplancton; estratificación; producción primaria; Baja California; MECOCAL

Introduction

The ocean is a highly dynamic environment affected by a number of processes that take place at different spatial and temporal scales. The organisms that inhabit there are influenced by local processes, and these processes thus determine, to a great extent, the ecosystem’s productivity at a regional level (Daly and Smith 1993). The ocean surface layer is home to marine phytoplankton, the primary component of the food chain. Being autotrophic organisms, their largest abundance occurs in the well-illuminated ocean layer known as the euphotic zone. Given the importance of light in photosynthesis, irradiance is one of the main factors that modulate phytoplankton abundance (Strickland 1965). However, phytoplankton growth and biomass are limited by nutrient availability in the euphotic zone. In this regard, processes at different temporal and spatial scales become important because they determine the structure of the water column, which is directly related to productivity.

One of the major factors limiting the distribution of phytoplankton is water column stratification. Stratification is defined as the amount of energy required to mix water throughout the water column (Simpson and Bowers 1981); if the latter is strongly stratified, more energy will be required to mix it relative to a less stratified column. Stratification of the water column determines the availability of nutrients that are used for phytoplankton growth. The mixed layer depth (MLD) and mixing intensity are physical parameters related to stratification that strongly affect phytoplankton primary production by determining the exposure of phytoplankton to light and its losses by sedimentation (Jäger et al. 2008). A deep MLD leads to a decrease in phytoplankton abundance because the population is distributed throughout a larger volume of water, that is, dilution (Behrenfeld and Boss 2014). In addition, if light conditions change as a result of vertical movements associated with turbulence (deep MLD), phytoplankton will photosynthesize in accordance to the amount of incident light in the MLD (Marra 1978).

The ocean region off the coast of the Baja California peninsula has been affected by interannual processes. Some of these processes have led to changes in ocean circulation, which in turn have modified the structure of the water column. For example, El Niño 1997-1998 produced a deepening of the pycnocline as a result of the influence of tropical warm water transported by a coastal flow parallel to the coast with a poleward direction (Durazo and Baumgartner 2002). During La Niña 1998-1999, intensification of coastal upwelling events led to increased phytoplankton biomass (Lavaniegos et al. 2002). From 2002 to 2006, the weakening of the Alaska Gyre caused the anomalous intrusion of subarctic water off Baja California (Durazo 2009), leading to a decrease in phytoplankton production and biomass (Gaxiola-Castro et al. 2008, Espinosa-Carreón et al. 2015). The ocean warming caused by “The warm Blob” during 2013 and 2014 and El Niño 2015-2016 produced the highest reduction of phytoplankton biomass and production in the last 13 years at the southern boundary of the California Current (Gómez-Ocampo et al. 2017). However, although phytoplankton production and biomass in this region have responded to these interannual processes, the mechanisms through which these events cause variations in the structure of the water column remain unknown.

Since 1997, the Investigaciones Mexicanas de la Corriente de California (Mexican Investigations on the California Current; IMECOCAL for its acronym in Spanish) program has surveyed the region off Baja California. This has allowed for better knowledge and understanding of the many oceanic physical, biological, and chemical processes in this region (Durazo and Baumgartner 2002, Lavaniegos et al. 2002, 2015; Espinosa-Carreon et al. 2004, Gaxiola-Castro et al. 2008, Gaxiola-Castro 2010, Jeronimo and Gomez-Valdes 2010, Martínez-Gaxiola et al. 2010, Durazo 2015, Espinosa-Carreón et al. 2015, Martinez-Fuentes et al. 2016, Gómez-Ocampo et al. 2017, Lavaniegos 2017). However, although there is available information on physical, biological, and chemical variables, there is still insufficient understanding on how physical processes influence the interannual changes in phytoplankton biomass and production in the water column.

The aim of this article is to describe and relate the interannual variations of phytoplankton biomass and production with changes in the structure of the water column. To this end, the 1997-2016 time series for chlorophyll a, primary production, pycnocline depth, and MLD were analyzed, as well as the stratification indices between the surface and 100 and 200 m (Ф100 and Ф200, respectively) along IMECOCAL line 100 (L100IMEC ). L100IMEC is one of the most intensively sampled lines and, due to its location, it has been found to be representative of the response of the marine ecosystem to interannual processes that occur off the peninsula (Linacre et al. 2010). In addition, in order to understand the relationship between interannual variations in the structure of the water column and phytoplankton production, the relationship between photosynthetic parameters (maximum photosynthetic rate at light saturation [ PmB ] and the maximum light utilization coefficient [αB ]), derived from photosynthesis-irradiance experiments conducted at IMECOCAL sampling stations, is explored using stratification indices through generalized additive models (GAMs).

Material and methods

Data Sources

In order to estimate the average conditions in the study area, data derived from remote sensing were obtained for sea surface temperature (SST), chlorophyll (CHL), and sea surface wind in the southern end of the California Current, off Baja California (28ºN-33ºN, 120ºW-114ºW; Fig. 1). The monthly composite images (spatial resolution of 4 × 4 km) of SST and CHL concentrations derived from the MODIS-Aqua sensor were downloaded from the ERDDAP database (http://coastwatch.pfeg.noaa.gov/erddap/index.html) for the 2003-2015 period. The primary production (PP) data obtained with the Behrenfeld and Falkowski (1997) Vertically Generalized Production Model (VGPM) was obtained from Oregon State University (OSU, http://www.science.oregonstate.edu/ocean.productivity/). The climatology for the mixed layer MLD, with a spatial resolution of 0.5º × 0.5º, was obtained from the Monthly Isopycnal and Mixed-layer Ocean Climatology (MIMOC, http://www.pmel.noaa.gov/mimoc/) produced by the National Oceanic and Atmospheric Administration (NOAA). Wind data considered for this work were obtained from the National Centers for Environmental Prediction (NCEP). The zonal and southern components (0.25º spatial resolution and 1-day temporal resolution) are available on NOAA’s website at https://www.ncdc.noaa.gov. Wind stress curl was calculated from its components according to Trenberth et al. (1990). For all variables, long-period averages (hereafter average conditions) were calculated according to the length of the time period for which data was obtained. From the PP data obtained from OSU, average conditions were calculated for the northern zone off Baja California (28ºN-32ºN) from 1998 to 2002 for data derived from the SeaWiFS sensor and from 2003 to 2016 for data obtained from the MODIS-Aqua sensor (both with a monthly resolution of 18 × 18 km). This climatology was subsequently used to estimate the anomalies from 1998 to 2016, which were defined as the observed value minus the calculated average.

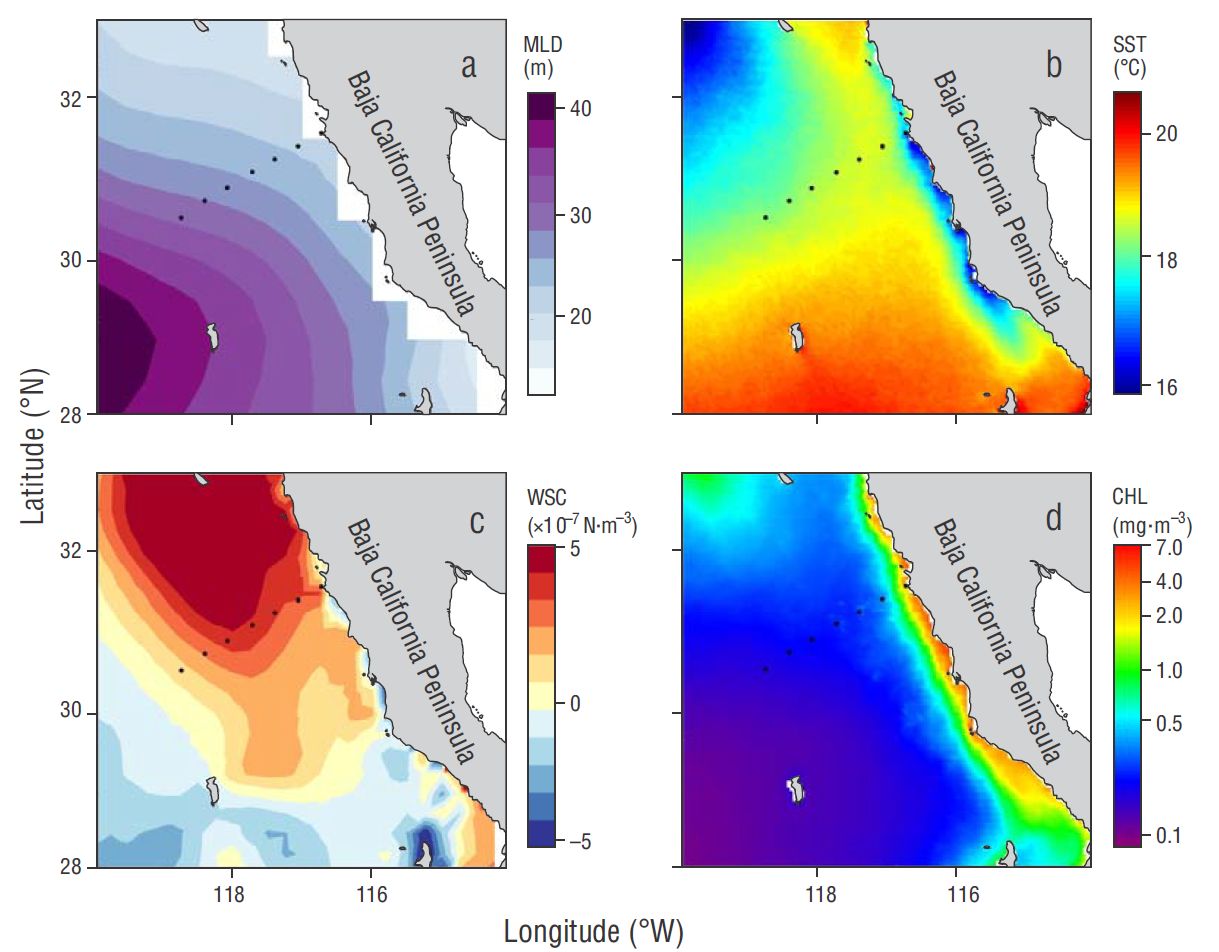
Figure 1 Horizontal distribution of the mean conditions for (a) mixed layer depth (MLD) (b) sea surface temperature (SST), (c) wind stress curl (WSC), and (d) satellite chlorophyll (CHL). Dots indicate the location of the hydrographic stations where in-situ data were collected along line 100 of the Investigaciones Mexicanas de la Corriente de California (IMECOCAL) program. 

The interannual variations in the structure of the water column and phytoplankton biomass in oceanic and coastal areas were analyzed using data from the stations located along L100IMEC (Fig. 1). This line was selected because it was the IMECOCAL line representative of the northern zone off Baja California with the largest number of temperature, salinity, and chlorophyll a (Chla) records from 1998 to 2016. Cruise averages were calculated for the variables analyzed at the L100IMEC stations representative of the coastal zone (stations 30 and 35) and the oceanic zone (stations 45, 50, 40, 55, and 60) (Gaxiola-Castro et al. 2010, Durazo 2015). Phytoplankton Chla samples were obtained from water samples collected with Niskin bottles at standard depths (0, 10, 20, 50, and 100 m) and analyzed with the fluorimetric method (Yentsch and Menzel 1963, Holm-Hansen et al. 1965). Temperature and salinity CTD (Sea- Bird) data were used to estimate MLD following the method proposed by Kara et al. (2000) and modified by Jeronimo and Gomez-Valdes (2010) for the IMECOCAL zone. Pycnocline depth ( Z Pyc ) was calculated according to Fiedler et al. (2013) . The stratification parameter (Ф) between the surface and 100 m and the surface and 200 m depth (Ф100 and Ф200, respectively) was calculated according to Simpson and Bowers (1981). Chla was integrated into the water column from the surface to 100 m depth using the trapezoidal rule to estimate integrated Chla (Chla int, mg m-2).

The photosynthesis-irradiance experiments (P-I curves) were carried out onboard during some oceanographic campaigns at oceanic stations, with water samples collected between 10:00 and 14:00, local time, at a depth corresponding to 30% surface irradiance. Water was collected with 5-L Niskin bottles to fill 27 flat 250-mL polystyrene bottles (Nucleon), which were spiked with 100 μL NaH14CO3 (~5 μCi). Bottles were placed in a Morel incubator (Marcel et al. 1994) for ~2 h under a light gradient of 1 to 900 mol quanta m-2 s-1 generated by a 500 W tungsten halogen lamp. Carbon assimilation rate (P, mg C m-3 h-1) was estimated from the incorporation of 14C during incubation, by subtracting the baseline values (time = 0), and was normalized with respect to Chla values measured at a depth of 30% surface irradiance in each experiment ( PB , mg C [mg Chla h]-1). The αB (mg C [mg Chla h]-1 [ mol quanta m-2 h-1]-1) and PmB (mg C [mg Chla h]-1) parameters were calculated with the hyperbolic function described by Jassby and Platt (1976): PB = PmB tanh (E L αB /PmB ), where E L is the irradiance of the tungsten halogen lamp measured from the inside of each bottle in the incubator with a QSL 100 (Bio-spherical Instruments). In order to represent the interannual variation in photosynthetic parameters in the northern zone off Baja California and given the scarcity of the P-I experiments for L100IMEC, αB and P m B averages were calculated for the stations of IMECOCAL lines 100, 103, 110, and 113. The criterion for using this average stems from the fact that the variability in the physical and biological conditions in the region north of Vizcaíno Bay (28ºN) is spatially homogeneous in response to the different temporal scales (Gaxiola-Castro et al. 2010, Durazo 2015). Therefore, phytoplankton communities in this area would be expected to be similar. The information on the methods and equipment used during the IMECOCAL cruises is detailed in http://imeco-cal.cicese.mx/.

Statistical analysis

The relationship of trends PP and water column structure was explored using GAMs (Hastie and Tibshirani 1986). This method fits non-linear relationships between variables, which are expressed as a curve from a smoothed function. In contrast with linear models, GAMs allow assigning an exponential distribution (Poisson, binomial, gamma, or normal) to the dependent variable.

In order to explain the variation in PP in terms of phytoplankton physiology, the αB and PmB parameters were related to structure of the water column represented by Ф100. To obtain a more robust statistical fit, P-I experiments carried out between 1998 and 2013 were used (no experiments were conducted in 2014 and 2016) at different stations of the IME-COCAL lines ( n = 273). The relationships were fitted with the R program for statistical calculations using the ''mixed GAM computation vehicle'' (mgcv) package (Wood et al. 2015). The mgcv package sets curve functions to the terms of the model and makes a cross- validation to determine the optimal smoothing degree (i.e., degrees of freedom) (Wood 2006). The best distribution was assigned to the predictor variables αB and PmB using the χ-square goodness-of-fit test.

Results

Average conditions in the study area

In order to characterize the horizontal distribution of some variables related to water column structure and productivity off Baja California, average conditions in the study area were obtained for MLD, SST, wind stress curl, and surface chlorophyll (Fig. 1). Average MLD and SST show higher values offshore and in the oceanic area to the south of the Baja California peninsula (Fig. 1 a, b). In contrast, average wind stress curl and chlorophyll values derived from satellite imagery were higher in the coastal zone and decreased off-shore and to the south of the peninsula (Fig. 1 c, d). Therefore, 2 typical average conditions were observed in the study area. The first occurs in the coastal area and off the northern part of the peninsula, and seems to be more dynamic according to the wind stress curl values; consequently, the water column is expected to be less stratified. The second, which is less dynamic, occurs mainly in the oceanic area and off the southern part of the peninsula, with conditions typical of a more stratified environment.

1997-2016 time series in L100IMEC

The effect of the interannual variability in water column structure on phytoplankton was characterized from time series of the variables of interest in the L100IMEC coastal and oceanic areas. Particular periods during which the Chla int signal showed obvious variations were selected (Fig. 2a). These periods correspond to the period from 2002 to 2006 (anomalous intrusion of subarctic water), La Niña 2008, and the ocean warming during 2013 to 2016 resulting from “The warm Blob” and El Niño 2015-2016.

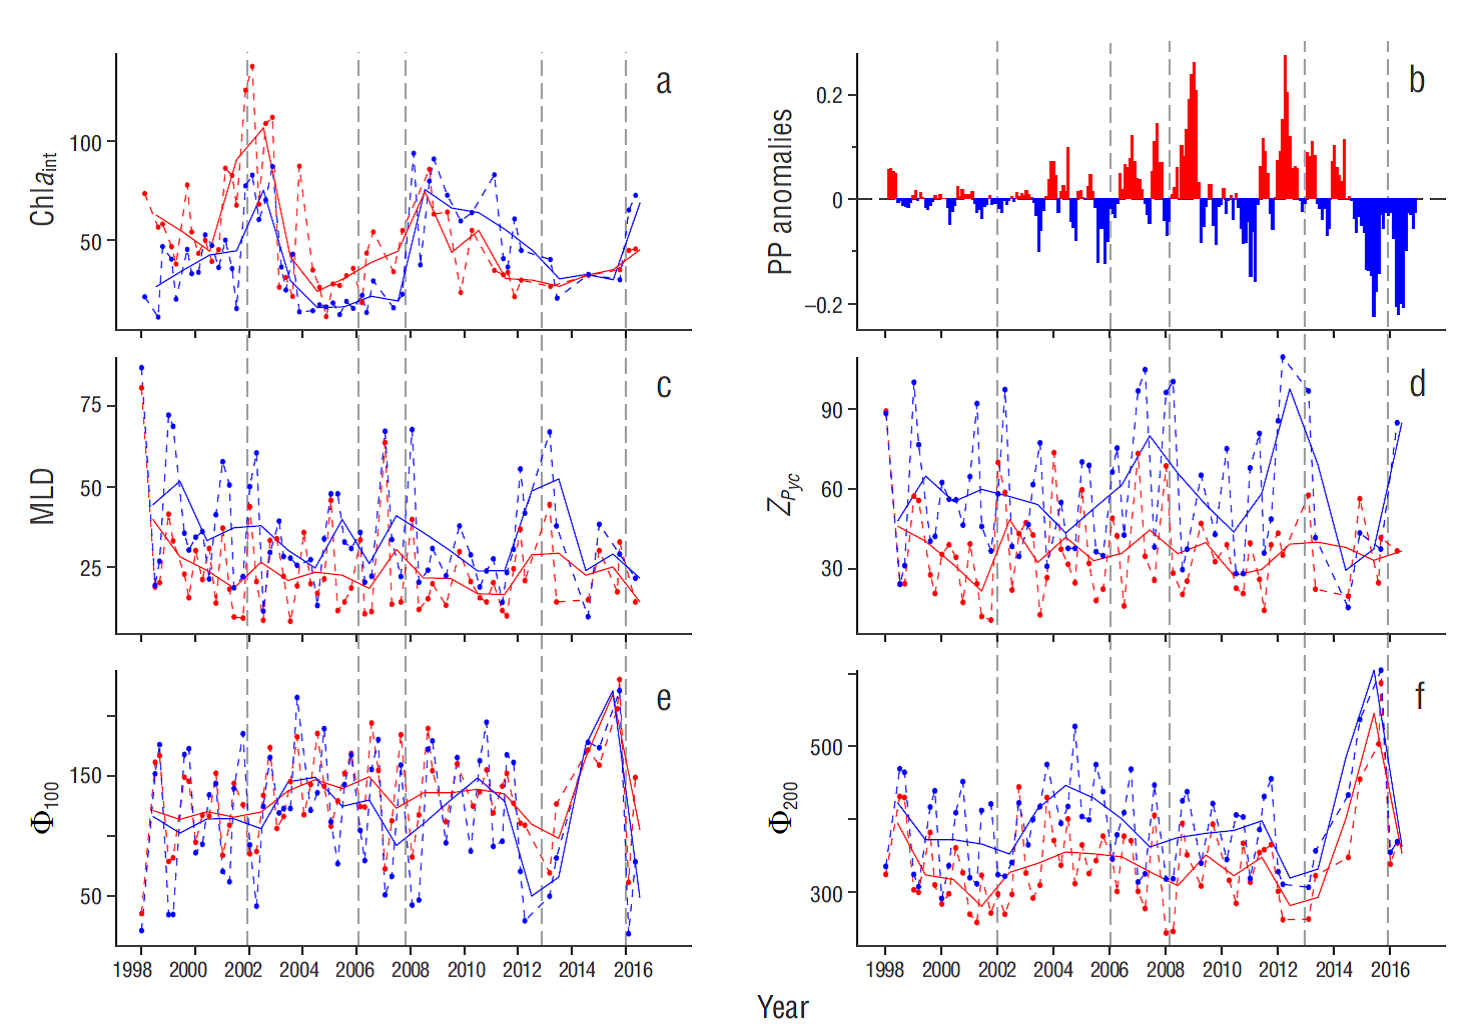
Figure 2 Time series (1998-2016) for (a) water-column integrated chlorophyll a (Chlaint, mgꞏm-2), (b) primary production (PP, g Cꞏm-2ꞏd-1) anomalies obtained from SeaWiFS (1998-2002) and MODIS-Aqua (2003-2016) sensors, (c) mixed layer depth (MLD, m), (d) pycnocline depth (Z Pyc , m), and water column stratification parameter at (e) 100 and (f) 200 m depth (Ф100 and Ф200, respectively; Joules) along IMECOCAL line 100. Colors indicate the time series for coastal (red) and oceanic (blue) stations. Dashed color lines denote the monthly mean and solid color lines represent the yearly mean. Gray dashed lines indicate the periods selected for the analysis.. 

The time series of the annual Chla int average showed a clear response to interannual events in coastal and oceanic areas (Fig. 2a). The lowest Chla int values (< 40 mg m-2) in the coastal and oceanic areas occurred between 2002 and 2007. In contrast, La Niña 2008 was associated with the maximum Chla int values of the time series in both areas, with similar values in the coastal (~76 mg m-2) and oceanic (~75 mg m-2) areas. From 2008 to late 2016 there was a decline in Chla int values in the oceanic area, reaching minimum values as low as ~30 mg m-2 but slightly higher compared to those observed during the subarctic water intrusion (2002 to 2006). In 2013 Chla int remained relatively unchanged until 2015, when it increased. In the coastal area the lowest Chla int values were recorded between 2011 and 2014 and were similar to those observed during the subarctic water intrusion. In this area, Chla int increased in 2014 until reaching ~45 mg m-2 in 2016.

Phytoplankton production in the northern zone off Baja California showed periods with increasing and decreasing values through the time series (Fig. 2b). During the intrusion of subarctic water, no definite trend was observed. However, conditions during La Niña 2008 led to a rise in PP rates. Afterwards, due to the “The warm Blob” effect during 2014, phytoplankton production dropped and attained even lower levels during El Niño 2015-2016.

MLD was deeper in the oceanic than in the coastal area, but variation was similar in both areas from 1998 to 2016 (Fig. 2c). Aspects worth noting are the reduction in the thickness of the mixing layer during the subarctic water intrusion and the particularly noticeable deepening in the oceanic area in 2004. A period of shallow MLD also took place during La Niña 2008, reaching a minimum value in 2011 in the coastal and oceanic areas (12 and 25 m, respectively). However, the most superficial MLD values in both areas occurred from 2010 to 2012, after which the mixed layer became deeper in the oceanic area until reaching a maximum depth of ~50 m in 2013 under the influence of “The warm Blob”.

Pycnocline depth (Z Pyc ) was more variable in the oceanic than in the coastal area (Fig. 2d). In 2004, during the subarctic water intrusion, there was a slight reduction in Z pyc in the oceanic area (~40 m). The same behavior was observed during 2010, when Z Pyc reached its lowest in both areas (~30 and 45 m in the coastal and oceanic areas, respectively). However, the deepest Z Pyc value (~90 m) was recorded in the oceanic area in 2012, prior to “The warm Blob”. From that year, the pycnocline in this zone became shallower and reached the value closest to the surface in 2014 (~30 m). Subsequently, with the onset of El Niño, Z Pyc deepened in 2015 and reached its maximum value in 2016, with a value similar to the one observed in 2007 (~80 m, first peak in the time series). Although variations were not as marked in the coastal area as in the oceanic area, an aspect worth noting is the slight deepening of the pycnocline during the subarctic water intrusion in 2002 and from 2012 to 2016, under the influence of “The warm Blob” and El Niño.

The stratification indices Ф100 and Ф200 showed a similar variation in both areas (Fig. 2e, f). The time series for both indices reveal an increase in the stratification of the water column during the intrusion of subarctic water (up to Ф100 ~ 150 J m-3 in both areas, and Ф200 ~ 450 J m-3 and Ф200 ~ 350 J m-3 in the oceanic and coastal areas, respectively) and the peak observed in 2015 after the “The warm Blob” and the onset of El Niño 2015-2016 ( Ф100 ~ 225 J m-3 and Ф200 > 500 J m-3 in both areas).

Discussion

Of all the variables analyzed, phytoplankton biomass was the one that best projected the interannual variability due to the various events that influenced the ocean off the northern part of Baja California. Our hypothesis is that high-stratification periods can reduce phytoplankton biomass and affect phytoplankton photophysiology (decreased αB , increased PmB ), and these changes are in turn reflected in the variations in PP.

Stratification was associated with decreasing and increasing phytoplankton production and biomass during the intrusion of subarctic water, La Niña 2008, and the ocean warming caused by “The warm Blob” and El Niño 2015-2016. A marked water column stratification was observed during the warm periods and the intrusion of sub-arctic water, coupled with the reduction in MLD and Z Pyc . In a poorly mixed water column, phytoplankton can remain in the upper, well-illuminated layer during sufficient time to maintain a population (Huisman 1999). In contrast, when the water column is well mixed, phytoplankton is transported throughout it and, in time, each microorganism experiences the depth -averaged light intensity, which decreases according to MLD. As a result, the depth-averaged specific PP drops as the depth of the water column increases (Huisman 1999, Diehl et al. 2002). In addition, MLD and mixing intensity are related to the accumulation of biomass through the losses of phytoplanktonic cells by sedimentation (Jäger et al. 2008). The probability that a phytoplanktonic organism or a colony sinks below the euphotic zone decreases as mixing intensity increases (Huisman et al. 2004). This occurs because turbulent mixing disperses phytoplankton throughout the water column, which partially offsets sedimentation. In general, losses by sinking affect primarily organisms that sink rapidly (e.g., diatoms) in shallow and poorly mixed water columns (Diehl et al. 2002). In summary, a poorly mixed water column (high stratification) favors PP rates but restrains the accumulation of biomass, as observed in the period of subarctic water intrusion between 2003 and 2005 and during “The warm Blob” in 2013-2014 (Fig. 2).

The largest reduction in PP rates was observed during El Niño 2015-2016, despite the fact that stratification in the northern region off Baja California was the highest in the past 19 years. This may have occurred because, for the first time in history, there was a warm event that preceded an El Niño event (Jacox et al. 2016). The marked deepening of the pycnocline and of the mixed layer during “The warm Blob”, coupled with the high water column stratification during El Niño 2015 (Figs. 2d-f), probably limited the availability of nutrients in the euphotic zone, leading to a decrease in phytoplankton growth rates and hence resulted in lower PP. In addition, the warming of the upper ocean layer (0-100 m) prompted by both events limited phytoplankton photosynthesis.

The depth of the pycnocline and the mixed layer showed greater variability in the oceanic area. This may be due to the prevalence of remote forcings over local forcings (Durazo et al. 2017). In general, in addition to remote signals, the coastal environment is also influenced by local forcings that can mitigate temporal variability. Therefore, Z Pyc and MLD in the oceanic area best represent the interannual variability in the northern zone off Baja California.

In order to assess the relationship between the variability of phytoplankton production and stratification, GAMs were used to determine the relationship between 2 of the characteristic phytoplankton photosynthetic parameters, αB and PmB , and the Ф100 stratification index (Fig. 3). PmB is associated with enzymatic photosynthetic processes and depends on factors such as temperature (Eppley 1972), nutrient concentration (Glover 1980) and cell size (Malone 1980), among others. The αB parameter depends on cell size (Taguchi 1981), pigment composition (Handall 1970), and nutrient availability (Platt et al. 1992). In this work, αB showed high values when the water column was more mixed (low Ф100 values, Fig. 3a), whereas PmB increased along with stratification (increase in Ф100, Fig. 3b) . These relations explained the interannual variations in PP in terms of phytoplankton physiology in the northern region off Baja California.

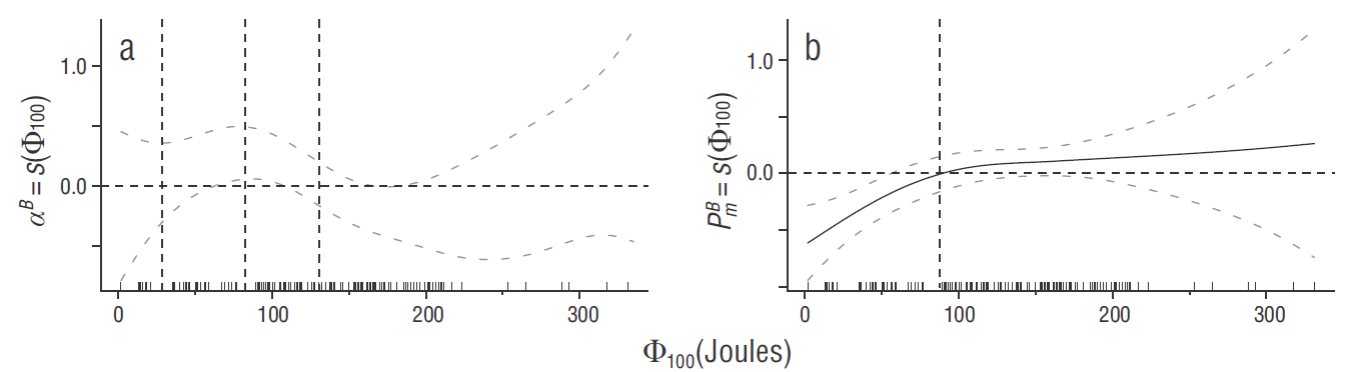
Figure 3 Partial response of (a) the maximum light utilization coefficient (αB , mg C [mg Chla]-1 h-1 [ mol quanta m-2 s-1]-1)) and (b) maximum photosynthetic rate ( PmB , mg C [m Chla h]-1) to the water column stratification parameter at 100 m depth ( Ф 100, a and b), as defined by the generalized additive models (GAMs). The smoothing functions (S) are represented as solid lines and the 95% confidence intervals as dashed lines. Rugged lines on the x-axes represent the observed Ф100 values. The y-axis labels show the GAM smoothing function. The vertical dashed lines represent the threshold values of the change from positive to negative (or viceversa) influence of the predictor variable ( Ф100) on the response variable (αB , PmB ). 

The above results suggest that PP rates are influenced by stratified environments (Huisman 1999, Diehl et al. 2002). This relationship is supported by the analysis with GAMs, revealing that high stratification is related to peak maximum photosynthetic rates. In addition, it is supported by the temporal variation in the PmB parameter, which peaked in 2003, when increased stratification and PP cooccurred (Fig. 4a). The increased PmB could be related to the photoacclimation of small phytoplankton cells-such as cyanophyta and prochlorophyta-at high irradiance levels, as suggested by the results of Geider et al. (1993); these authros observed changes in PmB between phytoplankton of different cell sizes, with low PmB in large diatoms at the same growth irradiance. On the other hand, αB was higher in turbulent environments (well-mixed water column, less stratification), likely due to the presence of large phytoplankton cells that were photoacclimated at low irradiances, since they are displaced throughout the water column. These differences in magnitude due to phytoplankton size had been previously reported for the same study area by Gonzalez-Morales et al. (1993). Sosa-Avalos et al. (forth-coming 2017 Sep) found that the variability in αB resulted from spatial and temporal changes in phytoplankton populations, which were dominated mostly by diatoms and dinoflagellates during spring. It is precisely at this time of the year when the water column is poorly stratified due to the presence of more intense winds and coastal upwelling events (Durazo 2015). This was observed in 2007, the year that showed poor stratification coupled with maximum PP rates, an increase in biomass, and the highest αB value in the time series (Figs. 2 y 4b). Therefore, high αB in periods of reduced stratification suggests the presence of large phytoplankton species, while high PmB in periods of marked stratification could be related to the presence of smaller phytoplankton species.

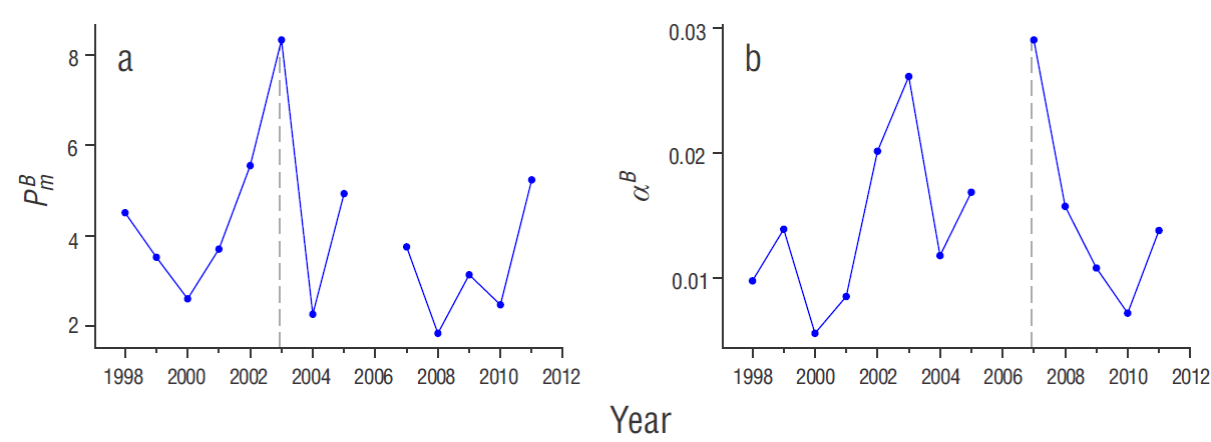
Figure 4 Time series for the average (a) maximum photosynthetic rates ( P m B , mg C [m Chla h]-1) and (b) the maximum light utilization coefficient (α B , mg C [mg Chla]-1 h-1 [ mol quanta m-2 s-1]-1) at the oceanic stations of the IMECOCAL program. Dashed lines indicate the peak P m B and α B values of the time series.. 

The results of this study support the conclusion that the periods of strongest water column stratification were the subarctic water intrusion from 2002 to 2006 and El Niño 2015-2016, which resulted in the greatest decline in phytoplankton biomass (in both periods) and PP (during El Niño 2015-2016) in the northern zone off Baja California. The photosynthetic parameters αB and PmB associated with phytoplankton photophysiology explained the variations in PP in relation to the stratification of the water column. The time series and the analysis presented here for L100IMEC will serve as indicators of the physical processes that occur off the peninsula and their implications for phytoplankton. These indicators could be extrapolated to other IMECOCAL areas to explain the annual and interannual variability of phytoplankton biomass and PP.

Acknowledgments

We wish to express our very special gratitude to Gilberto Gaxiola-Castro† (RIP), who was a collaborator, teacher, and friend of the co-authors of this work. We appreciate all the knowledge provided and his influence on our formation as scientists. We will always remember him as a great person and researcher, and his presence will remain alive in our hearts. This work was funded by the National Council for Science and Technology (CONACYT, Mexico) (projects no. 255602 and 254745). CICESE provided assistance during vessel cruises. EGO is grateful for the scholarship (no. 271663) from CONACYT for postgraduate studies. RD and RSA have been awarded grants by the National System of Researchers (Mexico). We also thank the IMECOCAL program for the efforts made throughout 20 years of systematic monitoring off Baja California, as well as to all the people involved in the oceanographic cruises conducted as part of this program. María Elena Sánchez-Salazar translated the manuscript into English.

referencias

Behrenfeld MJ, Falkowski PG. 1997. A consumer’s guide to phytoplankton primary productivity models. Limnol. Oceanogr. 42(7): 1479-1491. http://dx.doi.org/10.4319/lo.1997.42.7.1479 [ Links ]

Behrenfeld MJ, Boss ES. 2014. Resurrecting the ecological underpinnings of ocean plankton blooms. Ann. Rev. Mar. Sci. 6: 167-194. http://dx.doi.org/10.1146/annurev-marine-052913-021325 [ Links ]

Daly KL, Smith WO. 1993. Physical-biological interactions influencing marine plankton production. Annu. Rev. Ecol. Syst. 24: 555-585. http://dx.doi.org/10.1146/annurev.es.24.110193.003011 [ Links ]

Diehl S, Berger S, Ptacnik R, Wild A. 2002. Phytoplankton, light, and nutrients in a gradient of mixing depths: Field experiments. Ecology 83(2): 399-411. http://dx.doi.org/10.2307/2680023 [ Links ]

Durazo R. 2015. Seasonality of the transitional region of the California Current System off Baja California. J. Geophys. Res. Ocean. 120(2): 1173-1196. http://dx.doi.org/10.1002/2014JC010405 [ Links ]

Durazo R. 2009. Climate and upper ocean variability off Baja California, Mexico: 1997-2008. Prog. Oceanogr. 83(1-4): 361-368. http://dx.doi.org/10.1016/j.pocean.2009.07.043 [ Links ]

Durazo R, Baumgartner TR. 2002. Evolution of oceanographic conditions off Baja California: 1997-1999. Prog. Oceanogr. 54(1-4): 7-31. http://dx.doi.org/10.1016/S0079-6611(02)00041-1 [ Links ]

Durazo R, Castro R, Miranda LE, Delgadillo-Hinojosa F. 2017. Anomalous hydrographic conditions off the northwestern Baja California Peninsula during 2014-2016. Cienc. Mar. 43(2): 81-92. http://dx.doi.org/10.7773/cm.v43i2.2754 [ Links ]

Eppley RW. 1972. Temperature and phytoplankton growth in the sea. Fish. Bull. 70: 1063-1085. [ Links ]

Espinosa-Carreón TL, Gaxiola-Castro G, Durazo R, Cruz-Orozco ME De la, Norzagaray-Campos M, Solana-Arellano E. 2015. Influence of anomalous subarctic water intrusion on phytoplankton production off Baja California. Cont. Shelf Res. 92: 108-121. http://dx.doi.org/10.1016/j.csr.2014.10.003 [ Links ]

Espinosa-Carreon TL, Strub PT, Beier E, Ocampo-Torres F, Gaxiola-Castro G. 2004. Seasonal and interannual variability of satellite-derived chlorophyll pigment, surface height, and temperature off Baja California. J. Geophys. Res. 109(C3): 1-20. http://dx.doi.org/10.1029/2003JC002105 [ Links ]

Fiedler PC, Mendelssohn R, Palacios DM, Bograd SJ. 2013. Pycnocline variations in the eastern tropical and North Pacific, 1958-2008. J. Clim. 26(2): 583-599. http://dx.doi.org/10.1175/JCLI-D-11-00728.1 [ Links ]

Gaxiola-Castro G, Lavaniegos BE, Martínez A, Castro R, Espinosa-Carreón L. 2010. Pelagic ecosystem response to climate variability in the Pacific Ocean off Baja California, in: Simard, SW, Austin, ME. (Eds.), Climate Change and Variability. Sciyo pp. 163-182. http://dx.doi.org/10.5772/9807 [ Links ]

Gaxiola-Castro G, Durazo R, Lavaniegos B, De La Cruz-Orozco ME, Millán-Núñez E, Soto-Mardones L, Cepeda-Morales J. 2008. Pelagic ecosystem response to interannual variability off Baja California = Respuesta del ecosistema pelágico a la variabilidad interanual del océano frente a Baja California. Cienc. Mar. 34(2): 263-270. [ Links ]

Gaxiola-Castro G, Cepeda-Morales J, Nájera-Martínez S, Espinosa-Carreón TL, De la Cruz-Orozco ME, Sosa-Avalos R, Aguirre-Hernández E, Cantú-Ontiveros J. 2010. Producción y biomasa del fitoplancton. In: Gaxiola-Castro G, Durazo R. (eds.), Dinámica del ecosistema pelágico frente a Baja California 1997-2007. Secretaría de Medio Ambiente y Recursos Naturales, Mexico, pp. 59-86. [ Links ]

Geider RJ, La Roche J, Greene RM, Olaizola M. 1993. Response of the photosynthetic apparatus of phaeodactylum tricornutum (Bacillariophyceae) to nitrate, phosphate, or iron starvation. J. Phycol. 29(6): 755-766. http://dx.doi.org/10.1111/j.0022-3646.1993.00755.x [ Links ]

Glover HE. 1980. Assimilation numbers in cultures of marine phytoplankton. J. Plankton Res. 2(1): 69-79.http://dx.doi.org/10.1093/plankt/2.1.69 [ Links ]

Gómez-Ocampo E, Gaxiola-Castro G, Durazo R, Beier E. 2017. Effects of the 2013-2016 warm anomalies on the California Current phytoplankton. Deep Sea Res. Part II Top. Stud. Oceanogr. accepted. http://dx.doi.org/10.1016/j.dsr2.2017.01.005 [ Links ]

Gonzalez-Morales AT, Gaxiola-Castro G, Lara-Lara JR 1993. Daily Photosynthetic Parameters and Biomass from Size-Fractionated Phytoplankton off Baja California. Estuar. Coast. Shelf Sci. 36(2): 147-158. http://dx.doi.org/10.1006/ecss.1993.1010 [ Links ]

Handall P. 1970. The photosynthetic apparatus of microalgac and its adaptation to environmental factors. In: Halldal, PL (ed.), Photobiology of Micro-Organisms. Wiley-Interscience, pp. 17-55. [ Links ]

Hastie TJ, Tibshirani R. 1986. Generalized Additive Models: Some applications. J. of the Am. Statistic. Assoc. 82: 371-386. http://dx.doi.org/10.1080/01621459.1987.10478440. [ Links ]

Holm-Hansen O, Lorenzen CJ, Holmes RW, Strickland JDH. 1965. Fluorometric Determination of Chlorophyll. ICES J. Mar. Sci. 30(1): 3-15. http://dx.doi.org/10.1093/icesjms/30.1.3 [ Links ]

Huisman J. 1999. Population Dynamics of Light-Limited Phytoplankton: Microcosm Experiments. Ecology 80(1): 202-210. http://dx.doi.org/10.2307/176990 [ Links ]

Huisman J, Sharples J, Stroom JM, Visser PM, Kardinaal WEA, Verspagen JMH, Sommeijer B. 2004. Changes in turbulent mixing shift competition for light between phytoplankton species. Ecology 85(11): 2960-2970. http://dx.doi.org/10.1890/03-0763 [ Links ]

Jacox MG, Hazen EL, Zaba KD, Rudnick DL, Edwards CA, Moore AM, Bograd SJ. 2016. Impacts of the 2015-2016 El Niño on the California Current System: Early assessment and comparison to past events. Geophys. Res. Lett. 43(13): 7072-7080. http://dx.doi.org/10.1002/2016GL069716 [ Links ]

Jäger CG, Diehl S, Schmidt GM. 2008. Influence of water-column depth and mixing on phytoplankton biomass, community composition, and nutrients. Limnol. Oceanogr. 53(6): 2361-2373. http://dx.doi.org/10.4319/lo.2008.53.6.2361 [ Links ]

Jassby AD, Platt T. 1976. Mathematical formulation of the relationship between photosynthesis and light for phytoplankton. Limnol. Ocean. 21: 540-547. [ Links ]

Jeronimo G, Gomez-Valdes J. 2010. Mixed layer depth variability in the tropical boundary of the California Current, 1997-2007. J. Geophys. Res. Ocean. 115(C5). http://dx.doi.org/10.1029/2009JC005457 [ Links ]

Kara AB, Rochford PA, Hurlburt HE. 2000. An optimal definition for ocean mixed layer depth. J. Geophys. Res. 105(C7): 16803-16821. http://dx.doi.org/10.1029/2000JC900072 [ Links ]

Lavaniegos BE. 2017. Changes in composition of summer hyperiid amphipods from a subtropical region of the California current during 2002-2008. J. Mar. Syst. 165:13-26. http://dx.doi.org/10.1016/j.jmarsys.2016.09.001 [ Links ]

Lavaniegos BE, Jiménez-Pérez LC, Gaxiola-Castro G. 2002. Plankton response to El Niño 1997-1998 and La Niña 1999 in the southern region of the California Current. Prog. Oceanogr. 54(1-4): 33-58. http://dx.doi.org/10.1016/S0079-6611(02)00042-3 [ Links ]

Lavaniegos BE, Molina-González O, Murcia-Riaño M 2015. Zooplankton functional groups from the California current and climate variability during 1997-2013. CICIMAR Oceánides 30(1): 45-62. [ Links ]

Linacre L, Durazo R, Hernández-Ayón JM, Delgadillo-Hinojosa F, Cervantes-Díaz G, Lara-Lara JR, Camacho-Ibar V, Siqueiros- Valencia A, Bazán-Guzmán C. 2010. Temporal variability of the physical and chemical water characteristics at a coastal monitoring observatory: Station ENSENADA. Cont. Shelf Res. 30(16): 1730-1742. http://dx.doi.org/10.1016/j.csr.2010.07.011 [ Links ]

Malone TC. 1980. Algal size. In: Morris ZI (ed.), Physiological Ecology of Phytoplankton. Blackwell, pp. 433-464. [ Links ]

Marcel B, Morel A, Gagnon R. 1994. An incubator designed for extensive and sensitive measurements of phytoplankton photosynthetic parameters. Limnol. Oceanogr. 39(3): 694-702. http://dx.doi.org/10.4319/lo.1994.39.3.0694 [ Links ]

Marra J. 1978. Phytoplankton photosynthetic response to vertical movement in a mixed layer. Mar. Biol. 46(3): 203-208. http://dx.doi.org/10.1007/BF00390681 [ Links ]

Martinez-Fuentes LM, Gaxiola-Castro G, Gómez-Ocampo E, Kahru M. 2016. Effects of interannual events (1997-2012) on the hydrography and phytoplankton biomass of Sebastián Vizcaíno Bay = Efectos de eventos interanuales (1997-2012) sobre la variabilidad hidrográfica y biomasa del fitoplancton en bahía Sebastián Vizcaíno. Cienc. Mar. 42(2): 81-97.http://dx.doi.org/10.7773/cm.v42i2.2626 [ Links ]

Martínez-Gaxiola M, Durazo R, Gaxiola-Castro G. 2010. Influence of the geostrophic transport of phosphates on primary production off Baja California (Mexico) = Aporte del transporte geostrófico de fosfatos a la producción primaria frente a Baja California. Ciencias Mar. 36(2): 135-145. [ Links ]

Platt T, Sathyendranath S, Ulloa O, Harrison WG, Hoepffner N, Goes J. 1992. Nutrient control of phytoplankton photosynthesis in the Western North Atlantic. Nature 356(6366): 229-231. http://dx.doi.org/10.1038/356229a0 [ Links ]

Simpson JH, Bowers D. 1981. Models of stratification and frontal movement in shelf seas. Deep Sea Res. Part A. Oceanogr. Res. Pap. 28(7): 727-738. http://dx.doi.org/10.1016/0198-0149(81)90132-1 [ Links ]

Sosa-Avalos R, Durazo R, Mitchell BG, Cepeda-Morales J, Gaxiola-Castro G. Forthcoming 2017 Sep. Parámetros fotosintéticos frente a Baja California: una herramienta para estimar la producción primaria con datos de sensores remotos. Cienc. Mar. [ Links ]

Strickland JDH. 1965. Phytoplankton and marine primary production. Annu. Rev. Microbiol. 19: 127-162. http://dx.doi.org/10.1146/annurev.mi.19.100165.001015 [ Links ]

Taguchi S. 1981. Seasonal studies of the dinoflagellate Ceratium longipes (Bailey) Gran in the Bedford Basin, Canada. J. Exp. Mar. Bio. Ecol. 55(2-3): 115-131. http://dx.doi.org/10.1016/0022-0981(81)90106-4 [ Links ]

Trenberth KE, Large WG, Olson JG. 1990. The mean annual cycle in global ocean wind stress. J. Phys. Oceanogr. 20(11): 1742-1760. http://dx.doi.org/10.1175/1520- 0485(1990)020<1742:TMACIG>2.0.CO;2 [ Links ]

Wood AS, Wood MS, Wood S. 2015. Package “ mgcv ” [cited 28 june 2017]. Available from: https://cran.r-project.org/web/packages/mgcv/mgcv.pdf . [ Links ]

Wood SN. 2006. Generalized Additive Models: an introduction with R. Chapman & Hall/CRC, Boca Raton, FL. [ Links ]

Yentsch CS, Menzel DW. 1963. A method for the determination of phytoplankton chlorophyll and phaeophytin by fluorescence. Deep Sea Res. Oceanogr. Abstr. 10(3): 221-231. http://dx.doi.org/10.1016/0011-7471(63)90358-9 [ Links ]

Received: March 01, 2017; Accepted: May 01, 2017

* Correspsonding author. E-mail: eliana.gomez@gmail.com.

Creative Commons License This is an open-access article distributed under the terms of the Creative Commons Attribution License