




Services on Demand
Journal
Article
 text in
 English (pdf)
 Article in xml format
 Article references

 Automatic translation
 Send this article by e-mail
Indicators
-
 Cited by SciELO
-
 Access statistics
Related links
-
 Similars in
SciELO
Share

 Permalink

Revista mexicana de fitopatología
On-line version ISSN 2007-8080Print version ISSN 0185-3309
Rev. mex. fitopatol vol.42 n.1 Texcoco Jan. 2024 Epub Jan 27, 2025
https://doi.org/10.18781/r.mex.fit.2209-4
Phytopathological Notes
Diagrammatic scale to quantify the severity of Ascochyta blight in broad bean crops
1 Universidad Autónoma del Estado de México, Facultad de Ciencias Agrícolas. Ctra. Toluca-Ixtlahuaca Km. 15.5, El Cerrillo, El Cerrillo Piedras Blancas, Toluca, Estado de México, C.P. 50200, México,
2 Centro Universitario UAEM Tenancingo. Carretera Tenancingo Villa Guerrero Km. 1.5 Tenancingo, Estado de México, C.P. 52400, México.
Objective/background:
The objective of this study was to design and validate a diagrammatic severity scale of brown spot on broad bean.
Materials and methods:
We collected 120 leaflets with different level of brown spot damage from commercial crops in the Toluca Valley, which were visually selected based on the expressed symptomology. Sixty leaflets were scanned for evaluation with the software APS PRESS ©Assess 2.0 to determine the real severity value for each leaflet.
Results:
The damage values allowed us to generate a diagrammatic scale consisting of six different classes: 0(0.0), 1(0.1-6.0), 2(6.1-10.0), 3(10.1-15.0), 4(15.1-40.0), 5(> 40.1-100). The leaflets were visually examined by evaluators who had no prior experience. The results from each evaluator were analyzed with a simple linear regression, obtaining r2 values from 0.0042 to 0.8748, β0 de 0.51 a 9.11, y β1 de 0.132 a 0.925. Using a scale, r2 values were obtained 0.9143 to 0.985, β0 de 0.001 a 0.911 y β1<0.001.
Conclusion:
The generated diagrammatic severity scale was validated and reproducible, showing high reliability.
Key words: Symptoms; damage; evaluation; reproducibility
Objetivo/antecedentes:
El objetivo de esta investigación fue diseñar y validar una escala diagramática de severidad de la mancha café en haba.
Materiales y Métodos:
En tres plantaciones comerciales, se recolectaron 120 foliolos con diferente nivel de daño de mancha café, realizando una selección visual a partir de la sintomatología. Se digitalizaron 60 foliolos para evaluarse con el software APS PRESS ©Assess 2.0 y determinar el valor de la severidad real de cada foliolo.
Resultados:
Los valores de severidad permitieron generar una escala diagramática conformada por seis clases diferentes 0(0.0), 1(0.1-6.0), 2(6.1-10.0), 3(10.1-15.0), 4(15.1-40.0), 5(> 40.1-100). 20 evaluadores sin experiencia realizaron la primera evaluación visual (sin escala diagramática) de los foliolos con diferentes grados de daño. Posteriormente, se realizó una segunda evaluación, con 10 evaluadores, con apoyo de la escala. Los resultados obtenidos de cada evaluador se analizaron mediante una regresión lineal simple obteniendo valores de r2= 0.0042 a 0.8748, β0 de 0.51 a 9.11, y β1 de 0.132 a 0.925, sin uso de escala. Con uso de escala se obtuvieron valores de r2= 0.9143 a 0.9851, β0 de 0.001 a 0.911 y β1<0.001.
Conclusión:
La escala diagramática de severidad generada fue validada y reproducible, mostrando una alta confiabilidad.
Palabras clave: Síntomas; daño; evaluación; reproducibilidad
Introduction
In 2022, Mexico’s Agrifood and Fishing Information Service (Servicio de Información Agroalimentaria y Pesquera - SIAP) reported a cultivated area of 9,445 ha of broad beans (Vicia faba), out of which 9,436 ha were harvested for fresh grain, whereas 17,246 ha were planted and 17,231 ha were harvested for dry grain. The State of Mexico reported 4,397 ha planted with broad bean for green harvest, ranking first in production nationwide (SIAP, 2023). The broad bean is considered a species with nutritional, biological, and even medicinal properties (Prabhu and Rajeswari, 2018). Despite its importance, the crop is affected by diseases caused by Ascochyta fabae, Botrytis fabae, Puccinia vicia-fabae and Rhizoctonia spp., which have caused countless economic losses for farmers.
In Egypt, diseases such as the chocolate spot (Botrytis fabae) and the brown spot (Ascochyta fabae) have been reported to affect between 25 and 80% of the foliar area (Omar, 2021). López (2013) pointed out the brown spot as one of the main diseases that affect the broad bean crop in the Toluca Valley, containing lesions in concentric circles in leaves, stems and pods, as well as being transmitted via seeds and affecting quality and yield by 10 to 34% (Ahmed et al., 2016). An alternative to know the pathogens found in the important crops is to conduct epidemiological studies, such as estimating the area under the disease progress curve. These studies assess the damage caused by the causal agent over time and space, determining incidence, severity and their relationship with climate factors, management and the subsystems involved, to establish solutions for phytosanitary problems (Olivares et al., 2021).
For example, Meirelles and Cardoso (2012) point out that the estimation of severity is influenced by the subjectivity of the evaluator when quantifying the damage. Nowadays, the use of diagrammatic scales has become a useful tool to evaluate several diseases, for being user-friendly and because they have important intervals to represent the development of a disease, as well as helping to provide an immediate evaluation (Acco et al., 2020) and making quick decisions for the implementation of management strategies. Due to this, the aim of this study was to design and validate a diagrammatic scale to determine the severity of the brown spot (Ascochyta fabae) in the broad bean crop.
In three commercial plots of native broad beans, prior to flowering, located in the municipal areas of Calimaya (2117276.10 UTM N; 428894.07 UTM E), Toluca (2125772.03 UTM N; 428452.94 UTM E) and Zinacantepec (2124996.43 UTM N; 419277.08 UTM E) in the Toluca Valley, during the spring-summer 2021 agricultural cycle (temperate rainy climate (Cwbg) and an average temperature of 12.5 °C and predominant rains in the summer), 60 leaflets were collected from the lower stratum, along with 60 from the middle stratum of plants in the vegetative phase. Plants displaying characteristic symptoms associated with brown spot and different levels of damage were selected, as well as asymptomatic leaflets. The leaflets were preserved in a botanical press to keep them free from mechanical damage and preserve their characteristics until they were taken to the Plant Health laboratory of the Faculty of Agricultural Sciences of the Autonomous University of the State of Mexico. The leaflets collected were visually pre-selected, discarding those with mechanical damage, and 69 representative leaflets were chosen.
Twelve leaflets were chosen for each type, plus 9 healthy leaflets. They were grouped into similar categories or ranges and digitized fresh, aided by a multifunctional HP® LASERJET PRO, MFP M127fn printer.
In every leaflet, the damaged area was evaluated in relation to the total area and expressed as a percentage using the APS PRESS software ©Assess 2.0 2008. The area with symptoms and the asymptomatic area were determined using RGB (Red, Green, Blue) according to the methodology proposed by Massom et al. (2013). The actual severity of the disease (S) was estimated based on the formula proposed by Nutter et al. (2006): Severity = [(diseased area / total area of the digitized leaf) * 100]. The intermediate levels of the severity of the brown spot were determined according to Weber-Fechner’s visual acuity law, which establishes a quantitative relationship between the magnitude of a physical stimulus and the way in which it is perceived by the subject (Horsfall and Barrat, 1945; Rivera-Zabala, 2016). This helps establish six types of severity, as well as their maximum and minimum limits in each type. For the scale, the leaf with the value closest to the average severity of each type was chosen. To validate the diagrammatic scale of severity, 69 digital images were evaluated, representative of the different degrees of damage, and inserted at random in individual slides for viewing in Microsoft 365 ® Power Point ® (2022) and projected using an EPSON PowerLite S18+ multimedia projector model V11H552021 for 20 inexperienced evaluators and without the support of a diagrammatic scale, with a viewing time of 30 seconds for each image.
In a second evaluation, conducted eight days after the first evaluation, 10 of the 20 evaluators with better eyesight used the diagrammatic scale proposed to assess 60 leaflets. In both evaluations, in order to quantify the accuracy of the severity assessments carried out by the evaluators, a simple linear regression was carried out, with the coefficient of determination parameter (r2), as well as the margin of error (1-r2). A T test was conducted on the intercept of the linear regression (β ) to verify the following hypothesis H0: b0 = 0 and with the coefficient of the slope of the line (β1) to check if it was different to 1: H1: b1 = 1, with a P £ 0.01. The evaluation of both sets of hypotheses was carried out with a significance level of 0.01. In addition, the accuracy of the estimations obtained by calculating the coefficient of determination, accuracy and absolute errors was determined with a simple linear regression analysis using SAS® software version 9.0 (SAS Institute, 2002). Real severity was the independent variable, and the estimated severity was the independent variable. The estimates were evaluated based on precision (r2) and the absolute errors (estimated severity minus real severity) (Nutter Jr. et al., 1995). The APS PRESS© Assess 2.0 software (2008) determined percentages of damaged area, which fluctuated from 0 to 77.1 %. In the first evaluation, five of the evaluators presented a high level of accuracy when identifying the corresponding type of severity of the disease, whereas the remaining evaluators presented deficiencies in their accuracy (Table 1). In this sense, Barbosa et al. (2006) mention that the observed values for the accuracy of evaluators with no experience are not acceptable and emphasize that training may have a favorable influence on the
quality of the evaluations.
Table 1 Values of the Intercept (β0), slope of the line (β1), coefficient of determination (r²) and margin of error (1-r²) of the simple linear regression equation in visual estimations of the severity in of brown spot in broad bean (Ascochyta fabae), with 20 unscaled evaluators and 10 scaled evaluators.
| Unscaled | With scaled | |||||||||||||
|---|---|---|---|---|---|---|---|---|---|---|---|---|---|---|
| ID | β0 | β1 | r2 | 1-r2 | ID | β0 | β1 | r2 | 1-r2 | ID | β0 | β1 | r2 | 1-r2 |
| 1 | 8.224 | 0.227 | 0.191 | 0.808 | 11 | 9.370 | 0.094 | 0.112 | 0.887 | 1 | 0.055* | <0.0001** | 0.9851 | 0.0149 |
| 2 | 5.707 | 0.302 | 0.325 | 0.674 | 12 | 10.425 | 0.066 | 0.051 | 0.948 | 2 | 0.307* | <0.0001** | 0.9845 | 0.0155 |
| 3 | 7.170 | 0.195 | 0.171 | 0.828 | 13 | 9.995 | 0.116 | 0.408 | 0.591 | 3 | 0.452* | <0.0001** | 0.9847 | 0.0153 |
| 4 | 6.347 | 0.305 | 0.350 | 0.650 | 14 | 6.009 | 0.188 | 0.335 | 0.664 | 4 | 0.911* | <0.0001** | 0.9843 | 0.0157 |
| 5 | 0.510* | 0.921* | 0.811 | 0.188 | 15 | 10.008 | 0.065 | 0.050 | 0.949 | 5 | 0.887* | <0.0001** | 0.9843 | 0.0157 |
| 6 | 0.941* | 0.925* | 0.875 | 0.125 | 16 | 11.717 | 0.044 | 0.007 | 0.993 | 6 | 0.001* | <0.0001** | 0.9143 | 0.0857 |
| 7 | 0.941* | 0.925* | 0.875 | 0.125 | 17 | 11.613 | 0.031 | 0.010 | 0.989 | 7 | 0.106* | <0.0001** | 0.9543 | 0.0457 |
| 8 | 0.941* | 0.925* | 0.875 | 0.125 | 18 | 9.831 | 0.069 | 0.055 | 0.944 | 8 | 0.524* | <0.0001** | 0.9684 | 0.0316 |
| 9 | 0.941* | 0.925* | 0.875 | 0.125 | 19 | 10.842 | 0.111 | 0.029 | 0.971 | 9 | 0.013* | <0.0001** | 0.9464 | 0.0536 |
| 10 | 9.116ns | 0.132 | 0.119 | 0.880 | 20 | 11.872 | 0.030 | 0.004 | 0.995 | 10 | 0.279* | <0.0001** | 0.9407 | 0.0593 |
| Average | 0.3263 | 0.672 | Average | 0.9647 | 0.0353 | |||||||||
*significant: situation where the null hypothesis (β0=0 o β1=1) was rejected by test t (P ≤ 0.01).
The results of the second evaluation helped established minimum and maximum limits in each one of the six types of severity expressed in percentages: C0: (0; 0= Without visible symptoms), C1: (0.1-6.0; 3.0 mid-value= Small circular lesions), C2: (6.1-10.0; 8.0= Small lesions increase, with brown edges), C3: (10.1-15.0; 12.5= lesions begin to coalesce, they become a gray and/or chocolate brown color with a light colored center), C4: (15.1-40.0; 27.5= The majority of lesions begin to coalesce, and begin to turn from dark to necrotic), C5: (>40.1-100; 70.0= The lesions coalesce and develop a dark brownness with a complete sinking of the center); these levels were used to determine the limits of the scale. The minimum severity value was 0% (healthy leaflet) and a maximum severity value of 40.1 % (damaged leaf). The latter displays characteristics of coalescence of the lesions and becomes black, with a complete sinking of the center (Figure 1). The scale created coincides with what was indicated by Campbell and Madden (1990), who defined the scale of severity as a series of types that must contain the ranges of severity for a determined disease, providing an adequate resolution to the behavior of severity.
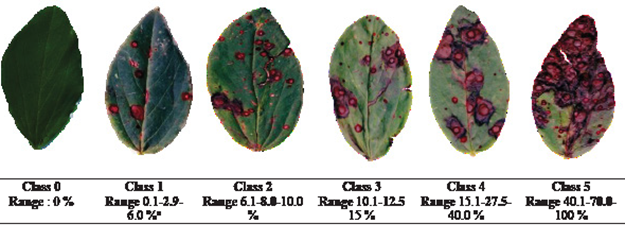
Figure 1 Diagrammatic scale of brown spot severity (Ascochyta fabae) in broad bean. zLower limit-average-upper limit.
The coefficient of determination values (r2) for the 20 inexperienced evaluators ranged from 0.0042 to 0.8748 with an average of 0.3267, whereas the margin of error (1-r2) ranged from 0.125 to 0.995 and an average of 0.673 (Table 1). In the validation with the aid of the scale, the coefficient of determination values (r2) ranged from 0.9143 to 0.9851 and an average of 0.9647 (Table 1), above the results obtained in the first evaluation (Table 1), therefore prior training influenced the quality of the evaluations. These results coincide with a report by Ortega-Acosta et al. (2016), who obtained averages greater than 0.80% for evaluations conducted with the use of diagrammatic scales. Therefore, this scale is reproducible and accurate, in line with findings by Belan et al. (2014), in which absolute errors obtained in the evaluation with the scale ranged from 0.0 to 54.96% (Figure 2), higher than the ranges of 0.0 to 37.41% from the first evaluation in the absence of the scale. The margin of error (1-r2) in the second stage tanged from 0.0149 to 0.857, with an average of 0.053, indicating that it is significant and acceptable
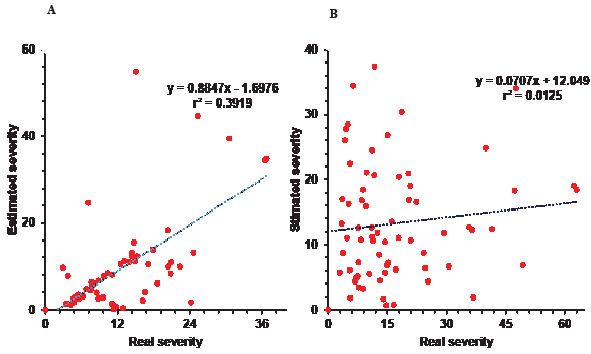
Figure 2 Distribution of residuals (estimated severity-real severity) of the brown spot evaluations (Ascochyta fabae) in broad vean leaflets. A) Scaled evaluation. B) Unscaled evaluation.
(Hernández and Sandoval, 2015). Furthermore, a better precision (β0) and accuracy (β1) were determined with the aid of the proposed diagrammatic scale.
The precision determined for each evaluator indicates that a diagrammatic scale represents a standardized method to quantify a disease, thus aiding in obtaining favorable results (Hernández and Sandoval, 2015), along with adequate levels of accuracy and precision among evaluators (Figure 1). These results align with Barbosa et al. (2006) indicating that damage assessment with the aid of a scale significantly improves both precision (β0) and accuracy (β1). In the same vein, Fragoso-Benhumea et al. (2022) and Ávila-Quezada et al. (2001) reported that a diagrammatic scale may guarantee reproducibility but not the accuracy and precision of the estimation.
In this study, the majority of the evaluators displayed significance regarding the value of the intercept value β0 and the slope coefficient β1; they were statistically different and/or close to 1, with a confidence interval of a = 0.01 (99 %), coinciding with a report by Nascimento et al. (2005), who emphasized that an overestimation of the results in most evaluators may indicate the presence of positive deviations for all severity levels, concluding that the results presented were all statistically different from 0 and 1 based on the T tests (Pr > |t|) with a confidence interval of a = 0.01.
The diagrammatic scale to evaluate the severity of the brown spot in broad beans, created and composed of six class, provided a high reproducibility with levels of accuracy (β1<0.001) and acceptable precision (β0 from 0.001 to 0.911), making it a tool to standardize the evaluation of damages across different locations, evaluating initial symptoms to make decisions and assessing the efficiency of management measures or the sensitivity response of broad bean cultivars.
Acknowledgments
The first author would like to thank the Consejo Nacional de Humanidades, Ciencias y Tecnologías (CONAHCYT) for the grant awarded. To the producers Manuel Mendoza Malavez, Bernabé Guadarrama Mejía, Demetrio Misael Monroy Peñaloza and Demetrio Misael Monroy Peñaloza and the Hernández family for the facilities to obtain the plant material used in the research, and to the Faculty of Agricultural Sciences of the Faculty of Agricultural Sciences of the Autonomous University of the State of Mexico for providing me with academic support for providing me with the academic support and facilities to carry out this research. to carry out this research.
REFERENCES
Acco, L. F., Gomes, D. G., Matos, J. N., Ribeiro, N. R. y Balbi-Peña, M. I. (2020). Elaboração e validação de escala diagramática para avaliação da pústula bacteriana em soja. Summa Phytopathologica, 46(2), 145-149. https://doi.org/10.1590/0100-5405/211476 [ Links ]
Ahmed, S., Abang, M. M. y Maalouf, F. (2016). Integrated management of Ascochyta blight (Didymella fabae) on faba bean under Mediterranean conditions. Crop Protection, 81, 65-69. https://doi.org/10.1016/j.cropro.2015.12.013 [ Links ]
ASSESS 2.0 (2008). Windows. Canada: The American Phytopathology Society. https://doi.org/10.1094/assesshelp [ Links ]
Ávila-Quezada, G., Mora-Aguilera, G. y Teliz-Ortiz, D. (2001). Sistemas de medición de roña y antracnosis en frutos de aguacate Persea americana. Memorias XXXVI Congreso Nacional de FitopatologíaXXVII Congreso Nacional de la Sociedad Mexicana de Fitopatología. Querétaro. 105. https://biblioteca.ecosur.mx/cgi-bin/koha/opac-detail.pl?biblionumber=000023610 [ Links ]
Barbosa, G. M. A., Michereff, S. J. y Mora-Aguilera, G. (2006). Elaboração e validação de escala diagramática para avaliação da severidade da ferrugem branca do crisântemo. Summa Phytopathologica, 32(1), 57-62. https://doi.org/10.1590/S0100-54052006000100008 [ Links ]
Belan, L. L., Pozza, E. A., Freitas, M. L., De Souza, R. M., De Jesús, J. W. C. y Oliveira, J. M. (2014). Diagrammatic scale for assessment of bacterial blight in coffee leaves. Journal of Phytopathology, 162, 801-810. https://doi.org/10.1111/jph.12272 [ Links ]
Campbell, C. L. y Madden, L. V. (1990). Introduction to Plant Disease Epidemiology. New York, USA: Wiley-Interscience. 532p. [ Links ]
Fragoso-Benhumea, J. M., Sánchez-Pale, J. R., Castañeda-Vildózola, A., Franco-Mora, O., Gutiérrez-Ibáñez, A. T., Contreras-Rendón, A. y García-Velasco, R. (2022). Diagrammatic scale for rust severity assessment in broad bean (Vicia faba). Mexican Journal of Phytopathology, 40(3). https://doi.org/10.18781/R.MEX.FIT.2206-2 [ Links ]
Hernández, R. L. y Sandoval, I. J. S. (2015). Escala diagramática de severidad para el complejo mancha de asfalto del maíz. Revista Mexicana de Fitopatología, 33(1), 95-103. https://rmf.smf.org.mx/Vol3312015/NotasFitop/1407_1_2015.pdf [ Links ]
Horsfall, J. G. y Barrat, R. W. (1945). An improved grading system for measuring plant diseases. Phytopathology, 35, 655. https://plantbreeding-genomics.extension.org/horsfall-barratt-scale-quantitative-evaluation-of-disease/ [ Links ]
López (2013). Tecnología de producción del cultivo de haba para el Estado de México. Toluca, Estado de México, Méx.: ICAMEX. 76p. [ Links ]
Massom, M. V., Passador, M. M., Porcena, S. A., De Pieri, C., Finkenauer, E. y Luiz, F. E. (2013). Scala diagramática para quantificação da severidade de manchas em folhas de Eucalyptus globulus Labill. causadas por Teratosphaeria nubilosa. Ciência Florestal, 23(2), 521-528. https://doi.org/10.5902/198050989296 [ Links ]
Meirelles, S. A. y Cardoso, N. C. (2012). Metodologia para elaboração de escalas diagramáticas para avaliação de doenças em plantas. Comunicado Técnico, 120, 1-6. https://ainfo.cnptia.embrapa.br/digital/bitstream/item/65040/1/ComunicadoTecnico-120.pdf [ Links ]
Nascimento, A. R. P., Michereff, S. J. y Gomes, M. A. (2005). Elaboração e validação de escala diagramática para cancro bacteriano da videira. Summa Phytopathologica, 31(1), 59-64. http://sitav.pga.uem.br/download/escala-diagramatica-cancro-bacteriano-videira_ana-r-p-nascimento_2005.pdf [ Links ]
Nutter, F. W., Esker, P. D. y Netto, R. A. C. (2006). Disease assessment concepts and the advancements made in improving the accuracy and precision of plant disease data. En: Smith, J. (ed.). European Journal of Plant Pathology, 95-103. https://doi.org/10.1007/1-4020-5020-8_7 [ Links ]
Nutter, F. W. y Schultz, P. M. (1995). Improving the accuracy and precision of disease assessments: selection of methods and use of computer-aided training programs. Canadian Journal of Plant Pathology, 17, 174-184. https://doi.org/10.1080/07060669509500709 [ Links ]
Olivares, B. O., Rey, J. C., Lobo, D., Navas-Cortés, J. A., Gómez, J. A. y Landa, B. B. (2021). Fusarium Wilt of Bananas: A Review of Agro-Environmental Factors in the Venezuelan Production System Affecting Its Development. Agronomy, 11(5), 986. https://doi.org/10.3390/agronomy11050986 [ Links ]
Omar, S. A. M. (2021). The Importance of Faba Bean (Vicia faba L.) Diseases in Egypt. En: Awaad, H., Abu-hashim, M. y Negm, A. (eds.). Mitigating Environmental Stresses for Agricultural Sustainability in Egypt. Springer Water. Springer, Cham. https://doi.org/10.1007/978-3-030-64323-2_13 [ Links ]
Ortega-Acosta, S. A., Velasco-Cruz, C., Hernández-Morales, J., Ochoa-Martínez, D. L. y Hernández-Ruiz, J. (2016). Escalas logarítmicas diagramáticas para evaluar la severidad del manchado de hojas y cálices de Jamaica. Revista Mexicana de Fitopatología, 34(3), 270-285. https://doi.org/10.18781/r.mex.fit.1606-6 [ Links ]
Prabhu, S. y Rajeswari, D. (2018). Nutritional and Biological properties of Vicia faba L.: A perspective review. International Food Research Journal, 25(4), 1332-1340. http://www.ifrj.upm.edu.my/25%20(04)%202018/(2).pdf [ Links ]
Rivera-Zabala, N. (2016). Variabilidad genética de Xanthomonas fragariae y evaluación de su severidad en genotipos de fresa. Tesis de Maestría. Colegio de Postgraduados, Texcoco, Estado de México. http://colposdigital.colpos.mx:8080/jspui/bitstream/10521/3453/1/Rivera_Zabala_N_MC_Fitopatologia_2016.pdf [ Links ]
SAS Institute (2002). The SAS system for windows. Release 9.0. SAS Institute. North Carolina, USA. https://doi.org/10.1201/9781003051299-SIAP [ Links ]
SIAP (Servicio de Información Agroalimentaria y Pesquera) (2023). Anuario Estadístico de la Producción Agrícola. https://nube.siap.gob.mx/cierreagricola/. (Consulta, Septiembre 2023). [ Links ]
Received: September 15, 2022; Accepted: December 10, 2023
 Este es un artículo publicado en acceso abierto bajo una licencia
Creative Commons
