


 nueva página del texto (beta)
 Inglés (pdf)
 Artículo en XML
 Referencias del artículo
 Enviar artículo por email
 Citado por SciELO
  Similares en
SciELO
Similares en
SciELO 
 Permalink
1. INTRODUCTION
Very high precision space-born photometry provided by space telescopes such as CoRoT (Baglin et al. 2006), Kepler (Koch et al. 2010; Borucki et al. 2010) and TESS (Ricker et al. 2015) not only allows us to discover exoplanets via transit light curves but also enables us to detect further light variations with submillimag amplitude. Detecting very low amplitude light variations in stars expands our understanding of stellar variability and evolution, and suggests new questions. In the case of pulsating stars, very precise photometry enables us to detect numerous pulsation frequencies possessing different modes, which is very useful for extracting information on the inner rotation profile of the star (see, e.g., Van Reeth et al. 2016), and provides constraints on basic stellar parameters, such as mass, radius and effective temperature (see, e.g., Van Reeth et al. 2015; Guo & Li 2019). In addition, relations between pulsational and orbital properties of binary stars with a pulsating component are also interesting to study pulsational characteristics in binary systems. Such relations were found for binary Delta Scuti (δ Sct) variables (Soydugan et al. 2006). Later, Zhang et al. (2013) confirmed the relation between pulsational and orbital period via extending the stellar sample. They also provided a theoretical derivation of the relation and concluded that the relation was a function of the pulsation constant Q.
Regarding Gamma Doradus (γ Dor) variables, which are low amplitude pulsators ( < ∼0m . 1) with pulsation periods between 0.4 and 3 days (Kaye et al. 321 1999), ground-based observations are insufficient to study their pulsational properties since these observations have gaps due to day-night cycles and suffer from low precision compared to space-based observations. Furthermore, a very high resolution frequency amplitude spectrum is needed to extract precise information on the inner rotation and structure of the star, which could be achieved by analysing continuous photometric data covering a time base of at least one year. These requirements make the Kepler space telescope an excellent instrument to study the pulsational properties of the γ Dor variables, with its very high precision and continuous data spanning over 4 years. Using Kepler data, more than 100 eclipsing binaries with a γ Dor component were discovered so far (Gaulme & Guzik 2019). Ibanoglu et al. (2018) compiled a comprehensive catalogue of γ Dor variables and showed that the pulsation periods of binary γ Dor variables are proportional to their orbital periods and pulsation constants (Q), but inversely proportional to the fractional radii of the pulsating components. They also noted that the linear correlation is not high due to the limited sample and the scattered pattern of the data. The theoretical basis of the observed relations had already been established for p-modes previously (Çakirli & Ibanoglu 2016). However, there seems to be a weaker relation for the near-center g-modes (Hoyman et al. 2020) compared to the relations found for binary δ Sct variables (Soydugan et al. 2006), which pulsate with non-radial p-modes.
In this study, we present photometric light curve modelling of four Kepler eclipsing binaries KIC2720354, KIC10063044, KIC11724091, and KIC8565912. In addition, we carry out a frequency analysis of the residuals from the best-fitting light curve model and re-evaluate the pulsation period relations with the four new eclipsing binaries presented in this study. We briefly summarize the Kepler data in the next section. We give all details on light curve modelling in Section 3 and estimate the absolute parameters of the systems in Section 4. An analysis of the residuals from the best-fitting light curve model is given in Section 5. We present revised pulsation period relations in Section 6 and summarize our findings in the last section.
2. DATA
We use very high precision photometric data with 29.4 minutes of exposure time (long cadence), provided by the Kepler space telescope. The CCD camera of the telescope is capable of collecting photons between 4100 Å and 9100 Å, which greatly increases the precision. Prša et al. (2011) and Slawson et al. (2011) investigated the Kepler data and compiled the Kepler eclipsing binary catalogue1. This catalogue contains de-trended and normalized fluxes for each eclipsing binary. De-trending and normalization procedures are described in Slawson et al. (2011). We adopt detrended and normalized fluxes of the target stars from this catalogue. All-stars have four years of continuous photometry without any missing quarter, except KIC8565912, which was observed only in quarter 16 and 17. In total, 65072, 62697, 63112 and 4635 data points were obtained for KIC2720354, KIC10063044, KIC11724091 and KIC8565912, respectively. The Mikulski Archive for Space Telescopes (MAST) database reports fairly weak (2-3%) contamination from the possible background light sources. No short cadence data (58.9 second exposure time) are available for any of the targets.
3. LIGHT CURVE MODELLING
Light curve modelling is based on pure Kepler photometry. First, we aim to find geometric, radiative and physical parameters via averaged light curves over the whole long cadence Kepler photometry. For each target, we prepare a representative phasebinned light curve with a phase step of 0.002. The phase-binned light curve makes the modelling process much less time consuming, since only 500 data points are used in the modelling, instead of thousands of them. After we find the best-fitting light curve model for each target, we obtain residuals from the model and investigate the light variation in the residuals.
We use the PyWD2015 software (Güzel & Özdarcan 2020) for light curve modelling, which has a very useful GUI and covers almost all features of the 2015 version of the Wilson-Devinney (WD) eclipsing binary modelling code (Wilson & Devinney 1971; Wilson & Van Hamme 2014). The modelling basically relies on accurate determination of two critical parameters, i.e., the effective temperature of the primary component (T 1) and the mass ratio of the system (q = M 2 /M 1). For a given eclipsing binary, modelling the optical spectrum of the binary and spectroscopic orbit is the most reliable way to obtain the effective temperatures of the components and the mass ratio of the binary.
LAMOST spectroscopic observations of KIC2720354, KIC10063044 and KIC11724091 had already been done, and effective temperatures are provided by Qian et al. (2018). Since there is no LAMOST spectrum for KIC8565912, we adopt the effective temperature given in Berger et al. (2018) for this target. Thus, adopted effective temperatures for the primary components of KIC2720354, KIC10063044, KIC11724091 and KIC8565912 are 6600 K, 7100 K, 6800 K, and 7000 K, respectively. We estimate that average uncertainty of the effective temperatures is around ≈200 K.
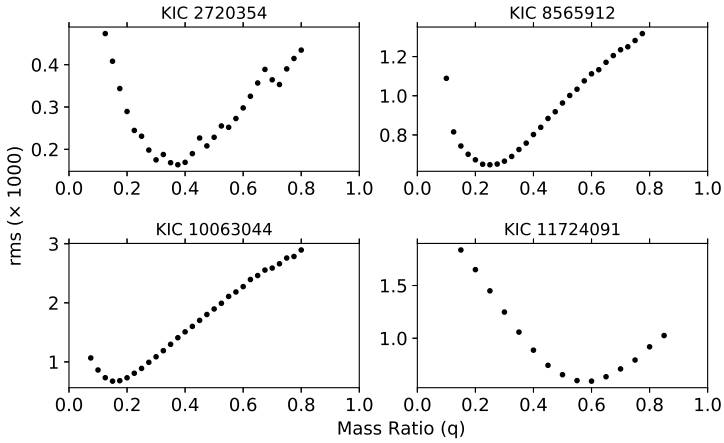
Unfortunately, no published spectroscopic orbit solution is available for our targets. In this case, we only rely on pure photometric modelling. In order to determine the other critical parameter, i.e. the mass ratio, we apply a mass ratio search procedure. In this procedure, we choose different trial mass ratio values and find the best-fitting model. Then we adopt the mass ratio with the smallest rms residuals as the final mass ratio value. We choose trial mass ratios between 0 and 1 with steps of 0.025, where the step size is also adopted as the uncertainty of the mass ratio. In light-curve-only methods, estimating the uncertainty of the mass ratio can be done by setting it as adjustable parameter together with the other adjustable parameters. In this case, formal errors are reported by a differential correction routine, which is mostly optimistic and considerably underestimates the errors due to the correlation between adjustable parameters. More reliable estimates can be done by combining radial velocity measurements of both components and a light curve data with proper weighting. Since we do not have radial velocity measurements, we make an implicit assumption on the uncertainty of the mass ratio.
We apply this procedure by assuming detached and semi-detached configurations (MODE 2 and 5 in the WD code, respectively) for each target separately. Light curve modelling results indicate that KIC10063044 is a semi-detached system, while the remaining targets are detached systems. We show the results of the mass ratio search in Figure 1.
During the whole light curve modelling process, we assume that all target stars possess convective outer envelopes; thus, we fix the values of the radiative parameters (gravity darkening g, albedo A) to their typical values. Here, we note that the estimated effective temperatures of the primary components are in range between 6600 K and 7200 K. This temperature range corresponds to the boundary region between convective and radiative outer envelopes, so it is not easy to distinguish whether the primary components possess convective or radiative envelopes. For each system, trial light curve solutions assuming a convective outer envelope result in rms residuals very similar to the solutions with radiative outer envelopes. Thus we implicitly assume that the primary components of the target systems possess convective outer envelopes. We use the limb darkening coefficients of van Hamme (1993) by adopting a logarithmic law (Klinglesmith & Sobieski 1970). Inspecting the phase-folded light curve of each target, we find that all primary and secondary eclipses are located precisely at 0.0 and 0.5 orbital phases, respectively, which indicates circular orbits. Thus we assume synchronized rotation for the components and fix the rotation parameter of each component (F) to unity. For detached systems, we adopt the phase shift, the orbital inclination (i), the effective temperature of the secondary component (T 2), the dimensionless potentials of the components (Ω1 and Ω2) and the luminosity of the primary (L 1) as adjustable parameters. In the case of the semi-detached system KIC10063044, the secondary component completely fills its Roche lobe. Hence we fix Ω2 to the inner critical potential value as a result of the constraint defined in MODE 5 of the Wilson-Devinney code. Due to lobe filling, the secondary component has a distorted shape. Therefore, we further adopt gravity darkening and albedo values of the secondary component as additional adjustable parameters. Moreover, we adopt the linear limb darkening law for that component and set its limb darkening coefficient as an adjustable parameter. Trial light curve models indicate that the secondary component of KIC10063044 is ≈2700 K cooler than the primary. Considering the distorted shape of the secondary and the large temperature difference, we adopt detailed reflection (MREF = 2, NREF = 2). Furthermore, phase-folded residuals from trial light curve models of KIC10063044 exhibit a stable wave pattern. A semi-detached configuration suggests the possibility of ongoing mass transfer from the secondary to the primary component, which may lead to a hot spot on the surface of the primary component. Therefore, we assume a hot spot with a temperature factor (TF) of 1.02 on the surface of the primary component of KIC10063044 and adjust its co-latitude (θ), longitude (φφ) and angular radius (rspot ). We show phase-folded light curves and the best-fitting models in Figure 2 and tabulate light curve analysis results in Table 1. Our analyses reveal that the detached binaries KIC2720354 and KIC11724091 exhibit total eclipses at secondary minima.
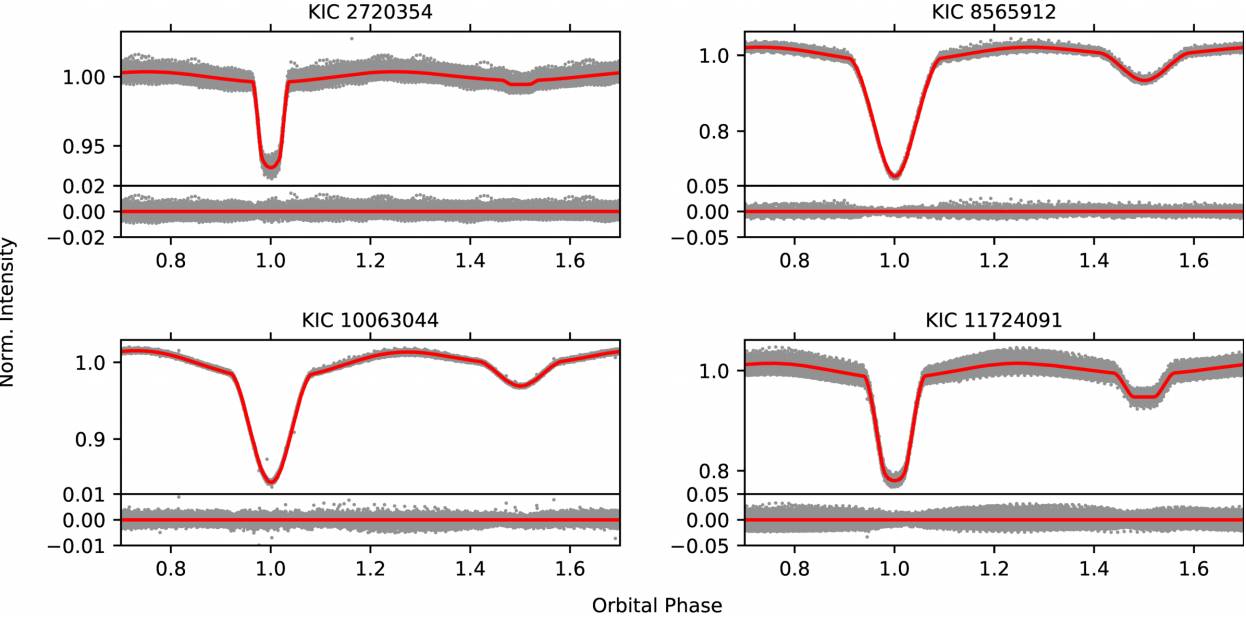
Fig. 2 Phase-folded Kepler light curves (gray filled circles) and best-fitting light curve models (red continuous lines) for each target. Residuals from the best-fitting model are shown under each light curve. The color figure can be viewed online.
TABLE 1 LIGHT CURVE MODELLING RESULTS OF TARGET STARS*
| Parameter | KIC2720354 | KIC8565912 | KIC10063044 | KIC11724091 |
|---|---|---|---|---|
| MODE | 2 | 2 | 5 | 2 |
| T 0 | 54956.21538 | 55000.33427 | 54965.59559 | 54953.85811 |
| P | 2.8213281 | 1.0121736 | 1.0096716 | 1.5590905 |
| q | 0.375(25) | 0.250(25) | 0.150(25) | 0.600(25) |
| T 1(K) | 6600(200) | 7000(200) | 7100(200) | 6800(200) |
| g1, g2 | 0.32, 0.32 | 0.32, 0.32 | 0.32, 0.457(8) | 0.32, 0.32 |
| A1, A2 | 0.5, 0.5 | 0.5, 0.5 | 0.5, 0.385(2) | 0.5, 0.5 |
| F1 = F2 | 1 | 1 | 1 | 1 |
| limb darkening law | log, log | log, log | log, linear | log, log |
| x1,x2 | 0.668, 0.752 | 0.654, 0.758 | 0.652, 0.184 | 0.661, 0.754 |
| y1,y2 | 0.277, 0.322 | 0.289, 0.100 | 0.292, - | 0.283, 0.113 |
| x 1 bol,x 2 bol | - | - | 0.639, 0.535 | - |
| y 1 bol,y 2 bol | - | - | 0.256, - | - |
| phase shift | 0.00030(3) | 0.00112(3) | 0.00082(2) | 0.00012(4) |
| i (◦) | 84.36(2) | 76.16(5) | 68.873(8) | 85.65(7) |
| T 2(K) | 3639(200) | 4742(200) | 4476(200) | 4850(200) |
| Ω1 | 5.423(5) | 3.282(5) | 3.077(1) | 4.405(5) |
| Ω2 | 9.327(9) | 2.438(2) | 2.103 | 6.386(8) |
| L 1/(L 1+L 2) | 0.99788(9) | 0.91710(96) | 0.93919(24) | 0.96019(28) |
| hr 1i | 0.1991(2) | 0.3371(7) | 0.3487(2) | 0.2668(4) |
| hr 2i | 0.0469(1) | 0.2488(6) | 0.2299 | 0.1160(2) |
| θ (◦) | - | - | 113(6) | - |
| φ (◦) | - | - | 73(1) | - |
| rspot (◦) | - | - | 11(1) | - |
| TF | - | - | 1.02 | - |
| Model rms | 0.00016 | 0.00065 | 0.00007 | 0.0006 |
*T 0 and P denote reference ephemeris of the mid-primary eclipse in barycentric Julian days and orbital period in days, respectively. These values are from the Kepler eclipsing binary catalogue. Mean fractional radii of the components are shown by ‹r1,2 ›. Formal uncertainties are shown (in parentheses) for the last digits.
4. ABSOLUTE PARAMETERS
Although we do not have spectroscopic mass functions, we make a fair estimation for the masses of the primary components via the temperature-mass data given by Gray (2005) for main-sequence stars. For a given system, after we find the mass of the primary component, we calculate the mass of the secondary by using the adopted mass ratio. Then, the calculation of the semi-major axis of the system can be done via Kepler’s third law by using the masses of the components and the orbital period. Once the semimajor axis is obtained, absolute radii of the components can be found by multiplying the fractional radius of each component by the semi-major axis, separately. The luminosity of each component is calculated via Stefan-Boltzmann’s law by using values of the effective temperature and radius. Here, we adopt the solar effective temperature as 5780 K. The logarithm of surface gravity of each component can be calculated with the mass and radius values of the corresponding component and Newton’s gravitational constant. Regarding uncertainties, we first consider the assumed uncertainty of the effective temperature and determine lower and upper temperature limits. Then we find corresponding upper and lower limits for the mass of the primary component from Gray (2005). In the same way, we find upper and lower limits for the mass ratio. By using these limits, we calculate upper and lower limits for the mass of the secondary component. Applying a similar process for the remaining parameters we obtain the estimated uncertainties of the calculated parameters. We tabulate the estimated absolute parameters and their uncertainties in Table 2.
TABLE 2 ESTIMATED ABSOLUTE PARAMETERS OF THE COMPONENTS*
| Target | Mass ( |
Radius ( |
log |
log |
|---|---|---|---|---|
| KIC 2720354 | 1.43(8), 0.54(7) | 2.10(5), 0.49(1) | 0.87(7), -1.40(10) | 3.951(3), 4.779(32) |
| KIC 8565912 | 1.59(8), 0.40(6) | 1.80(4), 1.33(3) | 0.84(6), -0.09(8) | 4.130(1), 3.789(45) |
| KIC 10063044 | 1.63(8), 0.25(5) | 1.82(4), 1.20(3) | 0.88(6), -0.28(9) | 4.130(1), 3.661(74) |
| KIC 11724091 | 1.51(8), 0.91(9) | 2.03(5), 0.88(2) | 0.90(6), -0.41(8) | 4.004(3), 4.505(21) |
*Together with uncertainties (in parentheses) for the last digits.
We plot the positions of the primary components on the
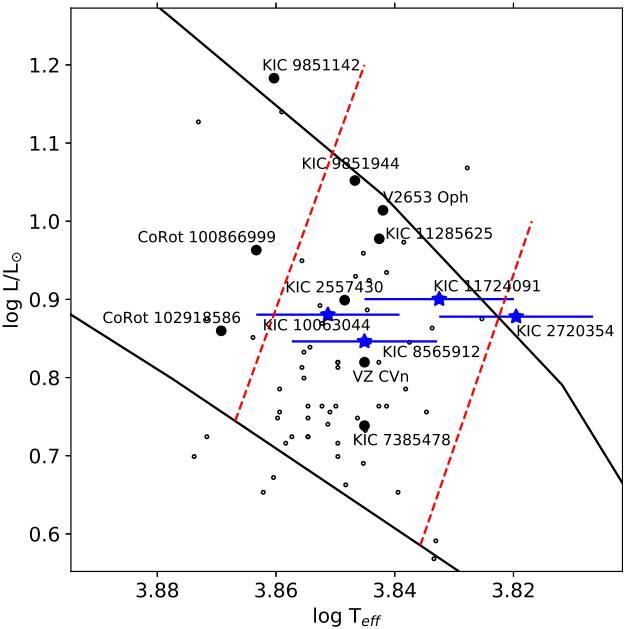
Fig. 3 Positions of the primary components on the
5. VARIATIONS IN LIGHT CURVE RESIDUALS
For each target, we adopt the following method in order to obtain precise residuals from the best-fitting light curve model. First, we divide long cadence data into subsets, where each subset covers only one orbital cycle. Then we adopt the best-fitting light curve model parameters and run the differential correction routine of the WD code with time option. In this step, we only adjust the ephemeris time. After adjusting the ephemeris time, we obtain residuals with respect to the Julian Day. Repeating this procedure for all subsets, we obtain the residuals from the whole long cadence data. In Figure 4, we plot all residuals and a sample of residuals covering a time span of 20 days for each target, separately.
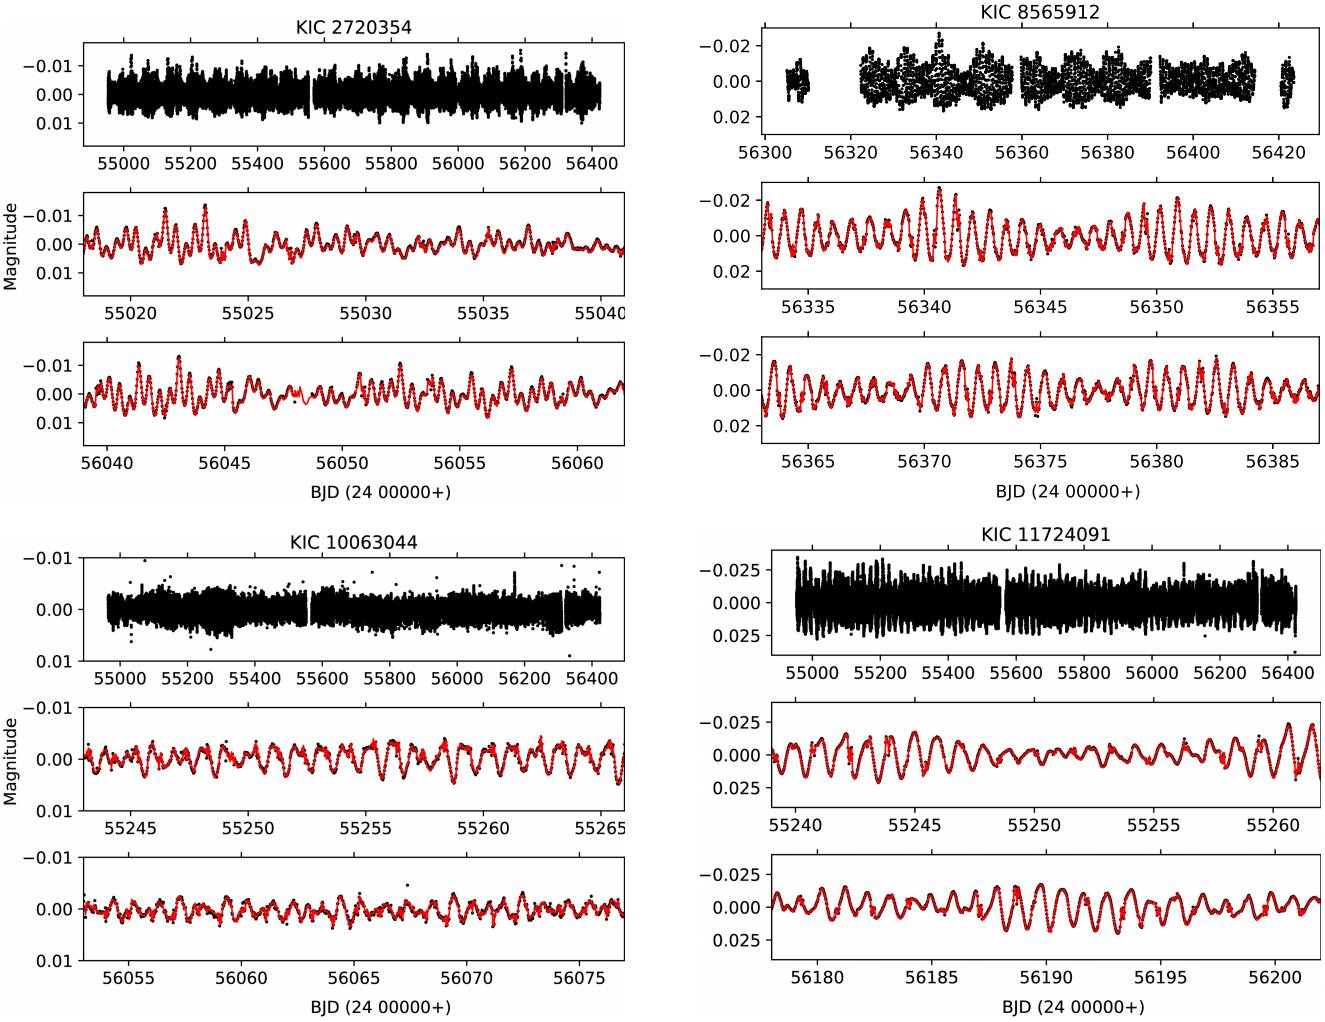
Fig. 4 All long cadence residuals from the best-fitting light curve models for each target (uppermost panels for each star) and different portions of residuals (lower panels). In the lower panels, the red continuous lines show the multi-frequency analysis fit of each star. The color figure can be viewed online.
We observe clear light variations in the residuals. In order to extract frequency signals from the residuals, we apply a multi-frequency analysis by using SigSpec software (Reegen 2007). SigSpec calculates the significance spectrum for a given nonequally spaced time series data and evaluates the probability density function of discrete Fourier transform (DFT) peaks. Multi-frequency signals can be extracted iteratively from non-equally spaced time series data via a prewhitening procedure. In each step of the iterative prewhitening, SigSpec calculates the frequency, amplitude, phase and significance level of the highest peak (signal) in DFT. Then, removing the signal from the time-series data (prewhitening), the process is repeated for the prewhitened time series data. This iterative process runs until the significance level is below a defined limit. In our case, we adopt the significance level limit of 5, approximately corresponding to a signalto-noise ratio of 4 given by Breger et al. (1993). For each star, we scan the frequency region between 0 and the Nyquist frequency of 24.46 cycle-per-day (c/d). We show the resulting amplitude spectra in Figure 5.
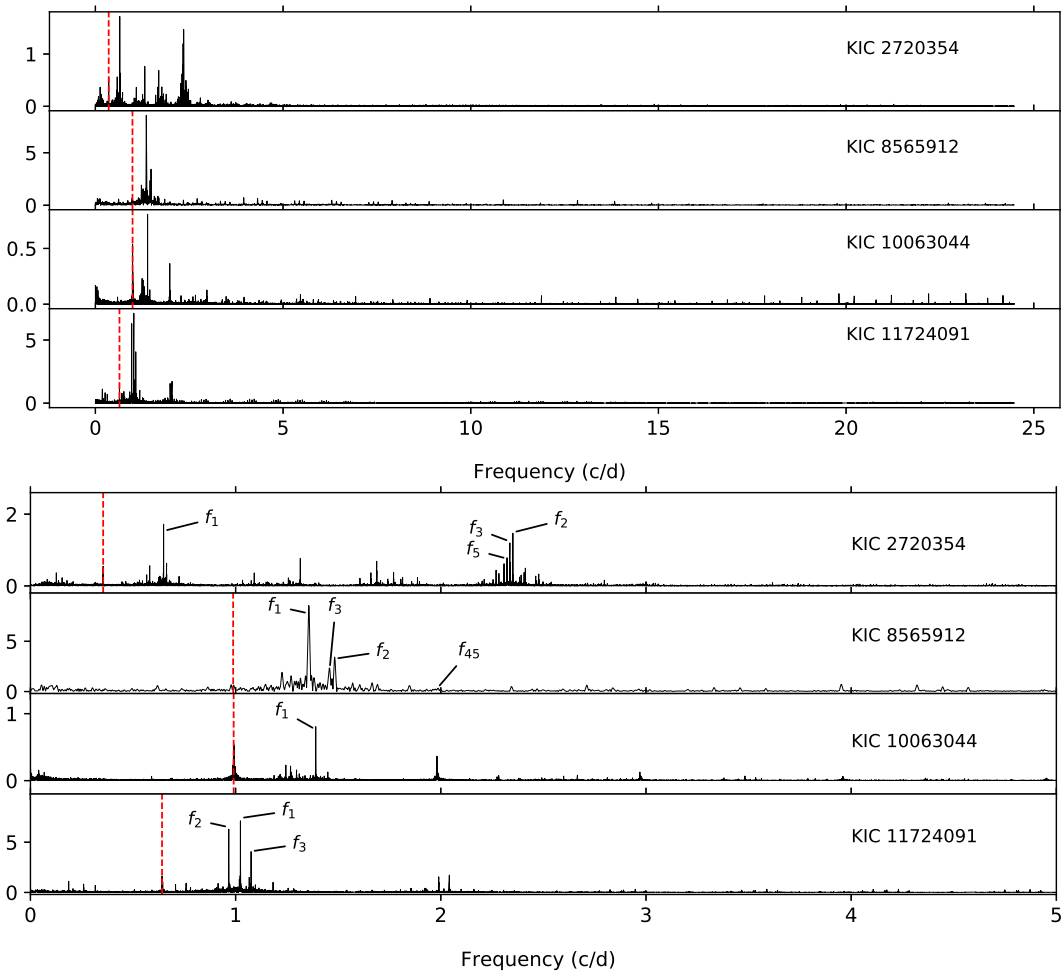
Fig. 5 Upper panel: Amplitude spectrum of all long cadence residuals in Figure 4. Lower panel: Zoomed view of amplitude spectrum between 0 and 5 c/d. The vertical red dashed line in each panel shows the orbital frequency of the corresponding system. The most dominant genuine frequencies of each star (except the orbital frequency) are marked in the plot. Note that the orbital frequencies of KIC8565912 and KIC10063044 are very close to each other. The color figure can be viewed online.
Inspecting Figure 5, one can easily notice a dominant group of frequency peaks below 5 c/d. In the case of KIC8565912 and KIC10063044, relatively low amplitude frequency peaks above 5 c/d also exist. The iterative prewhitening procedure results in 2406, 221, 1089 and 2535 frequencies above a significance level limit of 5 for KIC2720354, KIC8565912, KIC10063044 and KIC11724091, respectively. We use the Rayleigh criterion to check whether these frequencies are genuine or combination frequencies. We find the resulting number of genuine frequencies as 5, 4, 4 and 3 for our targets, in the same order as above. Following the method proposed by Kallinger et al. (2008), we calculate uncertainties of frequency, amplitude and phase of each extracted frequency. We tabulate genuine frequencies in Table 3 and plot multi-frequency analysis fits in Figure 4.
TABLE 3 GENUINE FREQUENCIES FOUND BY FREQUENCY ANALYSIS OF TARGET STARS*
| KIC 2720354 | ||||
| Frequency number | Frequency (c/d) | Amplitude (mmag) | Phase (radian) | rms (mmag) |
| f 1 | 0.648922(13) | 1.53(3) | 1.314(9) | 2.753 |
| f 2 | 2.351234(14) | 1.49(3) | 5.877(9) | 2.470 |
| f 3 | 2.336638(15) | 1.24(3) | 0.424(10) | 2.240 |
| . | . | . | . | . |
| . | . | . | . | . |
| . | . | . | . | . |
| f 5 | 2.322871(21) | 0.76(2) | 0.859(14) | 1.987 |
| . | . | . | . | . |
| . | . | . | . | . |
| . | . | . | . | . |
| f10= forb | 0.354463(25) | 0.57(2) | 4.536(17) | 1.683 |
| . | . | . | . | . |
| . | . | . | . | . |
| . | . | . | . | . |
| KIC 8565912 | ||||
| f 1 | 1.35525(33) | 7.78(30) | 2.312(18) | 7.458 |
| f 2 | 1.48308(50) | 3.27(20) | 3.712(29) | 4.367 |
| f 3 | 1.45844(71) | 1.96(17) | 2.173(40) | 3.702 |
| . | . | . | . | . |
| . | . | . | . | . |
| . | . | . | . | . |
| f45 | 1.98298(196) | 0.34(8) | 3.977(107) | 1.693 |
| . | . | . | . | . |
| . | . | . | . | . |
| . | . | . | . | . |
| KIC 10063044 | ||||
| f 1 | 1.390445(14) | 0.76(2) | 0.141(9) | 1.338 |
| f 2 ≈ forb | 0.991355(19) | 1.02(3) | 0.673(13) | 1.210 |
| f 3 ≈ forb | 0.992617(18) | 0.52(1) | 4.429(12) | 1.149 |
| . | . | . | . | . |
| . | . | . | . | . |
| . | . | . | . | . |
| f10 | 1.244700(34) | 0.22(1) | 5.655(23) | 0.922 |
| . | . | . | . | . |
| . | . | . | . | . |
| . | . | . | . | . |
| KIC 11724091 | ||||
| f 1 | 1.023430(10) | 8.60(12) | 4.770(7) | 8.561 |
| f 2 | 0.966617(9) | 7.98(11) | 2.164(6) | 6.918 |
| f 3 | 1.075495(11) | 4.09(6) | 1.157(7) | 5.296 |
| . | . | . | . | . |
| . | . | . | . | . |
| . | . | . | . | . |
* Uncertainty of each parameter is given in parenthesis for the last digits.
We observe that, for each star, the most dominant frequency in the amplitude spectrum is different from the corresponding orbital frequency and its harmonics. Considering the positions of these stars in Figure 3 and the defined period range for γ Doradus variables (between 0.4 and 3 day; Kaye et al. 1999), we conclude that the primary components of our target systems are γ Doradus type pulsating stars.
6. PULSATION PERIOD RELATIONS
Using the orbital and pulsation periods of the target stars in this study, together with previously reported γ Dor variables in binary systems, we evaluate the relation between pulsation period (Ppuls ) and orbital period (Porb ), the force per gram exerted on the surface of the pulsating star (F/Mpuls ) and the fractional radius of the pulsating star (r). F/Mpuls , which is given by
where G is the Newton’s gravitational constant, Ms is the mass of the secondary component, a is the semi-major axis of the system, Mpuls and Rpuls are the mass and the radius of the pulsating component, respectively (Çakirli & Ibanoglu 2016). In Figure 6, we show the pulsation period relations.
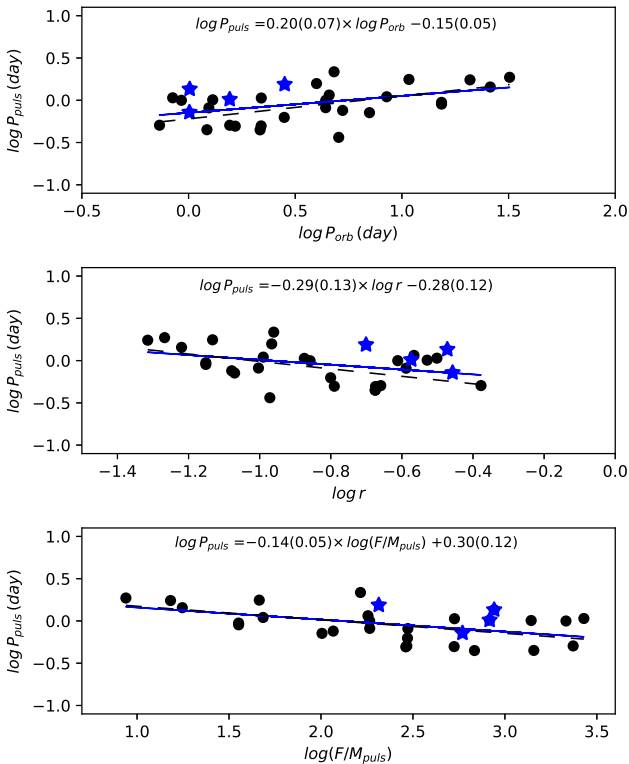
Fig. 6 Relations between pulsation period Ppuls and Porb , r, F/Mpuls on logarithmic scale. Blue star symbols have the same meaning as in Figure 3. Filled black circles are taken from Hoyman et al. (2020), Ibanoglu et al. (2018) and references therein. Dashed lines show relations found by Ibanoglu et al. (2018) while continuous lines are relations updated in this study. Linear fit parameters are given in each window with uncertainties (in parentheses) for the last digits. The color figure can be viewed online.
Comparing with the study of Ibanoglu et al. (2018), we see that the slope of the relations decreases as we add the γ Doradus variables found in this study. However, linear relations on the logarithmic scale still exist. The pulsation period increases with increasing orbital period, while an increase in the fractional radius or in the force per gram exerted the surface of the pulsating star decreases the pulsation period.
7. CONCLUSION
We analysed Kepler photometry of four eclipsing binaries, KIC2720354, KIC8565912, KIC10063044 and KIC11724091. Light curve modelling results, based on pure space photometry, show that KIC2720354, KIC8565912 and KIC11724091 are detached eclipsing binaries, while KIC10063044 is a semi-detached eclipsing binary. The semi-detached configuration suggests the possibility of mass transfer from the secondary (low mass) component to the primary (high mass). Phase-folded light curve residuals from the best-fitting light curve model for KIC10063044 exhibit a stable wave pattern. This pattern indicates the existence of a cool or a hot spot on one of the components. Considering the mass transfer possibility, the primary component very likely possesses a warmer local region on its surface (compared to the surrounding photosphere), which could be modelled by a hot spot. This hot spot might probably be the result of a direct hit of the transferred mass on the surface of the primary component, without forming a circumstellar disk. Considering the mass ratio (q = 0.15) of the system and the fractional radius of the primary component (r 1 = 0.3487), we do not expect any disc formation around the primary component (Lubow & Shu 1975).
Analysing the residuals from the best-fitting light curve models, we find that multi-frequency signals exist in them. The application of multi-frequency analysis reveals a group of frequency peaks, mostly in the region between 0 and 5 c/d. For each binary, we also observe that the most dominant frequency found in the residuals is independent of the orbital frequency. The position of the primary component of each binary in the HR diagram and the frequency value of the most dominant peak extracted in the frequency analysis clearly indicate that the primary components are γ Doradus-type pulsating variables. Multifrequency analysis of residuals results in thousands of frequencies above the significance limit of 5 for KIC2720354, KIC10063044 and KIC11724091, while 221 frequencies were found for KIC8565912. Here, we note that long cadence photometry of KIC8565912 is only available for quarters 16 and 17 in the Kepler photometry, which corresponds to a time base of ≈ 180 days. Photometry of other targets is available for all 17 quarters (≈ 1400 days). Thus, we believe that the restricted time base of the KIC8565912 photometry is responsible for the lower number of extracted frequencies over the adopted significance level.
The existence of pulsation period relations for γ Doradus variables in eclipsing binaries was reported before, along with a theoretical basis (Çakirli & Ibanoglu 2016; Ibanoglu et al. 2018). We revised the relations given by Ibanoglu et al. (2018) by adding four new γ Doradus variables found in our study.
Updated relations show weaker, but still considerable, correlations between pulsation period and orbital period, fractional radius of the pulsating component and the force per gram exerted on the surface of the pulsating star.
Further detailed spectroscopic studies of these systems are critical to obtain accurate stellar parameters of each member of these binaries, especially for the γ Dor primary components. This would enable the accurate study of pulsation period relations, as well as the modelling of the inner structure of the γ Dor primary components via asteroseismology (Li et al. 2020), which is strongly based on accurate stellar parameters.
We thank Dr. Can Akan for a careful reading of the manuscript and language improvements of the text. We also thank an anonymous referee for a discussion of the period relations, which improved the quality of the paper. This paper includes data collected by the Kepler mission. Funding for the Kepler mission is provided by the NASA Science Mission Directorate. This research has made use of NASA’s Astrophysics Data System and the SIMBAD database, operated at CDS, Strasbourg, France.

