


 nueva página del texto (beta)
 Inglés (pdf)
 Artículo en XML
 Referencias del artículo
 Enviar artículo por email
 Citado por SciELO
  Similares en
SciELO
Similares en
SciELO 
 Permalink
1.INTRODUCTION
Symbiotic systems are a group of interacting binary stars consisting of a cool giant star, a hot white dwarf or a neutron star, and in some cases a nebula (Murset et al. 1997). These systems exhibit different outburst behaviors; some authors interpret them as due to different physical processes (Mikolajewska & Kenyon 1992; Kenyon & Webbink 1984). Symbiotic binaries are divided into two classes: S type, characterized by a stellar continuum, and D type, characterized by a thick dust shell. Symbiotic novae are a subgroup of symbiotic stars displaying a major thermonuclear eruption as a result of the accretion of matter from the cool red giant onto the hot component, with a long time - scale evolution of their decay (Tomov & Tamova 2001).
Some symbiotic systems exhibit a large variety of emission lines with different ionization states because not all systems have a nebula. The absence of emission lines may be due to the high density of the nebula. Some theoretical models attempt to interpret the spectra. Nussbaumer & Vogel (1987) employ a model consisting of a double star system with a nebula created by the mass loss of the cool component and ionized by the radiation of the hot component. As a result of their model calculations they suggest that nova-like nuclear processes were responsible for the eruption of HM Sge 1975. Slovak (1978) developed a model of a binary symbiotic system containing a late type variable.
HM Sge is a D type symbiotic nova consisting of a cool red giant Mira star with a pulsation period of 527 days (Murset & Schmid 1999; Munari & Whitelock 1989). In 1975, HM Sge changed in optical magnitude from 17 to 11 (Dokuchaeva 1976). This increase in brightness was interpreted as nova eruption resulting from a thermonuclear runaway (TNR) on the surface of the hot white dwarf due to an accumulation of accreted matter.
Puetter et al. (1978) suggested that HM Sge is a binary star system containing a dust embedded cool component and an optically hot component. In their model the flux is a result of a combination of optically thin dust emission and emission from the reddened photosphere of the cool component. The presence of a cool component is inferred from the shape of the continuum.
Lee (2009) adopted a wind accretion disk model and described the emission region by a Keplerian thin disk with Raman scattering occuring in a neutral region near the cool star. By using a Monte Carlo technique, they computed the line profiles that vary by the slow spherical stellar wind from the cool component, with the ionization front approximated by a hyperboloid.
Ciatti et al. (1977), using optical photometric and spectroscopic observations, reported that HM Sge has nebular emission lines similar to V1016 Cyg. HM Sge may evolve to a compact planetary nebula like IC 4997 and Hb 12, and later on to an extended nebula such as M 2 - 9. Stover & Sivertsen (1977) using optical spectroscopic observations found a typical nebular emission spectrum. They called it a new emission line object, with R.A.=19:39, Dec=+16:38 representing the coordinates of HM Sge.
Taranova & Yudin (1982) found that the infrared flux variations of HM Sge indicated the presence of a cool Mira star, while Corradi et al. (1999), from optical spectroscopy, reported that HM Sge has a large-scale outflow which they attributed to a fast wind from the hot white dwarf. Mueller & Nussbaumer (1985) used ultraviolet observations from IUE to calculate the temperature of the nebula and deduced that the emitting region is radiatively ionized.
Feibelman (1982) also using IUE observations, found that HM Sge has undergone large temporal variations in the ultraviolet emission line fluxes, with a trend toward higher ionization and excitation levels. Nussbaumer & Vogel (1990) proposed a model for HM Sge consisting of a binary system associated with a nebula formed by the loss of mass from the Mira star. This nebula is ionized by the radiation of the white dwarf. They also reported that the radiation temperature increased from 4 x 10⁴K in 1976 to 1.7 x 10⁵ K in 1989.
Eyres et al. (2001), using Hubble Space Telescope observations discussed the nebular conditions of HM Sge and deduced that the true value of reddening is E(B-V) = 0.35. They identified a number of discrete features with radio and optical emission embedded in the extended nebula, and measured directly for the first time the positions of the binary components of HM Sge. They estimated the projected angular binary separation to be 40 ± 9 mas. Temperature and density diagnostics revealed two distinct regions in the surrounding nebula.
Stauffer (1984) reported that the optical emission lines are produced in a colliding region of the wind from the hot white dwarf and the wind from the cool Mira, and interpreted the outburst of HM Sge as a result of a hydrogen flash in the envelope of the hot star.
The important observational characteristics in our study are that firstly, the ultraviolet emission line fluxes have nearly the same spectral behavior, indicating a possible common origin in the wind of the hot white dwarf; and secondly the modulations of the mass loss rate are interpreted as due to the increase and decrease in the temperature and density.
In this paper we present an analysis of the ultraviolet data obtained with the International Ultraviolet Explorer (IUE) of HM Sge. Previous studies are those of Mueller & Nussbaumer (1985); Nussbaumer & Vogel (1990). In § 2 we discuss the IUE observations and in § 3 we present the method of determining the reddening. § 4 shows the results and discussion of the spectral behavior of emission lines in the colliding wind from hot white dwarf. § 5 contains the conclusions of this paper.
2. Ultraviolet observations of HM Sge with IUE
The International Ultraviolet Explorer (IUE) observations have been retrieved from the INES (IUE Newly Extracted Spectra) site at http://ines.vilspa.esa.es. The ultraviolet spectra with low resolution (6 Å) and short wavelength (1150 - 1950 ) were used in the reduction and analysis. For more information and description of the ultraviolet spectra see Rodriguez-Pascual et al. (1999)) and Gonzalez et al. (2001).
The IUE observations have been used in some previous studies, e.g. Mueller & Nussbaumer (1985), They calculated the line fluxes of some emission lines such as CIV 1550 ; the variations of CIV through the period from January 1978 to April 1982 were 4.6 x10⁻¹² to 15.9 x 10⁻¹²erg cm-2s-1.
Feibelman (1982) analyzed CIV 1550 in different epochs and found variations in the flux of the line in order of 5.02 x 10⁻¹² to 12.93 x 10⁻¹²erg cm-2s-1; Nussbaumer & Vogel (1990) found variations in the flux of the CIV line of order 9.4 x10⁻¹² to 20 x10-12erg cm-2s-1.
The log of the IUE observations is listed in Table 1. Figure 1 shows the variations in line fluxes with time. The MIDAS software was used for processing the spectra. For the estimations of the fluxes of emission lines we used the integrate/line command in the MIDAS software suite to estimate the continuum level and to integrate the flux of the emission line above the continuum.
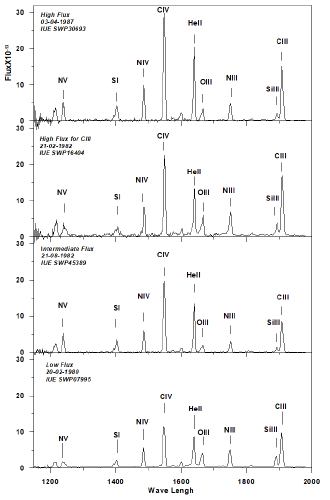
Fig. 1 IUE spectrum of HM Sge during different stages (The flux is plotted in units of erg cm-2s-1).
Table 1 List of IUE Observations
| Image | Dispersion | Aperture | Observation | J.D. |
| ID | Date | |||
| SWP07995 | Low | Large | 1980-02-20 | 2444290.15734 |
| SWP09898 | Low | Large | 1980-08-25 | 2444477.28274 |
| SWP09943 | Low | Large | 1980-08-29 | 2444480.65055 |
| SWP13546 | Low | Large | 1981-03-22 | 2444685.99707 |
| SWP13548 | Low | Large | 1981-03-22 | 2444686.25105 |
| SWP14704 | Low | Large | 1981-08-09 | 2444826.30751 |
| SWP14756 | Low | Large | 1981-08-14 | 2444831.01329 |
| SWP15353 | Low | Large | 1981-10-31 | 2444909.42918 |
| SWP15355 | Low | Large | 1981-11-01 | 2444909.69151 |
| SWP16402 | Low | Large | 1982-02-21 | 2445022.13708 |
| SWP16404 | Low | Large | 1982-02-21 | 2445022.35865 |
| SWP16705 | Low | Large | 1982-04-07 | 2445066.51274 |
| SWP16706 | Low | Large | 1982-04-07 | 2445066.55572 |
| SWP16752 | Low | Large | 1982-04-13 | 2445072.63036 |
| SWP16753 | Low | Large | 1982-04-13 | 2445072.69293 |
| SWP25552 | Low | Large | 1985-03-30 | 2446155.31349 |
| SWP28896 | Low | Large | 1986-08-14 | 2446155.31349 |
| SWP28897 | Low | Large | 1986-08-14 | 2446657.36038 |
| SWP30693 | Low | Large | 1987-04-03 | 2446888.58032 |
| SWP30694 | Low | Large | 1987-04-03 | 2446888.64367 |
| SWP31033 | Low | Large | 1987-05-23 | 2446939.37905 |
| SWP33154 | Low | Large | 1988-03-25 | 2447245.68857 |
| SWP33155 | Low | Large | 1988-03-25 | 2447245.79245 |
| SWP35921 | Low | Large | 1989-04-03 | 2447619.73762 |
| SWP35922 | Low | Large | 1989-04-03 | 2447619.79851 |
| SWP36951 | Low | Large | 1989-09-07 | 2447777.19521 |
| SWP37572 | Low | Large | 1989-11-12 | 2447843.02143 |
| SWP37573 | Low | Large | 1989-11-12 | 2447843.14039 |
| SWP38638 | Low | Large | 1990-04-21 | 2448002.60074 |
| SWP38939 | Low | Large | 1990-04-21 | 2448002.70632 |
| SWP39837 | Low | Large | 1990-10-15 | 2448180.41296 |
| SWP39838 | Low | Large | 1990-10-15 | 2448180.47445 |
| SWP42154 | Low | Large | 1991-08-01 | 2448470.46081 |
| SWP42547 | Low | Large | 1991-09-24 | 2448524.19478 |
| SWP42548 | Low | Large | 1991-09-24 | 2448524.30658 |
| SWP45354 | Low | Large | 1992-08-16 | 2448850.97169 |
| SWP45355 | Low | Large | 1992-08-16 | 2448851.01356 |
| SWP45387 | Low | Large | 1992-08-21 | 2448855.75214 |
| SWP45389 | Low | Large | 1992-08-21 | 2448855.86235 |
| SWP46011 | Low | Large | 1992-10-19 | 2448915.12249 |
| SWP46012 | Low | Large | 1992-10-19 | 2448915.21653 |
3. Method of estimating the reddening
The reddening of HM Sge was determined using the 2200 absorption feature. We used the best data set of Short Wavelength Prime spectra (SWP) with low resolution (6 Å) in the range of wavelengths between and Long Wavelength Redundant (LWR) spectra with low resolution (6 Å) in the range of wavelengths between 2000 - 3000 . The spectra are binned in 15 bins for SWP and 25 bins for LWR. The following observations were selected for our determination of the reddening (LWP08880 - LWP12920 - LWP19016 - LWP24119) & (SWP28896 - SWP33154 - SWP38638 - SWP46011) which gave the best smoothing spectrum suitable for our determination of the reddening value.
The most suitable value is determined by visual inspection of the plots for the best fit to the 2200 absorption feature, which represented the best agreement between observations and standard theoretical (dashed line) values. The estimated value of the reddening for HM Sge is E(B-V)=0.34 ± 0.02 as shown in Figure 2.
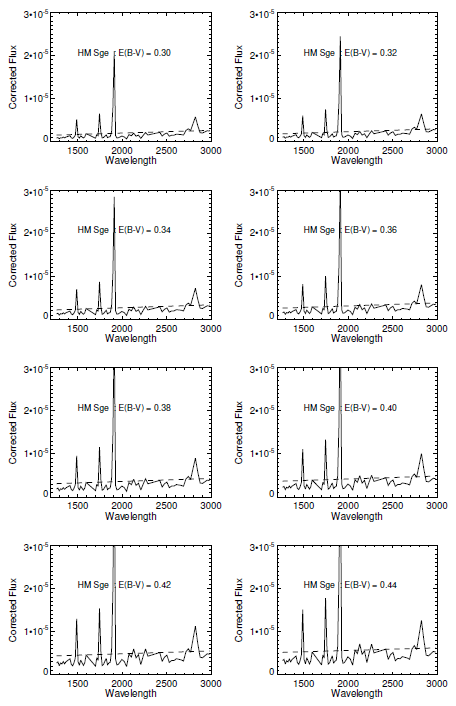
Eyres et al. (2001) reported the reddening for HM Sge as E(B-V) = 0.35; Ivison et al. (1991) found the reddening to be E(B-V) = 0.58; Muellar & Nussbaumer (1985) determined a reddening of E(B-V) = 0.61, Murset et al. (1991) found the reddening to be E(B-V) = 0.63. Our estimated value is very close to that determined by Eyres et al. (2001) using the extinction map method.
4. Results and discussion
4.1.Method of Calculating the Line Fluxes of Emission Lines.
We fitted the observed portions of the wings of emission lines by a Gaussian function. The “integrate/line” command in the software ESO/MIDAS was effectively used to estimate the continuum level and to integrate the flux of the CIV 1550 , He 1640 and CIII] 1909 emission lines above this continuum. For the measurements of emission line fluxes, we determined the integrated fluxes for the emission lines in units of erg cm-2s-1.
4.2.Time Variations of the Spectral Lines from the Wind of Hot Star
The CIV spectral line at 1550 is a resonance emission line, the He II spectral line at 1640 is a recombination line, and the CIII] emission line at 1909 is an intercombination line, previously discussed by Mueller & Nussbaumer (1985), Nussbaumer & Vogel (1990).
The line fluxes of CIV & He II and CIII] emission lines vary with time over short and long time scales, from hours to years. There was a steady increase in line fluxes until April 1982, and they reached a maximum flux in April 1987. The origin of the emission lines may be the wind from the hot white dwarf since their spectral behavior is similar. Table 2 contains fluxes for CIV, He II and CIII] emission lines and Figures 3, 4, 5 represent the spectral behavior of such lines. The errors for the measured line fluxes are in the range of 1σ, as determined by the methods reported in Lenz and Ayres (1992).
Table 2 IUE line Fluxes of CIV, II and CIII] in units of 10-11 erg cm-2 s-1
| Image | CIV | He II | CIII | Observation | J.D. |
| ID | 1550 | 1640 | 1909 | Date | |
| SWP07995 | 11.04 | 6.06 | 9.24 | 1980-02-20 | 2444290.15734 |
| SWP09898 | 14.55 | 7.51 | 12.30 | 1980-08-25 | 2444477.28274 |
| SWP09943 | 12.84 | 8.25 | 8.64 | 1980-08-29 | 2444480.65055 |
| SWP13546 | 12.16 | 7.40 | 7.92 | 1981-03-22 | 2444685.99707 |
| SWP13548 | 15.67 | 8.97 | 13.81 | 1981-03-22 | 2444686.25105 |
| SWP14704 | 14.64 | 7.64 | 11.89 | 1981-08-09 | 2444826.30751 |
| SWP14756 | 14.16 | 8.31 | 8.88 | 1981-08-14 | 2444831.01329 |
| SWP15353 | 12.70 | 7.91 | 10.52 | 1981-10-31 | 2444909.42918 |
| SWP15355 | 15.53 | 8.83 | 14.66 | 1981-11-01 | 2444909.69151 |
| SWP16402 | 12.83 | 8.71 | 10.11 | 1982-02-21 | 2445022.13708 |
| SWP16404 | 17.17 | 9.91 | 15.64 | 1982-02-21 | 2445022.35865 |
| SWP16705 | 18.54 | 9.66 | 12.82 | 1982-04-07 | 2445066.51274 |
| SWP16706 | 14.73 | 9.13 | 9.36 | 1982-04-07 | 2445066.55572 |
| SWP16752 | 17.20 | 9.14 | 13.32 | 1982-04-13 | 2445072.63036 |
| SWP16753 | 12.25 | 7.81 | 8.37 | 1982-04-13 | 2445072.69293 |
| SWP25552 | 18.32 | 12.05 | 10.79 | 1985-03-30 | 2446155.31349 |
| SWP28896 | 22.31 | 13.74 | 12.63 | 1986-08-14 | 2446155.31349 |
| SWP28897 | 11.03 | 7.67 | 6.01 | 1986-08-14 | 2446657.36038 |
| SWP30693 | 24.40 | 15.30 | 12.39 | 1987-04-03 | 2446888.58032 |
| SWP30694 | 13.65 | 9.76 | 7.83 | 1987-04-03 | 2446888.64367 |
| SWP31033 | 17.93 | 11.78 | 9.93 | 1987-05-23 | 2446939.37905 |
| SWP33154 | 22.78 | 12.50 | 10.86 | 1988-03-25 | 2447245.68857 |
| SWP33155 | 13.92 | 13.70 | 8.46 | 1988-03-25 | 2447245.79245 |
| SWP35921 | 21.31 | 10.12 | 9.60 | 1989-04-03 | 2447619.73762 |
| SWP35922 | 15.57 | 11.60 | 7.45 | 1989-04-03 | 2447619.79851 |
| SWP36951 | 20.02 | 9.72 | 8.13 | 1989-09-07 | 2447777.19521 |
| SWP37572 | 18.76 | 11.06 | 8.29 | 1989-11-12 | 2447843.02143 |
| SWP37573 | 10.91 | 11.53 | 5.53 | 1989-11-12 | 2447843.14039 |
| SWP38638 | 18.51 | 8.23 | 6.69 | 1990-04-21 | 2448002.60074 |
| SWP38939 | 9.62 | 10.90 | 5.27 | 1990-04-21 | 2448002.70632 |
| SWP39837 | 18.71 | 6.52 | 8.31 | 1990-10-15 | 2448180.41296 |
| SWP39838 | 11.96 | 10.21 | 6.28 | 1990-10-15 | 2448180.47445 |
| SWP42154 | 16.01 | 8.26 | 6.42 | 1991-08-01 | 2448470.46081 |
| SWP42547 | 17.81 | 9.02 | 6.98 | 1991-09-24 | 2448524.19478 |
| SWP42548 | 8.29 | 9.37 | 5.35 | 1991-09-24 | 2448524.30658 |
| SWP45354 | 17.10 | 5.93 | 6.75 | 1992-08-16 | 2448850.97169 |
| SWP45355 | 17.82 | 9.75 | 8.20 | 1992-08-16 | 2448851.01356 |
| SWP45387 | 16.82 | 10.18 | 6.66 | 1992-08-21 | 2448855.75214 |
| SWP45389 | 16.53 | 9.19 | 7.65 | 1992-08-21 | 2448855.86235 |
| SWP46011 | 18.38 | 9.60 | 7.95 | 1992-10-19 | 2448915.12249 |
| SWP46012 | 11.63 | 9.76 | 5.74 | 1992-10-19 | 2448915.21653 |
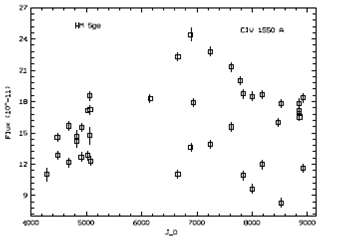
Fig.3. Time evolution (JD - 2440000) of the CIV emission line flux. The 1σ error bars are shown on each data point (The flux is plotted in units of erg cm-2s-1 Å-1).
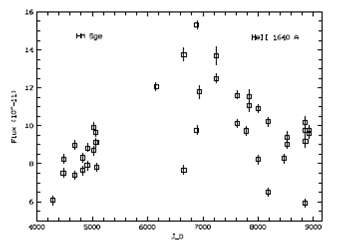
Fig. 4 Time evolution (JD - 2440000) of the He II emission line flux. The 1σ error bars are shown on each data point (The flux is plotted in units of erg cm-1s-1 Å -1).
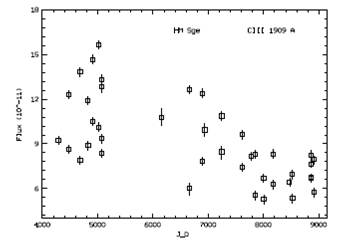
Fig. 5 Time evolution (JD - 2440000) of the CIII] emission line flux. The 1σ error bars are shown on each data point (The flux is plotted in units of erg cm-1s-1 Å -1).
The transferred mass from the cool star (Mira) to the hot white dwarf increases the temperature of the hydrogen layer on top of the white dwarf (WD). The transfer of mass leads to an outburst and consequently to a rise in both luminosity and radiation pressure. The increased radiation pressure will eject some of the atmosphere of the WD as a stellar wind. At this stage HM Sge contains a wind from a cool Mira and a wind from the white dwarf. As a result of the motion of two winds toward each other, the collision between them occurs at some distance and forms what is known as the colliding wind region. As a result of this collision, two shocks are formed, one toward the white dwarf, the other toward the cool star, (Girard & Willson 1987; Formiggini et al. 1995).
The radiation from the hot WD increased the temperature of this facing shock and led to a steady increase in the line fluxes of CIV, He II and CIII] until 1982, reaching a maximum in 1987. The shock facing the WD weakened with time. The decline in this shock led to a decrease of the velocity of the hot wind, and consequently a decrease in the rate of mass loss from the hot white dwarf; so, both the density and temperature of the emitting region (wind of WD) decreased and therefore the line fluxes decreased.
The spectral behavior of the symbiotic nova HM Sge differs from the ultraviolet spectral behavior of classical novae such as GQ Mus, (Sanad & Abdel-Sabour 2016). The nature of the physical environment in the emitting regions of the two systems is different, and consequently the effect of the physical conditions on the emission lines also differs, as do the wind of the hot white dwarf for HM Sge and the expanding shell of ejecta for GQ Mus.
Similarly, the spectral behavior of HM Sge differs from the spectral behavior of PU Vul, because of different physical environments. For PU Vul, there is a nebula around the white dwarf, which is partially eclipsed by a cool giant star, as opposed to the wind of a hot white dwarf in the case of HM Sge (Sanad 2016).
However, the spectrum of HM Sge is similar to the ultraviolet spectral behavior of both V 1016 Cyg and AG Peg, since the spectral lines are produced in the same emitting region with similar physical effects: a wind from a hot white dwarf for the three symbiotic novae (Sanad 2017 a,b).
The velocity of the emitting region can be determined from the expansion of this region. The Full Width at Half Maximum (FWHM) of emission lines increases as a result of the Doppler shift. Table 3 shows the velocities of the CIV line.
Table 3 CIV (FWHM) in kms-1
| Image | CIV | Observation | J.D. |
| ID | (FWHM) | Date | |
| SWP07995 | 1457 | 1980-02-20 | 2444290.15734 |
| SWP09898 | 1263 | 1980-08-25 | 2444477.28274 |
| SWP09943 | 1477 | 1980-08-29 | 2444480.65055 |
| SWP13546 | 1417 | 1981-03-22 | 2444685.99707 |
| SWP13548 | 1311 | 1981-03-22 | 2444686.25105 |
| SWP14704 | 1323 | 1981-08-09 | 2444826.30751 |
| SWP14756 | 1403 | 1981-08-14 | 2444831.01329 |
| SWP15353 | 1411 | 1981-10-31 | 2444909.42918 |
| SWP15355 | 1258 | 1981-11-01 | 2444909.69151 |
| SWP16402 | 1423 | 1982-02-21 | 2445022.13708 |
| SWP16404 | 1085 | 1982-02-21 | 2445022.35865 |
| SWP16705 | 1226 | 1982-04-07 | 2445066.51274 |
| SWP16706 | 1429 | 1982-04-07 | 2445066.55572 |
| SWP16752 | 1199 | 1982-04-13 | 2445072.63036 |
| SWP16753 | 1479 | 1982-04-13 | 2445072.69293 |
| SWP25552 | 1357 | 1985-03-30 | 2446155.31349 |
| SWP28896 | 1291 | 1986-08-14 | 2446155.31349 |
| SWP28897 | 1702 | 1986-08-14 | 2446657.36038 |
| SWP30693 | 1216 | 1987-04-03 | 2446888.58032 |
| SWP30694 | 1632 | 1987-04-03 | 2446888.64367 |
| SWP31033 | 1501 | 1987-05-23 | 2446939.37905 |
| SWP33154 | 1185 | 1988-03-25 | 2447245.68857 |
| SWP33155 | 1520 | 1988-03-25 | 2447245.79245 |
| SWP35921 | 1238 | 1989-04-03 | 2447619.73762 |
| SWP35922 | 1501 | 1989-04-03 | 2447619.79851 |
| SWP36951 | 1212 | 1989-09-07 | 2447777.19521 |
| SWP37572 | 1207 | 1989-11-12 | 2447843.02143 |
| SWP37573 | 1556 | 1989-11-12 | 2447843.14039 |
| SWP38638 | 1183 | 1990-04-21 | 2448002.60074 |
| SWP38939 | 1665 | 1990-04-21 | 2448002.70632 |
| SWP39837 | 1178 | 1990-10-15 | 2448180.41296 |
| SWP39838 | 1538 | 1990-10-15 | 2448180.47445 |
| SWP42154 | 1194 | 1991-08-01 | 2448470.46081 |
| SWP42547 | 1243 | 1991-09-24 | 2448524.19478 |
| SWP42548 | 1731 | 1991-09-24 | 2448524.30658 |
| SWP45354 | 1189 | 1992-08-16 | 2448850.97169 |
| SWP45355 | 1212 | 1992-08-16 | 2448851.01356 |
| SWP45387 | 1202 | 1992-08-21 | 2448855.75214 |
| SWP45389 | 1244 | 1992-08-21 | 2448855.86235 |
| SWP46011 | 1194 | 1992-10-19 | 2448915.12249 |
| SWP46012 | 1502 | 1992-10-19 | 2448915.21653 |
The integrated fluxes (F) of CIV 1550 Å, He II 1640 and CIII] 1909 are used to determine the average ultraviolet luminosities from the following equation. The distance of ≈1000 pc to the HM Sge is used, as estimated by Richards et al. (1999).
The ultraviolet luminosity of the emitting region is ≈4 x 1034 ergs-1. This value is comparable to that derived by Willson et al. (1984).
The radius of the hot white dwarf is determined to be 9.3 x 108cm by the following equation, assuming the mass of the hot white dwarf to be 0.7Mʘ, Nussbaumer & Vogel (1990).
Our calculated value of the radius is comparable to that calculated by Murset et al. (1997).
The rate of the wind mass loss is determined from the following equation (Bode & Evans 2008):
Where αw is an arbitrary parameter. We found an average value of the rate of wind mass loss to be . This value is comparable to that calculated by Livio et al. (1989) and Nussbaumer & Vogel (1990)
The Steffan-Boltzmann equation is used to calculate the temperature of the emitting region,
Where σ ≈ 5.6704 x 10⁻⁵ ergcm-2s-1K-4 is the Steffan Boltzmann constant, and A = 4π r2 is the surface area. The average temperature is ≈ 1 x10⁵ K. Our estimated value is comparable to that reported by Nussbaumer & Vogel (1990) and Muellar & Nussbaumer (1985).
5. Conclusions
In this paper we studied ultraviolet observations of the symbiotic nova HM Sge obtained by the IUE. The main purpose of this work was to constrain and diagnose the emitting region (wind of the hot star) using some specific spectral lines (CIV, He II & CIII) and to estimate some physical parameters. The calculated physical parameters agree with previous determinations. The main results are as follows:
The accumulation of mass from the Mira star leads to an outburst of HM Sge.
The emission lines are produced in the wind from the hot white dwarf. This emitting region is formed as a result of the collision between two winds from the two stars and, consequently, the collision leads to the formation of two shocks, one toward the white dwarf and the other toward the cool Mira.
The line flux modulations are attributed to the variations of mass loss.
The estimated ultraviolet luminosity, wind mass loss rate and temperature are consistent with previous calculations.
The ultraviolet observations with the IUE can be interpreted with the wind models of symbiotic novae.

