


 nueva página del texto (beta)
 Inglés (pdf)
 Artículo en XML
 Referencias del artículo
 Enviar artículo por email
 Citado por SciELO
  Similares en
SciELO
Similares en
SciELO 
 Permalink
1. INTRODUCTION
High luminosity extragalactic radio sources (HLEGRSs) are known to show double structure, with the extended lobes straddling the compact optical component, which is often coincident with the nucleus of the parent galaxy or quasar. One of the most striking features of these double sources is that their jets are observed only on one side of the lobes (e.g. Bridle & Perley 1984; Onuchukwu & Ubachukwu 2013). Asymmetries have also been found in the angular size separation, flux densities and depolarization of the two components/lobes, which could be correlated with jet-sidedness (e.g. Garrington 1988; Garrington et al. 1988). Whether the one sidedness of jets in powerful radio sources is intrinsic or due to Doppler and projection effects has been a subject of continued controversy (e.g Saikia 1984; Onah et al. 2014). Moreover, because the jets have to inter-act with the intergalactic medium (IGM), the overall structure of these sources could depend on the nature of the ambient medium.
In classical double radio sources, the twin radio lobes are believed to move out symmetrically from the core at relativistic speeds. Thus, in powerful Fanaroff and Riley (1974) class II (FR II) radio galaxies, which supposedly form the less beamed counterparts of quasars and which are believed to be observed more or less in the plane of the sky, the twin radio lobes are expected to be highly symmetric both in terms of size and emitted power (e.g. Gopal-Krishna et al. 1996). However, observational evidence (e.g. Barthel 1989; Scheuer 1995) suggests that this symmetric scenario is not exactly the case, as varying degrees of structural asymmetries and misalignments of the radio lobes are present in many samples of FR II radio sources. These asymmetries can be attributed to factors that could be intrinsic, environmental and/or arising from relativistic beaming and orientation effects. Thus, the ratios of an-gular separation (Q) and that of flux densities (F ) of the two components are crucial symmetry parameters, which could be used to study the dynamical evolution of double radio sources (e.g. Longair and Ryle 1979; Banhatti 1980; Kapahi & Saikia 1982). Although Swarup & Banhatti (1981) have proposed a possible connection between Q and F in asymmet-ric sources with constant beam power, the effects of relativistic beaming appear to have significantly contaminated the F − Q data, so that this connection between the two asymmetry parameters is yet to be satisfactorily understood (Conway & Strom 1985; Onuchukwu and Ubachukwu 2013).
In the present paper, we wish to re-examine the distribution of the angular separation ratio of the highly asymmetric double radio sources in connection with approaching and receding lobes. This will be based on the two popular models of asymmetries in Active Galactic Nuclei (AGNs), namely: relativistic beaming model (RBM) and density variation model (DVM), which among other effects have been held largely responsible for explaining the structural asymmetries of double radio sources (e.g Kharb et al. 2008; Onah et al. 2014). We seek also to quantitatively examine the statistical consequences of relativistic beaming on the structural asymmetries of the highly asymmetric sources.
2. RELATIVISTIC BEAMING AND ORIENTATION MODEL FOR ASYMMETRIC SOURCES
If the ambient medium and jets emanating from the opposite directions of the active galactic nuclei are both symmetrical, then the approaching component would always appear further from the core than the receding component. In the relativistic beaming model (Scheuer and Readhead, 1979), the ratio Q of the angular separation of the approaching (θapp) and receding (θrec) components of a double radio source is given in terms of the viewing angle (ϕ) by (e.g Gopal-Krishna & Wiita 2004; Onuchukwu and Ubachukwu, 2013)
where β is the separation velocity of the two com-ponents from the parent object in units of the speed of light. The study of the distribution of Q for a complete sample of sources is crucial to understand the physics of radio source evolution as well as the nature of the environment in which these sources are located (Onuchukwu, 2017).
If the approaching and receding lobes are intrinsically symmetric and the observed flux asymmetries are predominantly a result of Doppler beaming, it has been shown (Ryle & Longair, 1967; Longair & Riley, 1979) that the flux density ratio can be expressed as (e.g. Arshakian & Longair, 2004)
where α is the spectral index (Sν ≈ ν−α), while n is a factor that defines the assumed flow model: n = 2 for a continuous beam model, while n = 3 if the radiating plasma consists of blobs. Radio emission from the core is characterized by flat spectra (0 ≤ α < 0.5), while radio lobe emission has steep spectra (α ≥ 0.5).
Equation (2) corresponds to the ratio (τ) between the ages of the receding-and-approaching lobes given (e.g. Gopal-Krishna and Wiita, 2004; Onuchukwu et al. 2014) by:
However, relativistic beaming is fundamentally characterized by a Doppler enhancement factor: δ = [γ (1 − β cos ϕ)]−1, where γ = 1 − β 2 −1/2. Hence, the observed radio flux (S0) depends strongly on the viewing angle (ϕ) and can be expressed in terms of the intrinsic value (Si) as S0 = Siδn+α. Thus, in general it can be deduced from equations (1) and (2) that F and Q have some form of jet model-dependent relationship, which can be expressed in logarithmic scales as
It is obvious from equation (4) that for any assumed jet model the slope of log F − log Q data takes on a range of positive values (n + α > 0) depending on the assumed value of α. Thus, a positive correlation between F and Q is envisaged in asymmetric radio source samples, if the observed asymmetries arise due to relativistic beaming effect at small orientation angles. Apparently, the measurement of both Q and F is expected to be world model-dependent due to the tight dependence of radio size (D) and luminosity (P ) on the assumed world model. In the Friedmann-Robertson-Walker universe, D and P respectively depend on luminosity distance (dL) as (Ubachukwu 1998b)
and
In the current inflationary cosmology
where Ωm and ΩΛ are, respectively, the contributions of baryonic matter and cosmological constant to the energy content of the expanding universe.
Similarly, the orientation effect in AGNs posits that the projected linear size (D) depends on the viewing angle as
where D0 is the intrinsic linear size.
Consequently, in a continuous jet model, the ratio R of the beamed flux of the core to the unbeamed flux of the lobe can be expressed in terms of its value at transverse alignment (RT ) in a general form (e.g. Hough & Readhead, 1987; Fan & Zhang, 2003)
Analysis of equations (1) and (9) shows that if the relativistic beaming effect accounts for the observed asymmetries in GRSs, a clear correlation is also expected between R and Q in asymmetric sources, whose radio axes are supposedly aligned close to the line of sight. In particular, the most asymmetric sources are expected to be the most beamed sources.
Thus, the relativistic beaming model for asymmetries postulates that radio sources inclined at small angles to the line of sight should have brighter radio cores and foreshortened projected linear sizes (Orr & Browne 1982; Ubachukwu 2002), which should result in a strong R − D anti-correlation, with a consequent R − Q correlation. The anti-correlation is expected to yield an upper envelope function, where the relativistic beaming effect is expected to dominate, and which should provide the best fit to the observed R − D data of source samples (e.g. Ubachukwu and Chukwude, 2002). In fact, Odo et al. (2015) have shown that for this optimum beaming, equation (9) can simplify to
where, Rmax corresponds to the upper envelope R − D function, which is expected to occur within a critical cone angle ϕc. Within the critical cone angle, the Doppler factor δ is fairly constant which yields (e.g. Ubachukwu and Chukwude, 2002):
3. DENSITY VARIATION MODEL FOR ASYMMETRIC SOURCES
According to the beam model of Scheuer (1974), energy is continuously supplied to the lobes through beams of relativistic plasma. The beams plough their way through first the ambient interstellar medium (ISM) of the parent object, and then through the much hotter intergalactic medium (IGM) until the ram pressure of the IGM finally stops them. Studies of the environments of active galaxies and quasars have revealed that these sources are located in relatively dense environments and of-ten show signs of interaction (e.g. Yee and Green 1987, Yates et al. 1989, Hutchings and Neff 1990, Ramos Almeida et al. 2013, Orsiet al. 2016).
Swarup and Banhatti (1981) proposed a model to account for the observed distributions of the flux density and separation ratios of the two components in the Ooty occultation and 3CR samples, based on the density variation of the IGM into which the beams propagate. This implies that there is an active beam in the receding lobe but due to less interaction with the IGM, its intrinsic emissivity is much lower than that of the approaching lobe. The observed asymmetry in Q would result if the two components were located in dense matter of different density profiles.
According to Swarup and Banhatti (1981), the ratio of the two components of a radio source can be given in terms of the beam power L and ambient density ρ, and can be equivalently written in terms of approaching (app) and receding (rec) lobes as
and
Equations (12) and (13) above suggest that in the density variation model there should be some form of F − Q relation. In fact, for constant beam power, we can deduce a functional F −Q relation of asymmetric radio sources in the form
4. DESCRIPTION OF SOURCE SAMPLE
The present analysis is based on the sample of 1045 edge brightened double radio sources drawn from a large database contained in Tables 1 and 2 of Nilsson (1998). Sources with information on separation ratio (Q), flux density ratio (F ), linear size (D), core-dominance parameter (R) and redshift (z) were selected and updated with the recently updated 3CRR sample (Singal 2014). 555 objects in the sample have information on Q, out of which 468 objects show asymmetric structure with Q > 1. Analysis of Q-values of the 468 asymmetric objects yields a mean value Qm ≈ 1.59 ± 0.05. Since the present investigation is concerned with highly asymmetric objects with Q >> 1, we adopt the lower limit of the mean Q-value (Qm ≈ 1.5) as the dividing line between highly asymmetric (Q > Qm) and less asymmetric (Q ≤ Qm) sources. There are 153 highly asymmetric objects (Q > 1.5). It is found that 25 objects in the sample have signatures of compact steep spectrum (CSS) sources with D ≤ 15 kpc (Peacock and Wall 1982; Ezeugo and Ubachukwu 2010). Since the CSS sources are believed to form a distinct class of EGRSs, we excluded these CSS sources from the current analysis, leaving only 128 objects. These 128 objects, representing ≈ 27% of the asymmetric objects form our sample for current investigation.
TABLE 1 MEDIAN VALUES OF ASYMMETRIC PARAMETERS FOR LOW AND HIGH REDSHIFT
| z | F med | Q med | D med | R med |
|---|---|---|---|---|
| z > 1 | 2.36 ± 0.92 | 2.71 ± 2.32 | 89.70 ± 30.04 | 0.21 ± 0.12 |
| z ≤ 1 | 0.79 ± 0.03 | 1.72 ± 0.02 | 101.90 ± 32.99 | 0.38 ± 0.09 |
Throughout the paper, we have adopted the modern concordance (ΛCDM) cosmology with H0 =km s−1Mpc−1 and Ω0 = Ωm + ΩΛ = 1; (Ωm =3; ΩΛ = 0.7). All relevant data are adjusted in line with this concordance cosmology. For the analyses in this paper the degree of relationship between source parameters is deduced by the Pearson Product Moment correlation coefficient (r) using the AXUM analytical software.
5. ANALYSES AND RESULTS
In § 2, we presented the implications of two models that appear to explain the observed asymmetries in EGRSs. Each of these models makes specific pre-dictions, which can be tested using well-defined samples of radio sources.
5.1. F − Q Correlations
In Figure 1 we show the scatter plots of flux density ratio (F ) as a function of separation ratio (Q), on logarithmic scales, for the whole sample and two subsamples of highly asymmetric objects. Since we are considering the lobe emission, which is characterized by steep spectra, we have assumed n = 3 and α = 0.8 for the F -data (e.g. Nilsson 1998). From the plot in Figure 1(a) of the 128 highly asymmetric objects, it is observed that F increases with Q over all values of Q. However, there is a steep change in slope of the F − Q at F ≈ 1 (shown with a broken line) which corresponds to Q ≈ 1.7. Linear regression analysis of the F − Q data yields log F = −(0.81 ± 0.03) + (2.50 ± 0.08) log Q, with a tight positive correlation r ≈ 0.9. The change in slope of the F − Q data around F = 1, shown with a dotted line in Figure 1(a) , suggests that the underlying physics in the two panels may not be the same for the highly asymmetric sources. Perhaps, the truncation in Figure 1(a) at F = 1 can be used as the dividing line between the RBM (F > 1) and DVM (F < 1) models outlined in § 2. Thus, in subsequent analyses, for purposes of comparison of effects of the two asymmetry models, the RBM and DVM, we have divided the sample into two subsamples in line with the two slopes indicating that the physics in the two planes is not the same: one with Q > 1.5 and F > 1, which we call the RBM subsample be-cause their properties fit into the relativistic beaming model. On the other hand, because the sample used defines Q > 1, we assume that all sources with Q > 1.5 and F < 1 should correspond to the DVM. There are 79 objects in the RBM sub-sample and 49 objects in the DVM sub-sample.
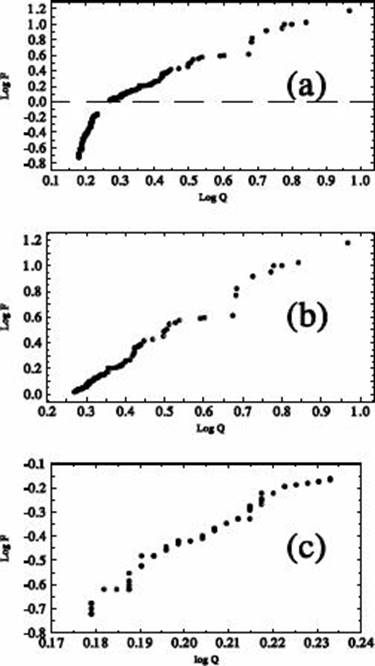
Fig. 1 Scatter plot of log F against log Q for 128 highly asymmetric objects (a); 79 RBM objects (b); 49 DVM objects (c).
The plot in Figure 1(b) for the RBM subsample shows a tight correlation between F and Q in which more highly asymmetric sources tend to have higher flux ratio as expected in the relativistic beaming model of asymmetries (c.f. equation 3). Lin-ear regression analysis of the F − Q data yields log F = −(0.47 ± 0.01) + (1.82 ± 0.03) log Q with a near perfect correlation coefficient, r ≈ 0.99, at 95% confidence. Similarly, the F − Q plot in Figure 3(c) for the DVM subsample yields log F = −(2.48±0.06)+(10.19±0.28) log Q, with a tight positive correlation r ≈ 0.98 at 95% confidence, which is hard to understand in terms of the density variation of ambient medium that predicts an inverse F − Q relation (c.f. equation 11).
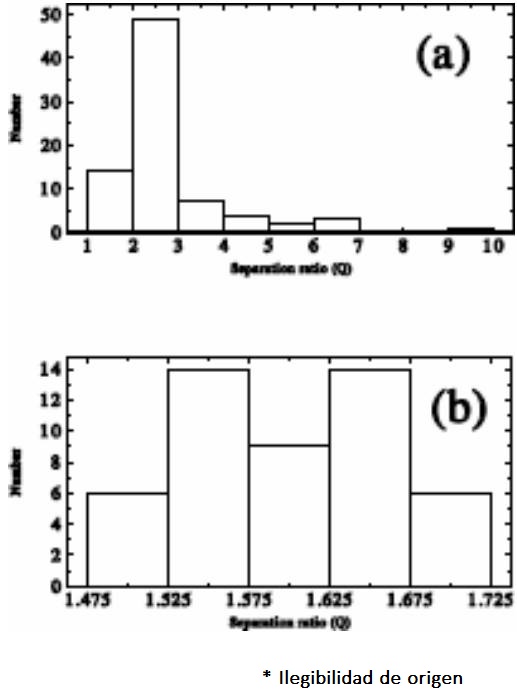
Fig. 2 Distribution of the 128 highly asymmetric sources in Q, with RBM sources (a) and DVM objects (b).
5.2. F and Q Distributions
The distribution of the separation ratios (Q) of the 128 highly asymmetric objects is shown in Figure 2. The distribution gives mean values of 2.76 ± 0.15 and 1.60 ± 0.01 respectively for the RBM and DVM subsamples. An obvious feature of the plot is the wide difference in range of Q-data for the RBM and DVM sub-samples, with that of RBM being much wider than DVM, perhaps due to the beaming effect. Furthermore, while the distribution in (a) is somewhat unitary, with a long asymmetric tail, that in (b) appears to be bimodal. This again seems to suggest that the mechanisms that produce the observed structural symmetries in the two sub-samples are different. However, a two sample K-S test on the Q-data of the samples yields a chance probability p = 0.37. Thus, there is no statistically significant difference between the underlying distributions of RBM and DVM objects in Q. We interpret this to mean that relativistic beaming and density variation effects play comparable roles in determining the structural asymmetries of the whole sample. The asymmetric tail in Figure 2(a) is a signature of two sources, namely, (2359 - 690) and (2359 - 691), which are actually among the unidentified objects in the sample. Nevertheless, their exclusion in the analysis does not change our results significantly.
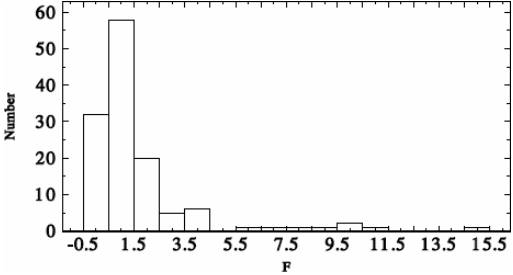
The histogram distribution of the sample in flux density ratio (F ) is shown in Figure 3. The distribution is apparently unitary, with a mean value of 1.72 ± 0.20. We observe that 49 objects representing 38% of the asymmetric sources are consistent with the density variation model, while the other 79 objects ≈ 62% are consistent with relativistic beaming model and are difficult to understand in terms of the density variation of the ambient medium.
Thus, in general, it could be argued from the distributions of Q and F that relativistic beaming and density variation in ambient medium have comparable effects in determining the structural asymmetries of the sample. A unified model would therefore be required to account for all the observed features of the Q and F distributions of the asymmetric sources. This is taken up in a follow-up paper (Alhassan et al. in preparation).
5.3. R − D Relation
To investigate the effects of relativistic beaming in the current sample, the core-to-lobe luminosity ratio (R) is plotted as a function of projected linear size (D) for the RBM sub sample of highly asymmetric sources in Figure 4. There appears to be a general R − D trend suggestive that larger sources are less beamed. However, the presence of an outlier (2347+30) among the RBM objects (enclosed in a circle in Figure 4(a)) is significant and seems to distort the general trend. The observed radio properties of this object (e.g. Nilsson et al. 1993) suggest that it is a weak FR II radio galaxy, for which relativistic beaming can be considered less important. Thus, we exclude the object from further analyses of the RBM sample. One-dimensional regression analysis of the data (without the outlier) yields log R = (0.910 ± 0.130) − (0.0002 ± 0.0001)D , with a correlation coefficient r ≈ −0.4. This result suggests that for the RBM objects there is a tendency for smaller sources to be beamed, compared to larger sources, as expected in the relativistic beaming scenario.
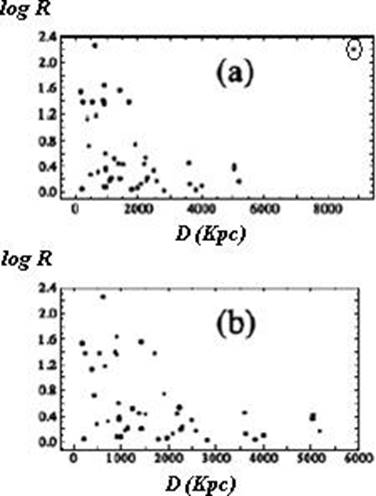
It is interesting to observe that removal of the outlier from the analysis reveals a well-defined up-per envelope, which corresponds to the extremely beamed sources in our sample, as shown in Figure 4(b) . Optimum beaming is expected to occur in the upper envelope function. We therefore carried out an analysis of the upper envelope function in four uniform bins of D, namely, D ≤ 1000; 1000 < D ≤ 2000; 2000 < D ≤ 3000 and D > 3000 kpc. The linear fit to the upper envelope data yields: log R = (2.441 ± 0.471) − (0.0007 ± 0.0002) with ≈ −0.9, which is consistent with Rmax ≈ 275. Thus, using RT = 0.0008, which appears to be consistent with low frequency (178 MHz) surveys such as considered here (e.g. Ubachukwu 1998; Alhassan et al. 2011), we obtain a bulk Lorentz factor γ = 7 with the radiation beamed into a cone angle of ϕc = 8◦ via equations (10) and (11) respectively, with n = 3 and average spectral index, α = 0.75.
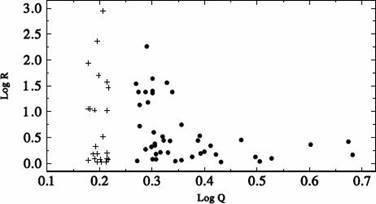
5.4. R − Q Relation
To check the consistency of our results on the effects of relativistic beaming and orientation in the current sample, the core-to-lobe luminosity ratio (R) is plotted as a function of angular separation ratio (Q) for the two sub samples of highly asymmetric sources in Figure 5. Linear regression of the data yields log R = (1.38±0.30)−(0.81±0.85) log Q, with a correlation coefficient r ≈ −0.4, for the RBM sub-sample and log R = (1.35±2.83)−(2.85±14.16) log Q with r ≈ −0.04, for the DVM subsample. The DVM subsample shows no R−Q correlation as expected in the DVM model while the RBM subsample suggests a marginally significant R −Q correlation, but in the sense opposite to that expected of the RBM model.
5.5. Effects of Redshift (z)
A redshift-dependent density variation of asymmetric sources of the form ρ ≈ (1 + z)3 has been predicted to explain the variation of intergalactic medium (IGM) of extragalactic radio sources. This is expected to yield more asymmetric sources at an earlier epoch, implying that smaller sources should be more asymmetric than larger sources (Gaibler and Krause, 2011).
We tested the consistency of this effect on the present sample of highly asymmetric sources. Thus, we divided the sample into low and high z (z ≤ 1 and z > 1) respectively and compared the median value data of flux density ratio, separation ratio, linear size and core-dominance parameter at the two-redshift regimes for consistency. The results are consistent with the prediction that smaller sources are located at higher redshifts and tend to be more asymmetric, with higher values of the asymmetry parameters F and Q than larger sources. A summary of the results is presented in Table 1.
6. DISCUSSION AND CONCLUSION
We have investigated the effects of relativistic beaming and density variations to account for the observed structural asymmetries of highly asymmetric radio sources. Our results suggest that neither the relativistic beaming nor the density variation model alone is adequate to account for all the observed features in terms of the distributions of the angular separation ratio Q and flux density ratio F of the present sample. The results, however, show that the relativistic beaming model and the density variation model have somewhat comparable effects on the evolution of double radio sources.
A major result of the current investigation is the similarity in trends and strength of correlation be-tween the flux ratio and separation ratio of the sample. While the RBM sample in this sense can be explained fully in terms of relativistic beaming effect, the DVM sample is yet to be understood in terms of an underlying density variation hypothesis (Onuchukwu and Ubachukwu, 2015). Although the F − Q trend in the DVM sample is consistent with the opinion that the radio source flux density ratio is sensitive to structural asymmetry (Gaibler and Krause, 2011), it appears not to be consistent with the F − Q anti-correlation expected in the density variation model (Swarup and Banhatti 1981). Figure 3 thus appears to be more consistent with the RBM hypothesis, which predicts a positive correlation between F and Q. The density variation model predicts an inverse correlation between F and Q which is not observed here. If we assume that there is no intrinsic variation in L, then a density variation of about six orders of magnitude would be required to explain the largest F values in the present sample.
Gopal-Krishna and Wiita (1991) have shown that the beam efficiency depends on the density through which the relativistic beams propagate. In other words, L is not expected to be constant but to decrease with an increase in density. It should therefore be expected that ρapp > ρrec; Lapp < Lrec so that small Q values do not necessarily imply large F values. This could explain the observed F − Q correlation for the DVM contrary to expectation.
The results obtained from the RBM are consistent with Onuchukwu et al. (2014), which argued that the observed asymmetries in radio sources are a result of Doppler boosting or orientation effects. The apparent lack of correlation between R (the beaming indicator) and Q (the asymmetry parameter) in the DVM subsample does not seem to suggest that relativistic beaming accounts for all observed structural asymmetries of the sample. The result appears to be in agreement with some previous results (e.g. Onah et al. 2014; Onuchukwu et al 2014) that argued for both intrinsic and environmental effects (in addition to relativistic beaming) to account for the observed asymmetries in powerful radio sources. In fact, Kharb et al. (2008) suggested that Q appears to be more sensitive to intrinsic and environmental asymmetries than to the relativistic beaming effect for a sample of FR II radio galaxies. Perhaps the strong dependence of Q on intrinsic/environmental effects has given rise to the apparent lack of R − Q correlation in the DVM subsample analysis.
We have also shown that smaller sources located at higher redshifts are associated with asymmetries higher than those of larger sources located at lower redshifts. Perhaps it could be argued that the strong positive correlation between F and Q obtained for both RBM and DVM samples is a result of the red-shift effect on the samples. Thus, we tested the dependence of the source asymmetry parameters on redshift by looking for any correlation between the parameters and redshift for both the high redshift (z > 1) and low redshift (z ≤ 1) sources. The result yields r > 0.8 as the correlation coefficient for the Q − z and F − z relations at all redshifts. This actually shows that the redshift effect is significant in these parameters. However, we eliminated the redshift effect by subtracting out the common dependence of Q and F on redshift from the F − Q correlation using the Spearman partial correlation statistic, which is a non-parametric statistic involving cross-correlation of the parameters, and is given in general by (e.g. Ubachukwu et al. 2002)
This tests whether there is a significant correlation between two quantities 1, 2 (F, Q) that does not result from both being separately correlated with a third quantity 3 (z). This implies that a correlation between the first two parameters is kept constant. This statistic varies from −1 (for a perfect inverse correlation) to +1 (for a perfect positive correlation) with 0 representing null correlation. The results of the non-parametric analysis at 95% confidence give rQF,z > 0.9 at all redshift regimes. Thus, we argue in this paper that the F − Q correlations observed in the two model subsamples are independent of cosmological effects. The tight correlations may therefore be intrinsic, rather than an artifact of redshift in the present sample of highly asymmetric radio sources.

