




 nueva página del texto (beta)
 Inglés (pdf)
 Artículo en XML
 Referencias del artículo

 Traducción automática
 Enviar artículo por email
 Citado por SciELO
 Similares en
SciELO

 Permalink

INTRODUCTION
Influenza A virus (IAV), a class of invasive pathogens that cause periodic pandemics around the world, can cause acute respiratory infections in humans and animals, and poses a threat to human public health protection due to its potentially high morbidity and mortality1,2. IAV is divided into different subtypes based on the surface viral glycoproteins hemagglutinin and neuraminidase, of which the H1N1 subtype was first identified in 2009 causing an initial outbreak in Mexico that spread all over the world3.
Viral infectious diseases in the respiratory tract have great impacts on public health. A previous study reported that a few patients who are more sensitive to these viruses will develop acute respiratory distress syndrome (ARDS) and even death4. The immune system is the frontier line to resist the invasion of the virus5. Complex interactions between viruses and host immune responses lead to the various outcomes of the infection. A protective immune response is required for viral clearance and resolution of the infection6. A detrimental reaction will lead to a cytokine storm, which is the crucial contributor to the development of ARDS7. Cytokines are produced by several immune cells, including the innate macrophages, dendritic cells, natural killer cells, and the adaptive T and B lymphocytes8. Immune cells are responsible for resisting the invasion of these pathogens, and an aberrant or exaggerated activation of these cells will increase the circulating levels of different pro-inflammatory cytokines including interleukin (IL)-6, IL-1, tumor necrosis factor-alpha, and interferon (IFN), which will lead to a cytokine storm9. Of note, severe infection with influenza viruses further trigger deaths associated with cytokine storms10.
The role of long non-coding RNAs (lncRNAs) in cytokine storm modulation has been reported11. LncRNAs are associated with inflammatory responses mediated by IL-6 and NLRP3 inflammasomes11,12. In addition, lncRNAs have been reported to be involved in the MAPK cascade, and over-activation of MAPK signaling can trigger cytokine storms13,14. p38 MAPK and nuclear factor κ-light-chain-enhancer of activated B cells (NF-κB) were able to induce IL-6 and NLRP3 release in a dependent manner15,16. One study identified and characterized lncRNAs involved in H1N1 virus replication, among which lncRNA PSMB8-AS1 may be a novel host factor target for the development of antiviral therapies for influenza virus infection17. However, so far, the lncRNA expression profile of H1N1 infection has not been well described.
Here, to characterize the transcriptional signatures during H1N1 progression for discovery diagnosis or treatment, RNA sequencing was used for transcriptome analysis in patients with mild and severe H1N1 infection. We found that different degrees of H1N1 infection were able to affect gene transcription, including coding RNAs and non-coding RNAs. Function enrichment analysis found that the pro-inflammatory signaling pathways, like response to virus, MAPK signaling pathway, were significantly activated. In short, this work provides new views for understanding the course of influenza H1N1 infection.
METHODS
Patients
Peripheral venous blood samples were collected from 16 outpatients with influenza H1N1 infection from November 2009 to January 2010 at the First Affiliated Hospital, College of Medicine, Zhejiang University. H1N1 influenza virus nucleic acid was tested positive in pharyngeal swab specimens of all patients. According to thebprotocol for the diagnosis and treatment of influenza A (H1N1) published in 2009, 8 outpatients were diagnosed as mild patients (listed as L) and other outpatients were diagnosed as severe patients (listed as S). The clinical data of these H1N1 patients were recorded. Severe disease was defined with at least one of the following conditions18: (1) persistent high fever longer than 3 days; (2) severe cough, cough with purulent sputum, blood sputum, or chest pain; (3) rapid respiratory rate, dyspnea, cyanosis of the lips; (4) mental changes: unresponsiveness, lethargy, agitation, convulsions, etc.; (5) severe vomiting, diarrhea, dehydration; (6) pulmonary imaging in chest radiograph or lung computerized tomography (CT); and (7) rapid increase of creatine kinase (CK), creatine kinase isoenzyme (CKMB), and other myocardial enzymes. Mild disease was defined as patients with mild clinical symptoms but not reaching the definition of severe disease. Patients with one of the following conditions were excluded in our research: (1) patients with other viral infectious diseases such as hepatitis B, and (2) patients with immune diseases or chronic infectious diseases or patients receiving immunomodulator therapy.
The study was approved by the Ethics Committee of the First Affiliated Hospital, College of Medicine, Zhejiang University, and registered at the Chinese Clinical Trial Registry. Moreover, we declare that all patients gave their informed consent and consent to our experiments for the purpose of scientific exploration.
The workflow of RNA-seq
Peripheral venous blood was collected from all anticipants using BD PAXgene blood RNA tubes. Venous blood samples were separated by centrifugation at 3000 rpm for 7 min at room temperature after standard diagnostic tests. Whole blood cells were stored at −80°C. Total RNA was extracted using the TRIzol reagent (Invitrogen, USA) according to the manufacturer's protocol. The quantity and quality of total RNA were assessed using a NanoDrop 2000 Spectrophotometer (Thermo Fisher Scientific, USA) and Agilent 2100 bioanalyzer (Agilent Technologies, USA). Of note, the sequencing library adopts a chain-specific library construction method to ensure that lncRNA transcripts can be obtained. Next, the libraries were sequenced on an Illumina HiSeq 4000 platform at Sangon Biotech Co., Ltd. (Shanghai, China).
Quality control and mapping to genome
First, FastQC (v0.11.8) was used to evaluate the quality of the raw data19. Then, Trimmomatic (v0.36) was used to remove sequences with N bases, adapter sequences, and low-quality bases (Q value < 20)20. The remaining high-quality reads were mapped to the reference genome using HISAT2 (v2.1.0)21. Finally, RSeQC (v3.0.1) was used to generate the gene expression matrix22.
Identification of lncRNAs
Candidate lncRNAs were preliminarily obtained according to the following conditions23: (1) the number of exons ≥ 2; (2) length > 200 bp; and (3) class code = "i, u, o, y, x". We further predicted the coding ability of the qualified transcripts using Coding-Non-Coding index (CNCI, v2.0), predictor of lncRNAs and messenger RNAs based on k-mer scheme (PLEK, v1.2), Pfam Scan (v1.6), and Coding Potential Calculator 2.0 (CPC2)24-26. Only transcripts marked as non-coding RNAs and non-coding proteins by the prediction software were retained and marked as lncRNAs.
Expression analysis
The expression level of each mRNA and lncRNAs was calculated according to the Transcripts Per Kilobase Million (TPM) method. The DESeq2 (R package, v1.26.0) was used to analyze differential expression of mRNA (DEGs) and lncRNAs (DElnGs)27. p < 0.05 and log2 fold-change > 0.5 were considered as significant.
Functional enrichment analysis
For DEGs and DElnGs, The Gene Ontology (GO) and Kyoto Encyclopedia of Genes and Genomes pathway analysis were performed to investigate the function of these genes by using ClusterProfiler (R package, v4.6.2)28. p < 0.05 was considered as significant.
RESULTS
Overview of this study
According to previous reports, the patient cohort in this study was classified into two groups based on disease severity: mild (L) and severe (S)18. In mild patients, common symptoms included sore throat (75%) and stuffy nose (87.5%). In addition, 4 patients experienced fever and fever < 2 days with a body temperature of < 38°C. In severe patients, all patients exhibited a body temperature ≥ 38.5°C for more than 3 days. Four severe patients (50%) with severe cough and one patient (12.5%) exhibited slight blood in sputum and three patients showed ground-glass opacity in lung CT. The symptoms in all patients were relieved within 7 days and none of them progressed to a critical stage (Table 1).
Table 1. Characteristics and clinical manifestations of mild and severe patients with influenza H1N1 infection
| Characteristic | Mild patients (n = 4) |
Severe patients (n = 4) |
|---|---|---|
| Age (year, mean ± SD) | 27.3 ± 2.5 | 29.4 ± 3.2 |
| Male (%) | 2 (50%) | 2 (50%) |
| Female (%) | 2 (50%) | 2 (50%) |
| Clinical manifestations | ||
| Fever | 4 (< 2 days) | 4 (more than 3 days) |
| Severe cough, cough with purulent sputum, blood sputum, or chest pain |
0 | 4 |
| Pulmonary imaging in chest radiograph or lung computerized tomography | 0 | 3 |
| Sore throat | 3 | 4 |
| Stuffy nose | 4 | 4 |
| Blood count, × 109/L, mean ± standard deviation | 4.15 ± 1.2 | 3.72 ± 1.4 |
| Lymphocyte | 1.74 ± 0.63 | 1.63 ± 0.71 |
RNA-seq analysis was conducted to investigate the transcriptomic signatures differentiating between the S and L groups. Initially, we observed the genes detected by sequencing in different samples, and found that 19,135 genes could be detected in all samples (Fig. 1A). Moreover, violin plots of gene expression demonstrated the stability of gene expression levels within groups (Fig. 1B). In addition, the Principal Component Analysis (PCA) plot conducted to visualize the significant difference between S and L groups, indicated distinct transcriptomic profiles between the two groups (Fig. 1C; PC1, 31% variance; PC2, 24% variance).
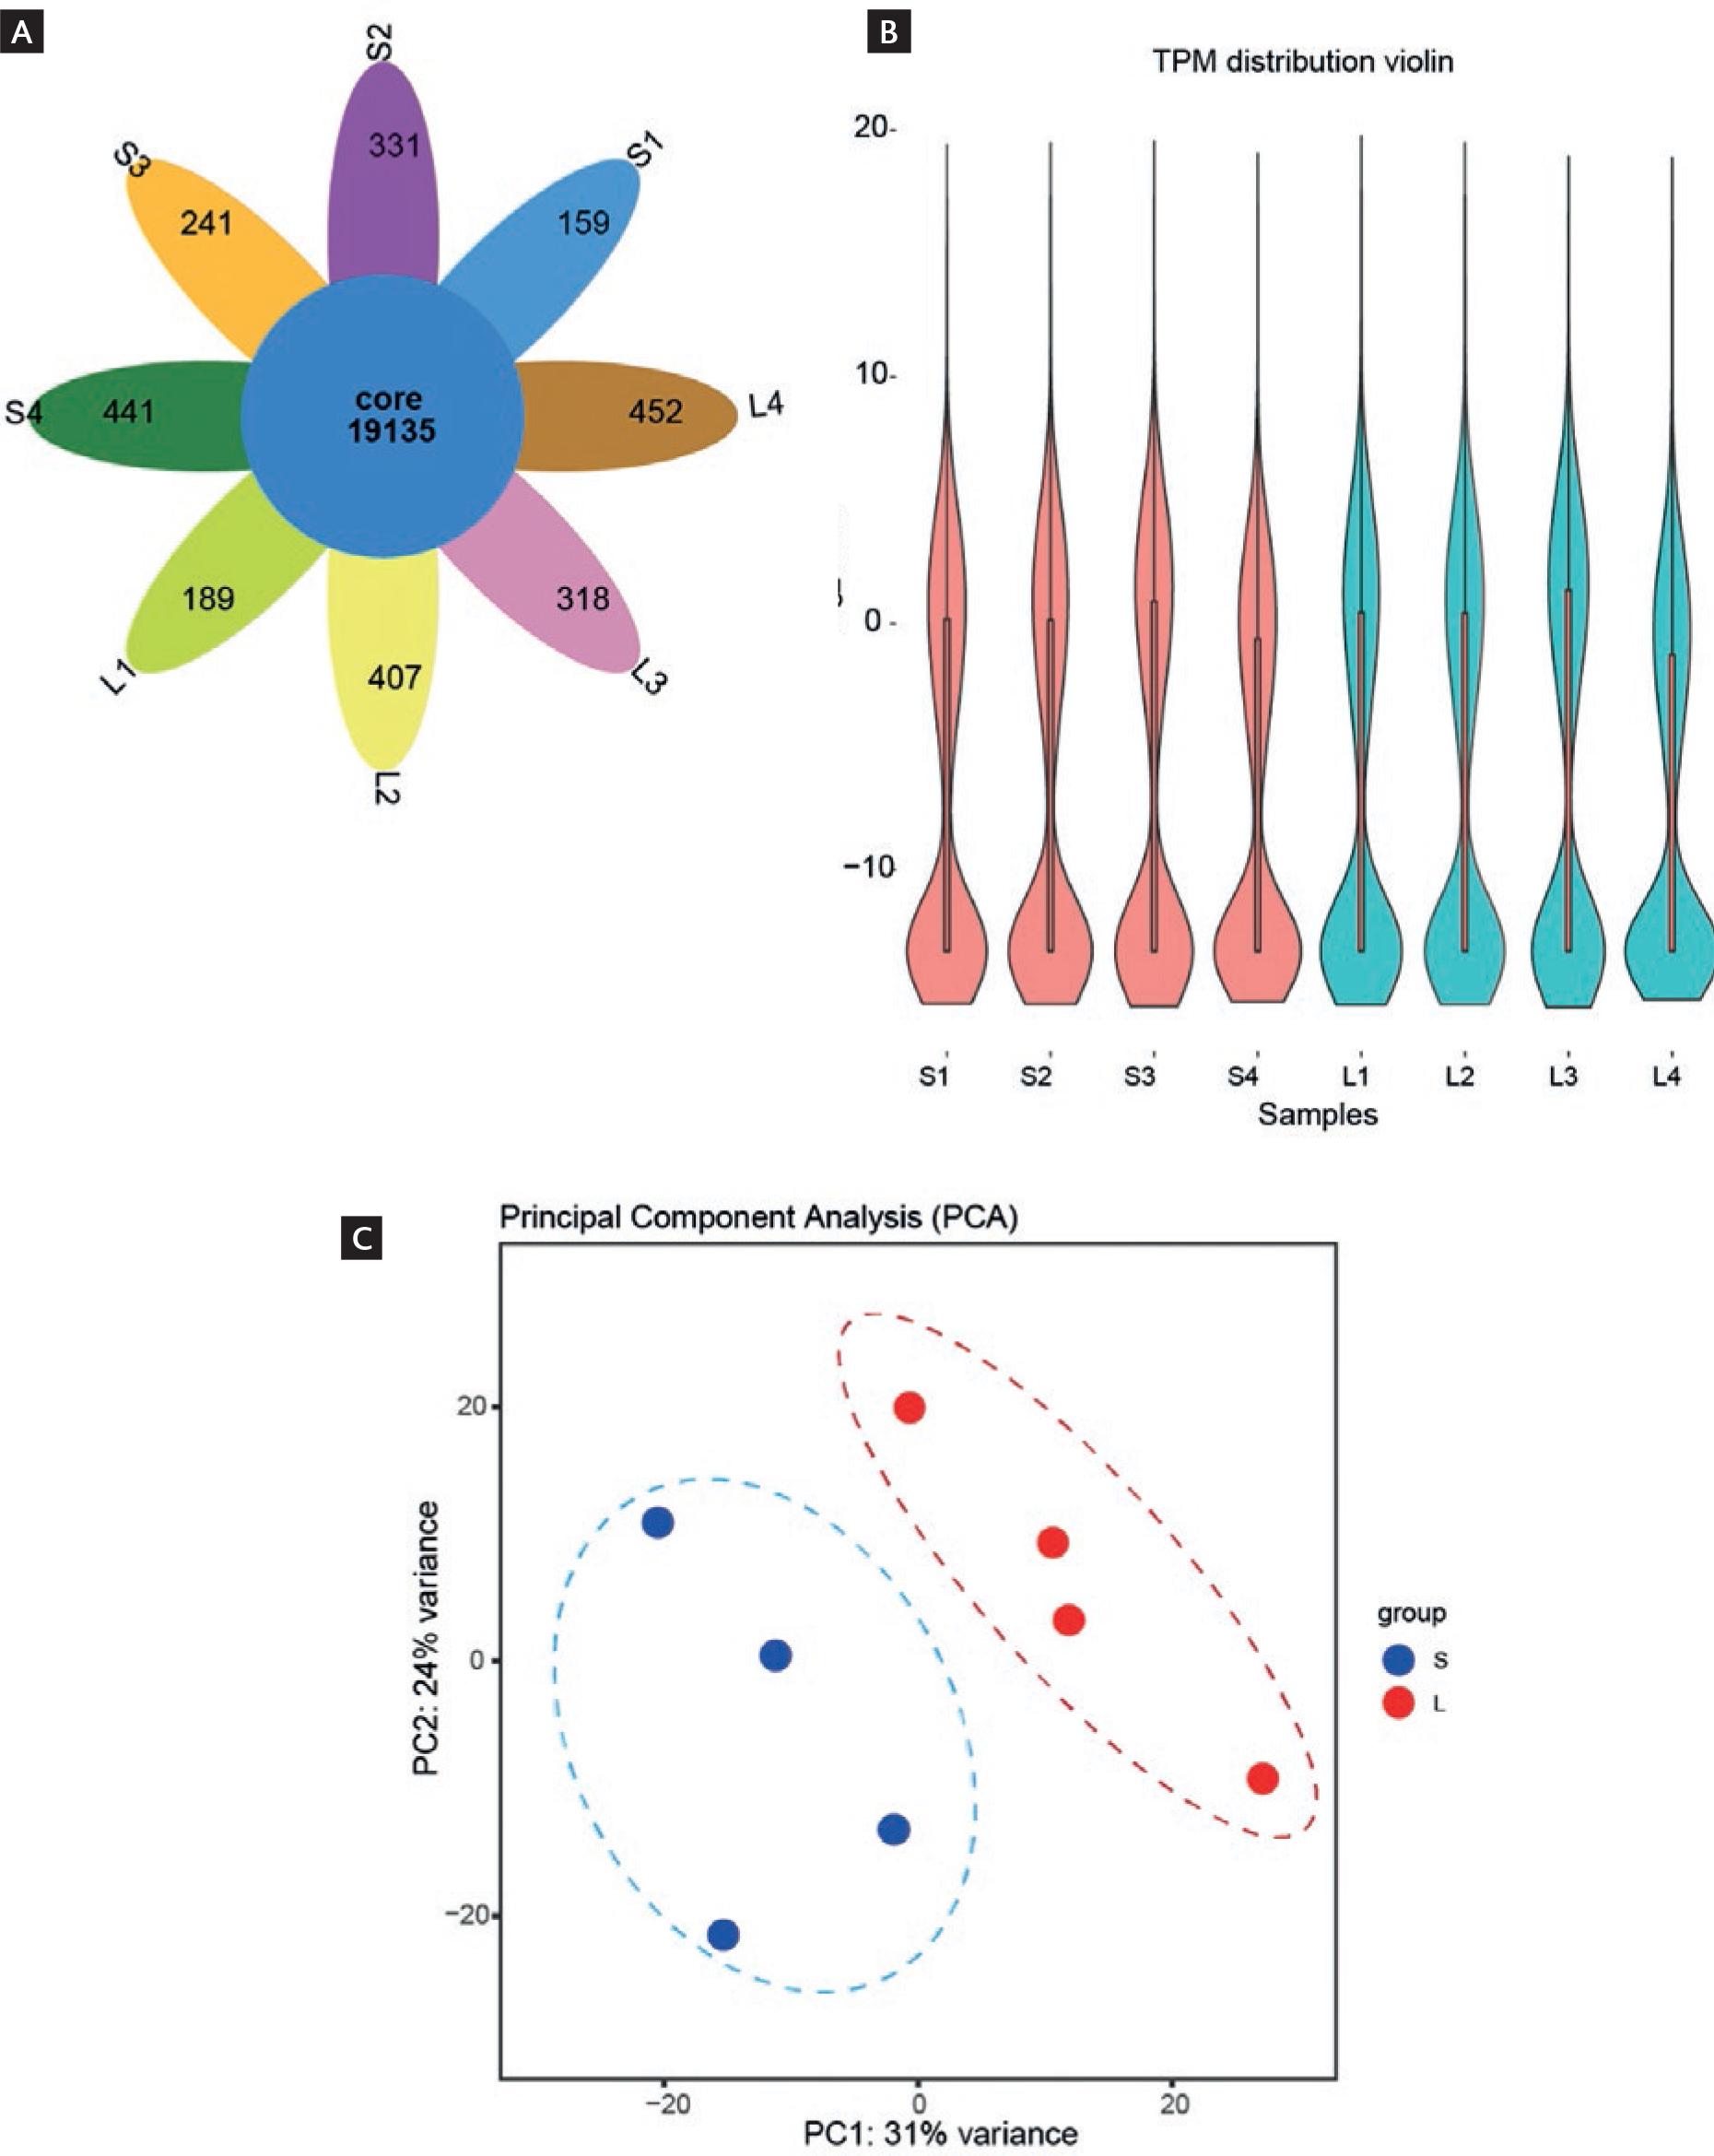
Figure 1. Overview of this study. A: petal Venn diagram showing genes detected in different samples. Each petal represents a sample group, and the overlapping areas indicate genes shared between groups. B: the violin plot shows the distribution density of gene expression in different samples. The width of the violin shape represents the density of data points at different expression levels. C: Principal Component Analysis plot showing the overall similarity and differences in gene expression patterns across all samples. The two main axes (Principal Component 1 and Principal Component 2) summarize the most significant variations in the data. Samples that are closer together have more similar gene expression profiles. S presents the severe patients and L presents mild patients.
Differential expression analysis of mRNA
To further explore the transcriptional characteristics of H1N1 during the infection process, we performed differential expression analysis. The volcano graph showed the differential genes between the S and the L groups. We found that a total of 1931 genes showed an up-regulation trend while 1216 genes were down-regulated (Fig. 2A). Furthermore, the heatmap showed four distinct regions and aided in the identification of gene signatures that could be indicative of disease severity or other biological characteristics (Fig. 2B).
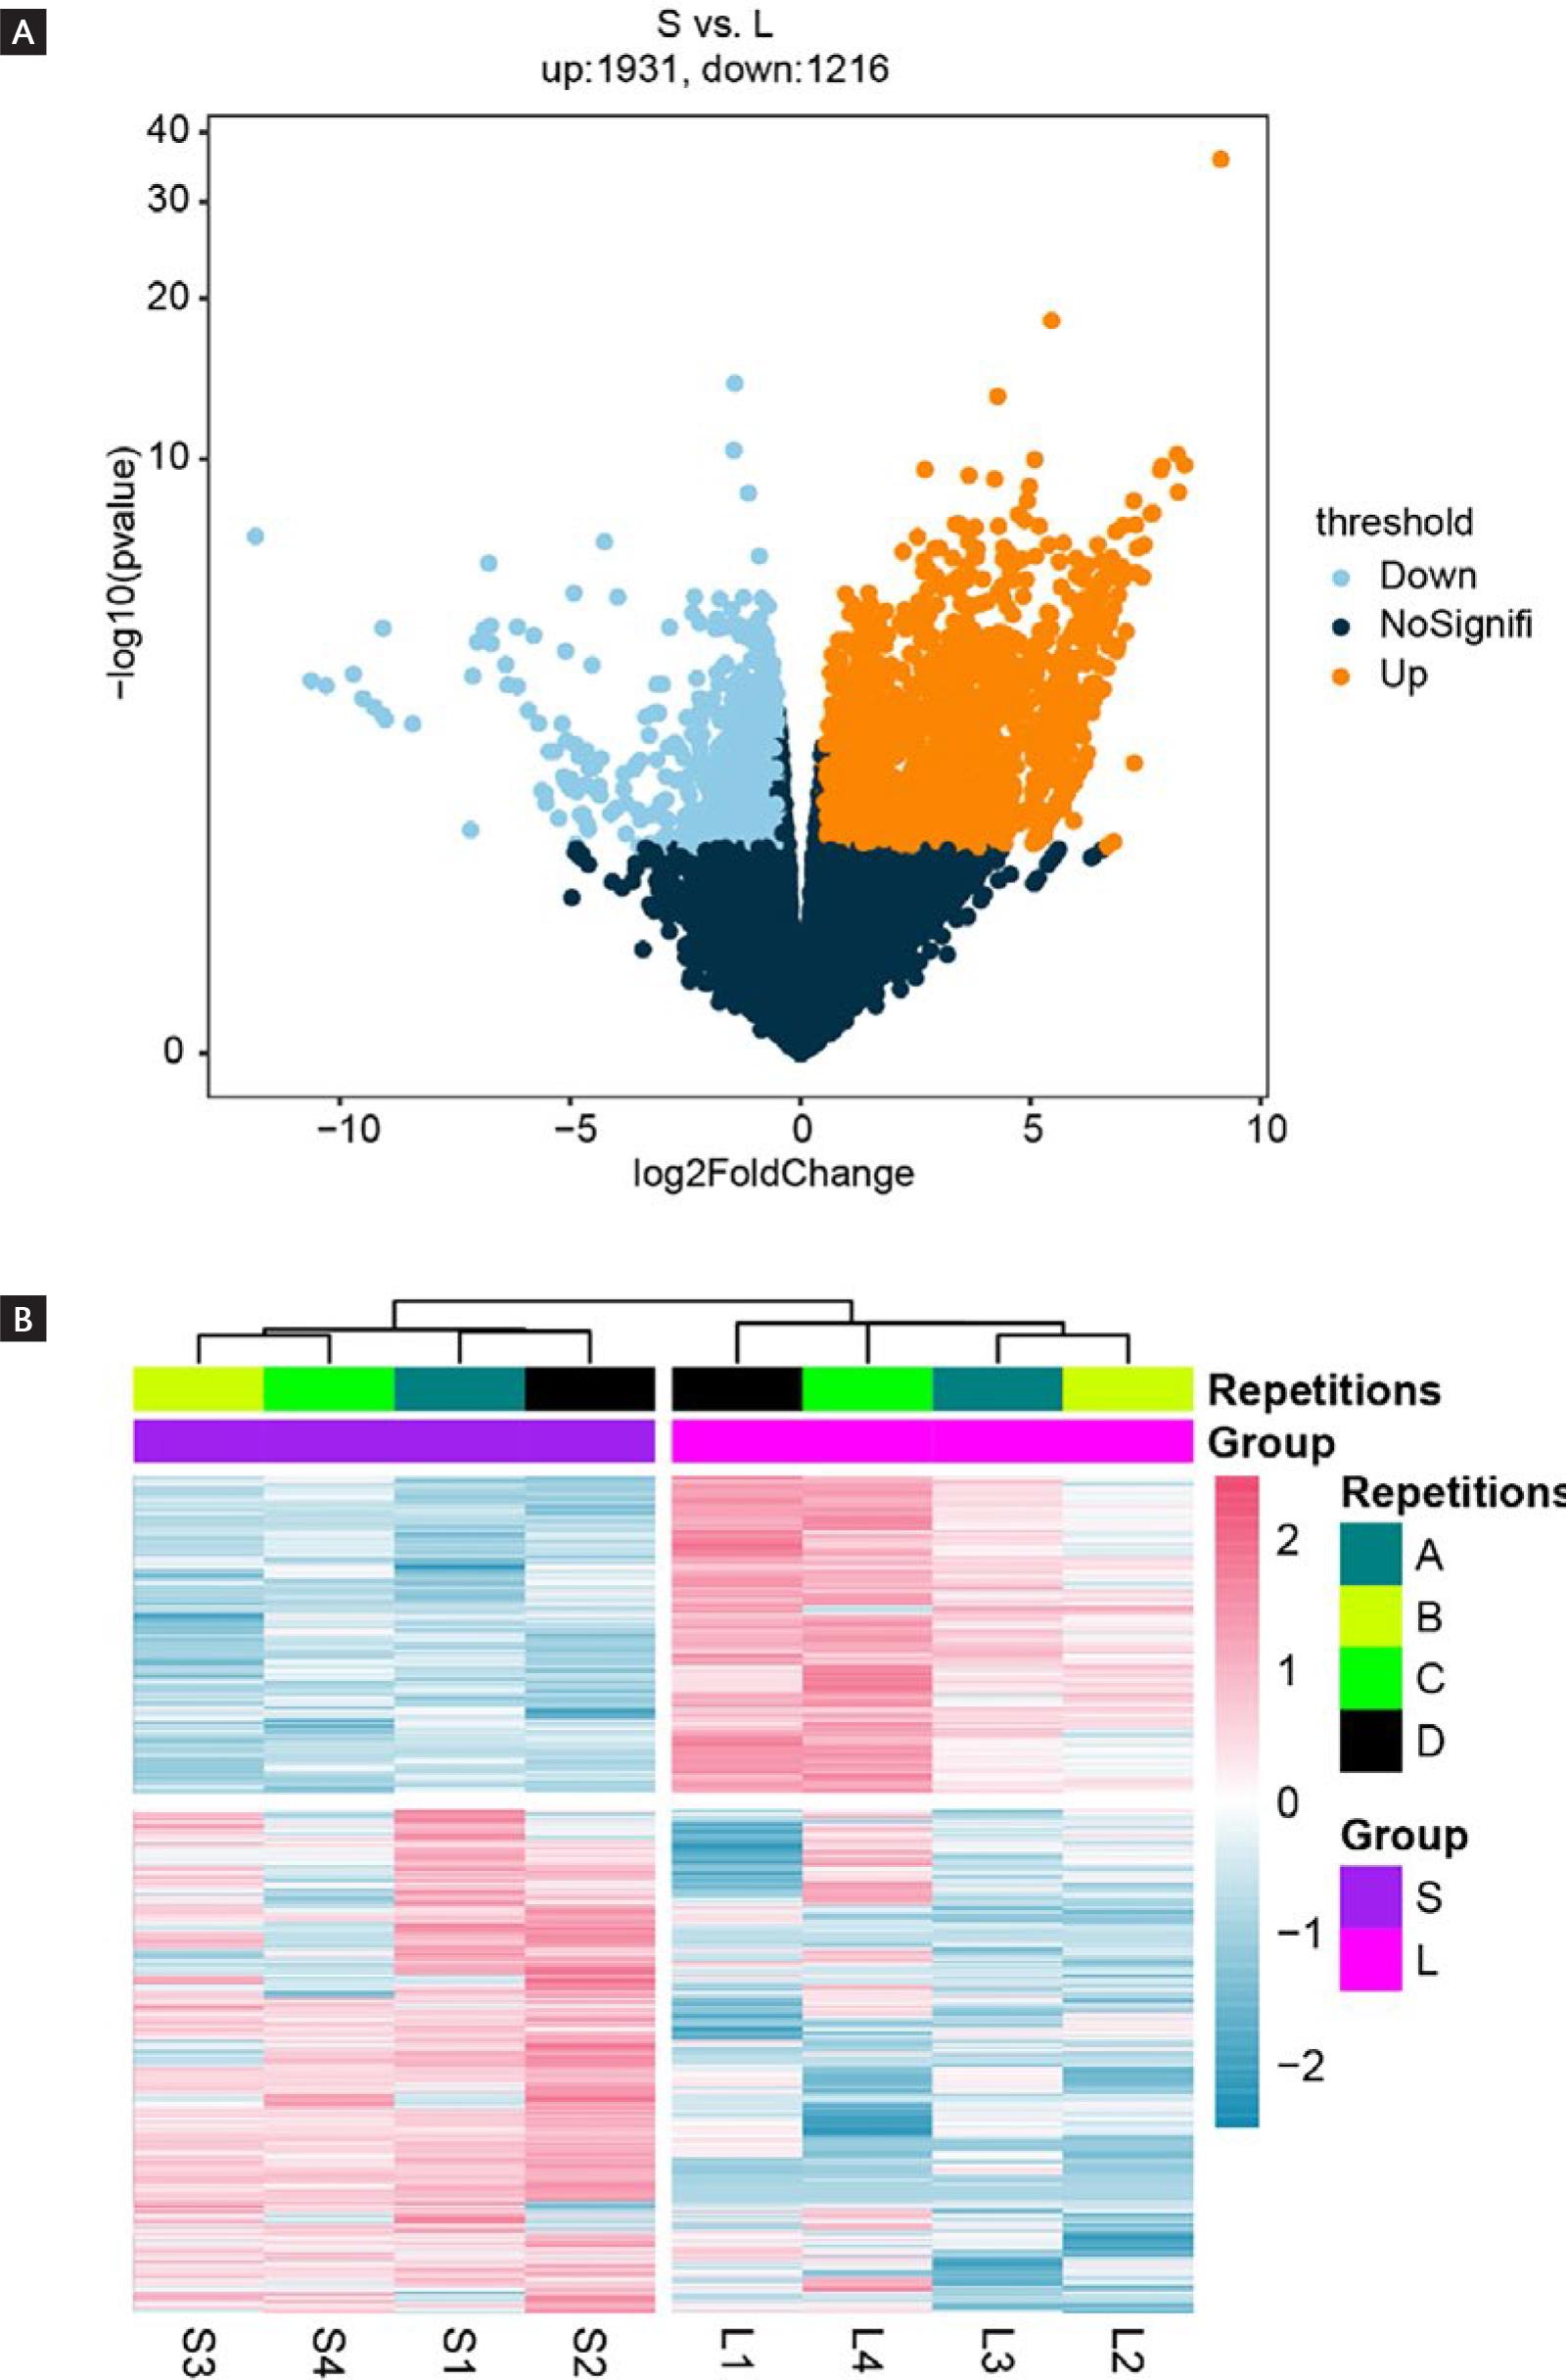
Figure 2. Identification of differentially expressed genes (DEGs). A: the volcano map shows the distribution characteristics of DEGs. The horizontal axis (log2FoldChange) shows the magnitude of expression change, while the vertical axis (-log10pvalue) indicates the statistical significance of these changes. Gold dots represent genes with increased expression (up-regulated), and sky-blue dots represent genes with decreased expression (down-regulated). B: heatmap showing the expression characteristics of DEGs in different groups. A, B, C, and D represent four distinct region of gene signatures.
The transcriptional functional characterization of up-regulated genes
Considering the comprehensive regulatory ability of genes in vivo, including synergistic interactions, antagonistic effects, and functional crosstalk, we performed functional enrichment analysis. First, the functions of up-regulated DEGs were explored. The cellular components analysis showed that the DEGs were involved in key cellular locales such as "ubiquitin ligase complex", "mitochondrial outer membrane", "nuclear ubiquitin ligase complex", and "GTPase complex" (Fig. 3A). The molecular function analysis highlighted the top 10 functional terms associated with the up-regulated DEGs, including "cytokine receptor binding", "single-stranded RNA binding", "regulatory RNA binding", "polynucleotide adenylyl transferase activity", and "lipase inhibitor activity" (Fig. 3B). Furthermore, the biological process analysis elucidated the functional relevance of the DEGs in processes, such as "response to virus", "defense response to virus", "DNA recombination", "cellular response to virus", and "NLS-bearing protein import into nucleus" (Fig. 3C). Moreover, the KEGG pathway analysis showed the participation of the up-regulated DEGs in critical pathways including the "RIG-I-like receptor signaling pathway", "PPAR signaling pathway", "cell cycle", "mitophagy-animal", and "TOLL-like receptor signaling pathway" (Fig. 3D).
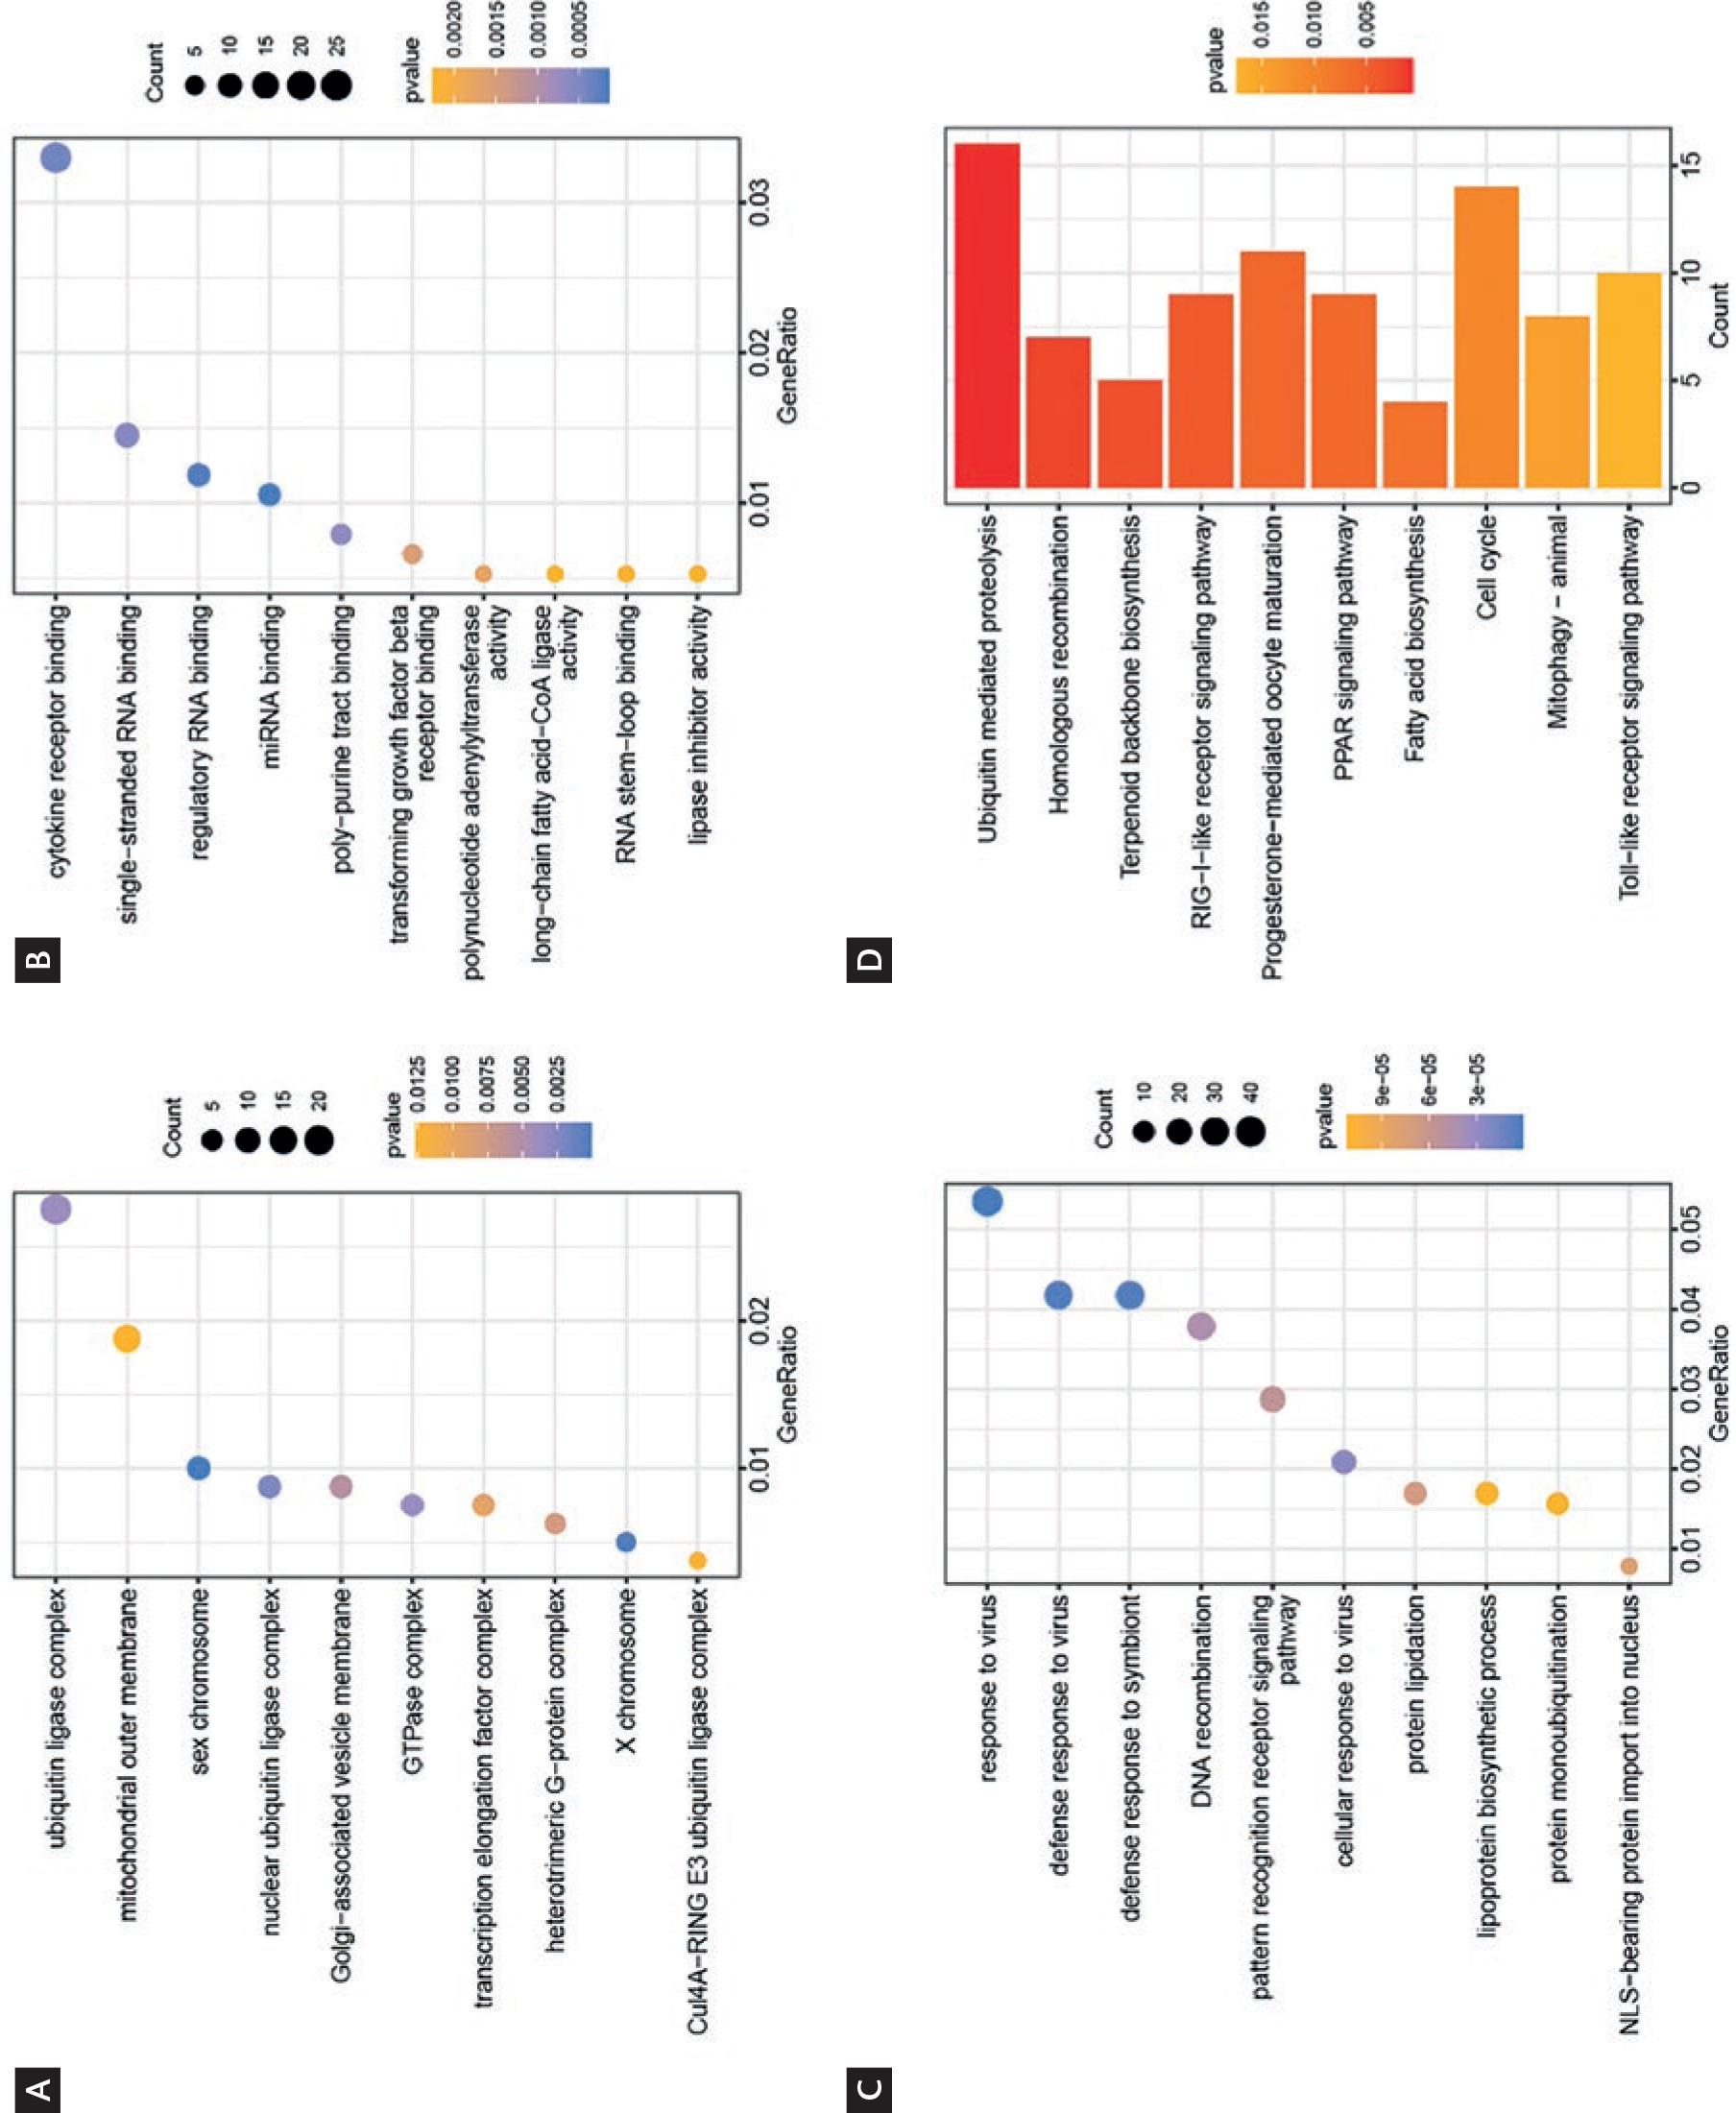
Figure 3. The function enrichment analysis of up-regulated DEGs. A-C: the top 10 Gene Ontology terms of up-regulated DEGs. A: cellular components; B: molecular function; C: biological process. Each point represents a specific molecular function, with its size indicating the number of genes involved and its color representing the statistical significance (p) of the association. D: the top 10 KEGG pathways of up-regulated DEGs. The horizontal axis shows the number of genes involved in each pathway, and the color represents the statistical significance (p) of the enrichment.
The transcriptional functional characterization of down-regulated genes
We explored the transcriptional functional characterization of down-regulated genes. At the cellular components level, our observations revealed enrichment in terms such as "ribosome", "ribosomal subunit", "focal adhesion", "polysome", and "polysomal ribosome" (Fig. 4A). Furthermore, at the molecular function level, we noted the presence of "structural constituent of ribosome", "transcription corepressor activity", "translation factor activity, RNA binding", "mRNA 5-UTR binding", and "translation elongation factor activity" (Fig. 4B). Moreover, our investigation at the biological process level uncovered enrichments in "cytoplasmic translation", "ncRNA processing", "ribosome biogenesis", "ribonucleoprotein complex subunit organization", "ribosome assembly", and "rRNA processing" (Fig. 4C). Finally, KEGG pathway analysis yielded significant associations with "ribosome", "biosynthesis of amino acids", "carbon metabolism", "RNA degradation", "Thermogenesis", and "GnRH signaling pathway" (Fig. 4D).
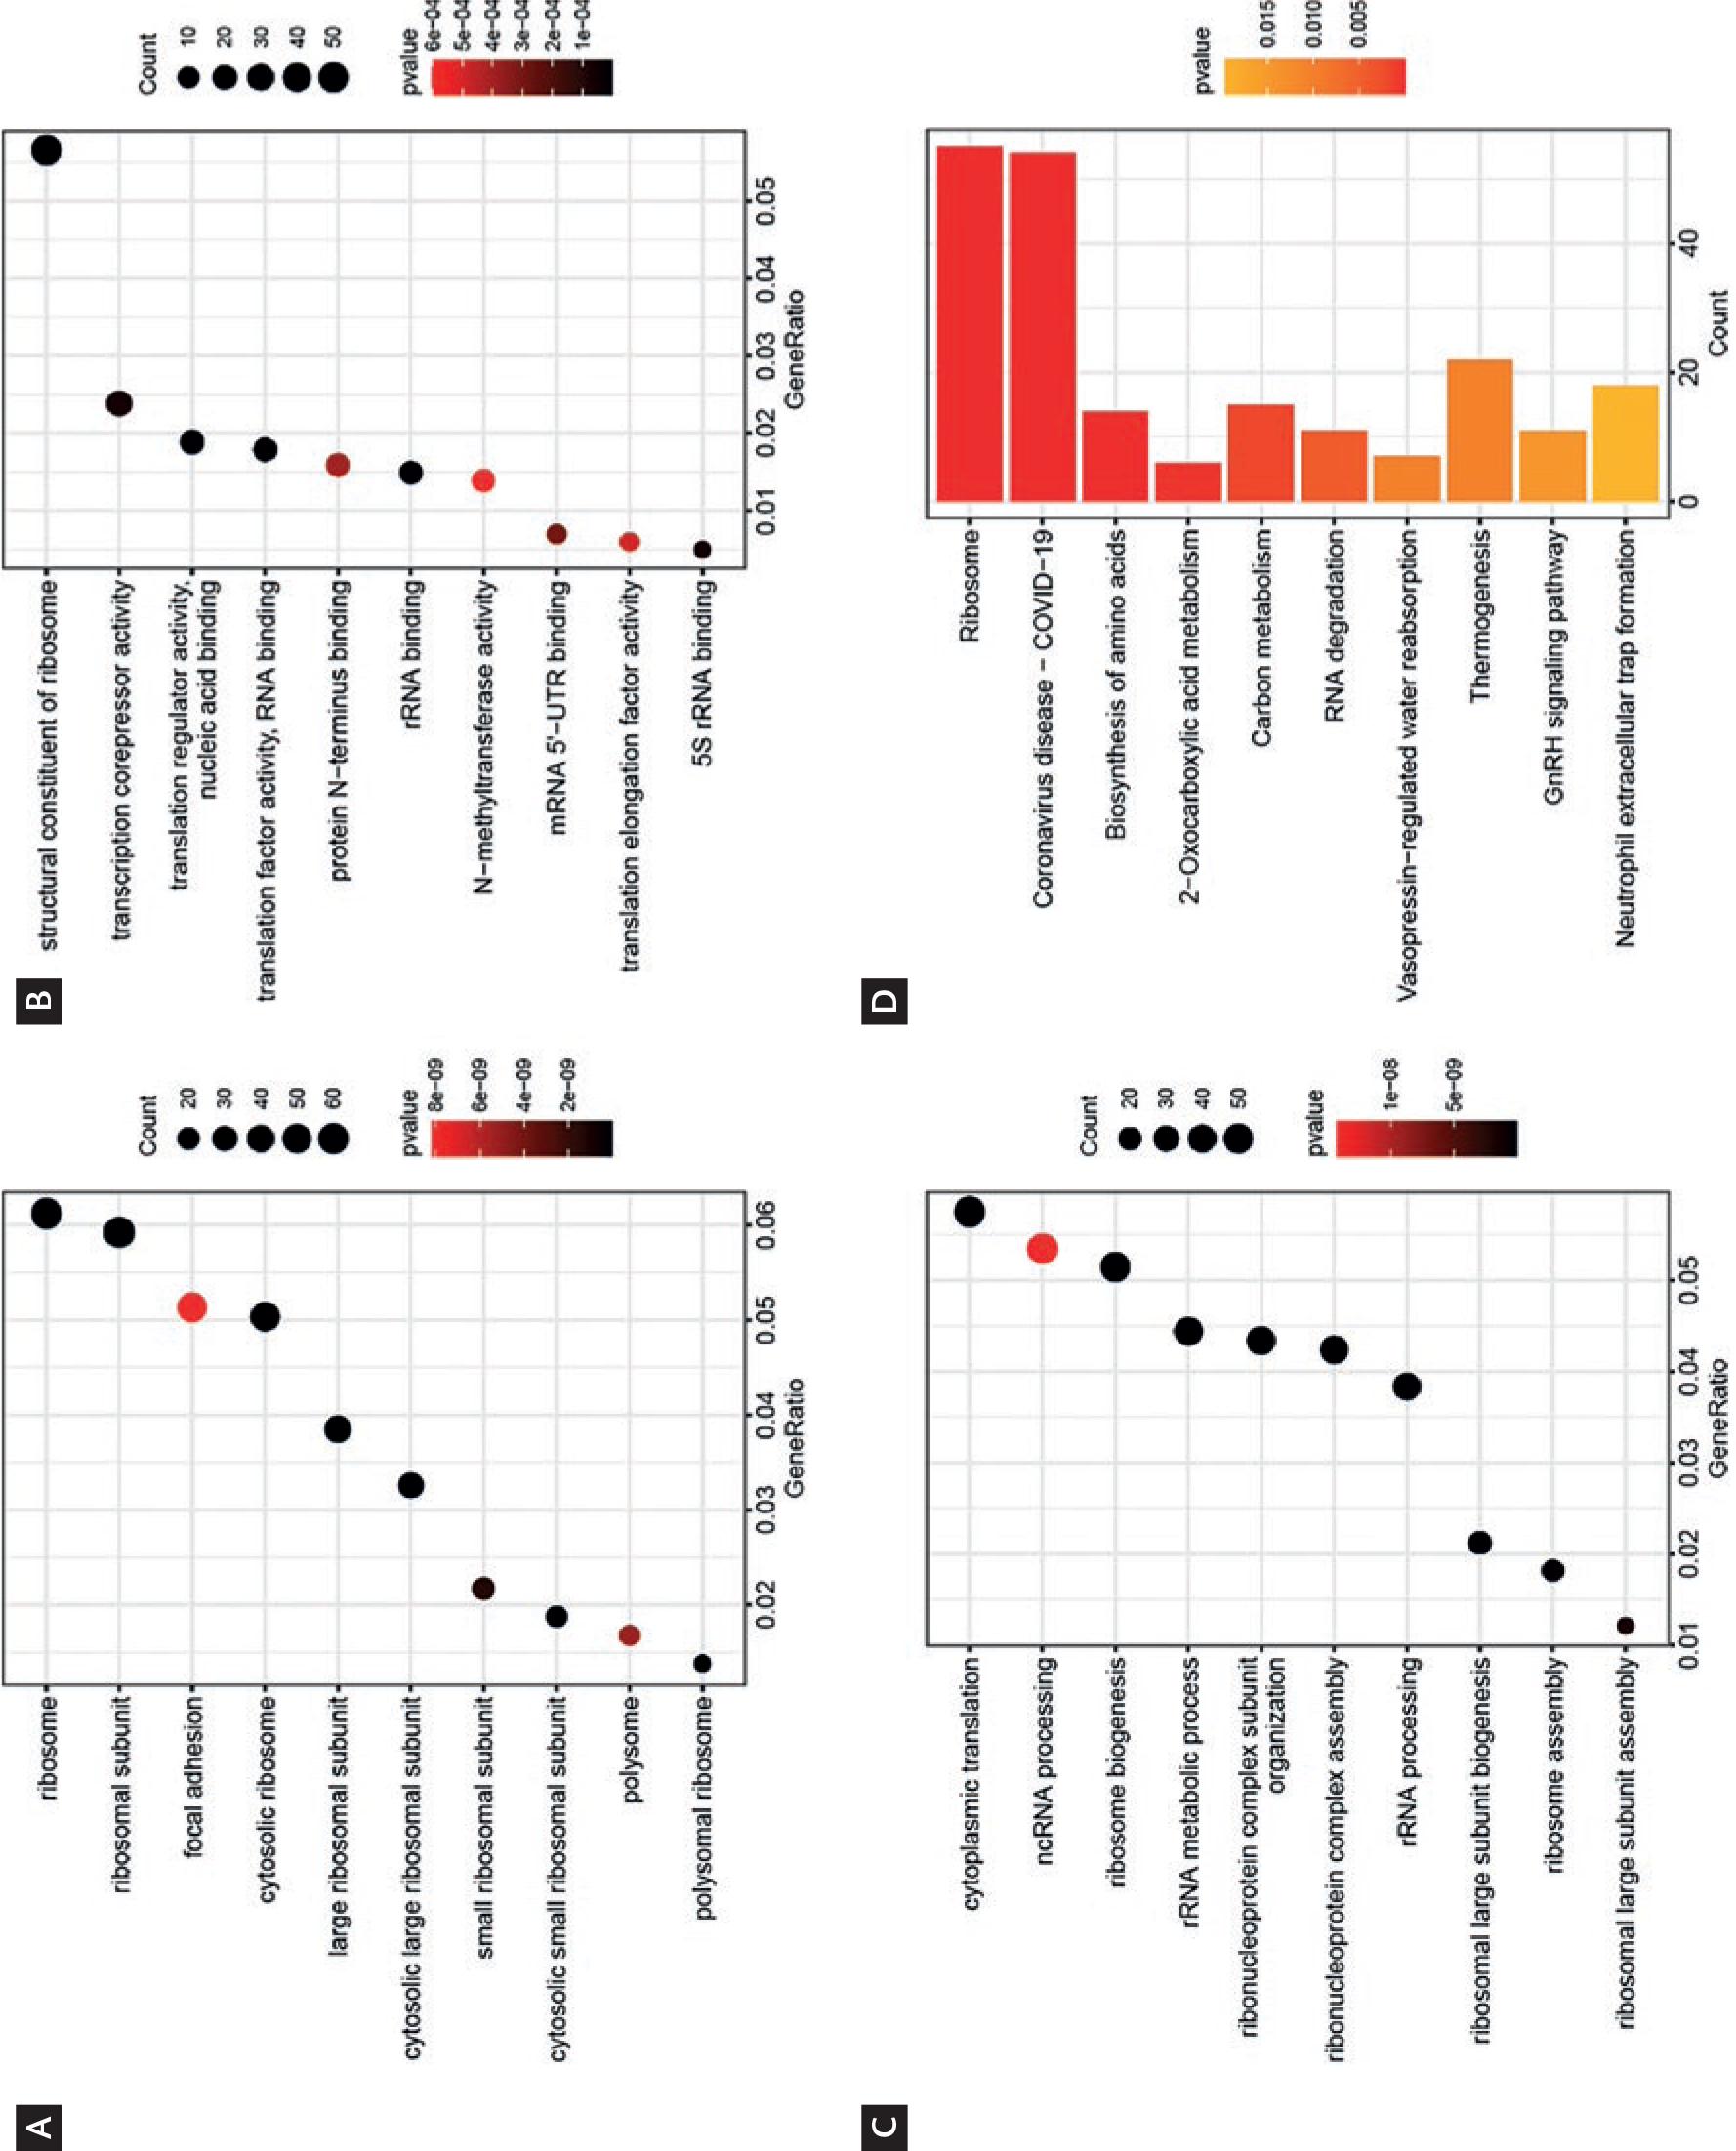
Figure 4. The function enrichment analysis of down-regulated differentially expressed genes (DEGs). A-C: the top 10 Gene Ontology terms of down-regulated DEGs A: cellular components; B: molecular function; C: biological process. Each point represents a specific molecular function, with its size indicating the number of genes involved and its color representing the statistical significance (p) of the association. D: the top 10 KEGG pathways of down-regulated DEGs. The horizontal axis shows the number of genes involved in each pathway, and the color represents the statistical significance (p) of the enrichment.
Overview of lncRNA data
To investigate the alterations in lncRNA expression during the H1N1 infection process, we performed lncRNA-seq analysis. First, 4117 lncRNAs were identified through lncRNA prediction tools, including CPC2, CNCI, Pfam, and PLEK (Fig. 5A). Next, the PCA plot demonstrated significant differences between S and L groups (Fig. 5B; PC1, 47% variance; PC2, 15% variance). The expression distribution of each lncRNA showed that the expression levels of novel-lncRNA were relatively higher compared to mRNA (Fig. 5C). Moreover, we observed that the average number of exons of novel lncRNAs was lower compared to mRNAs (Fig. 5D).
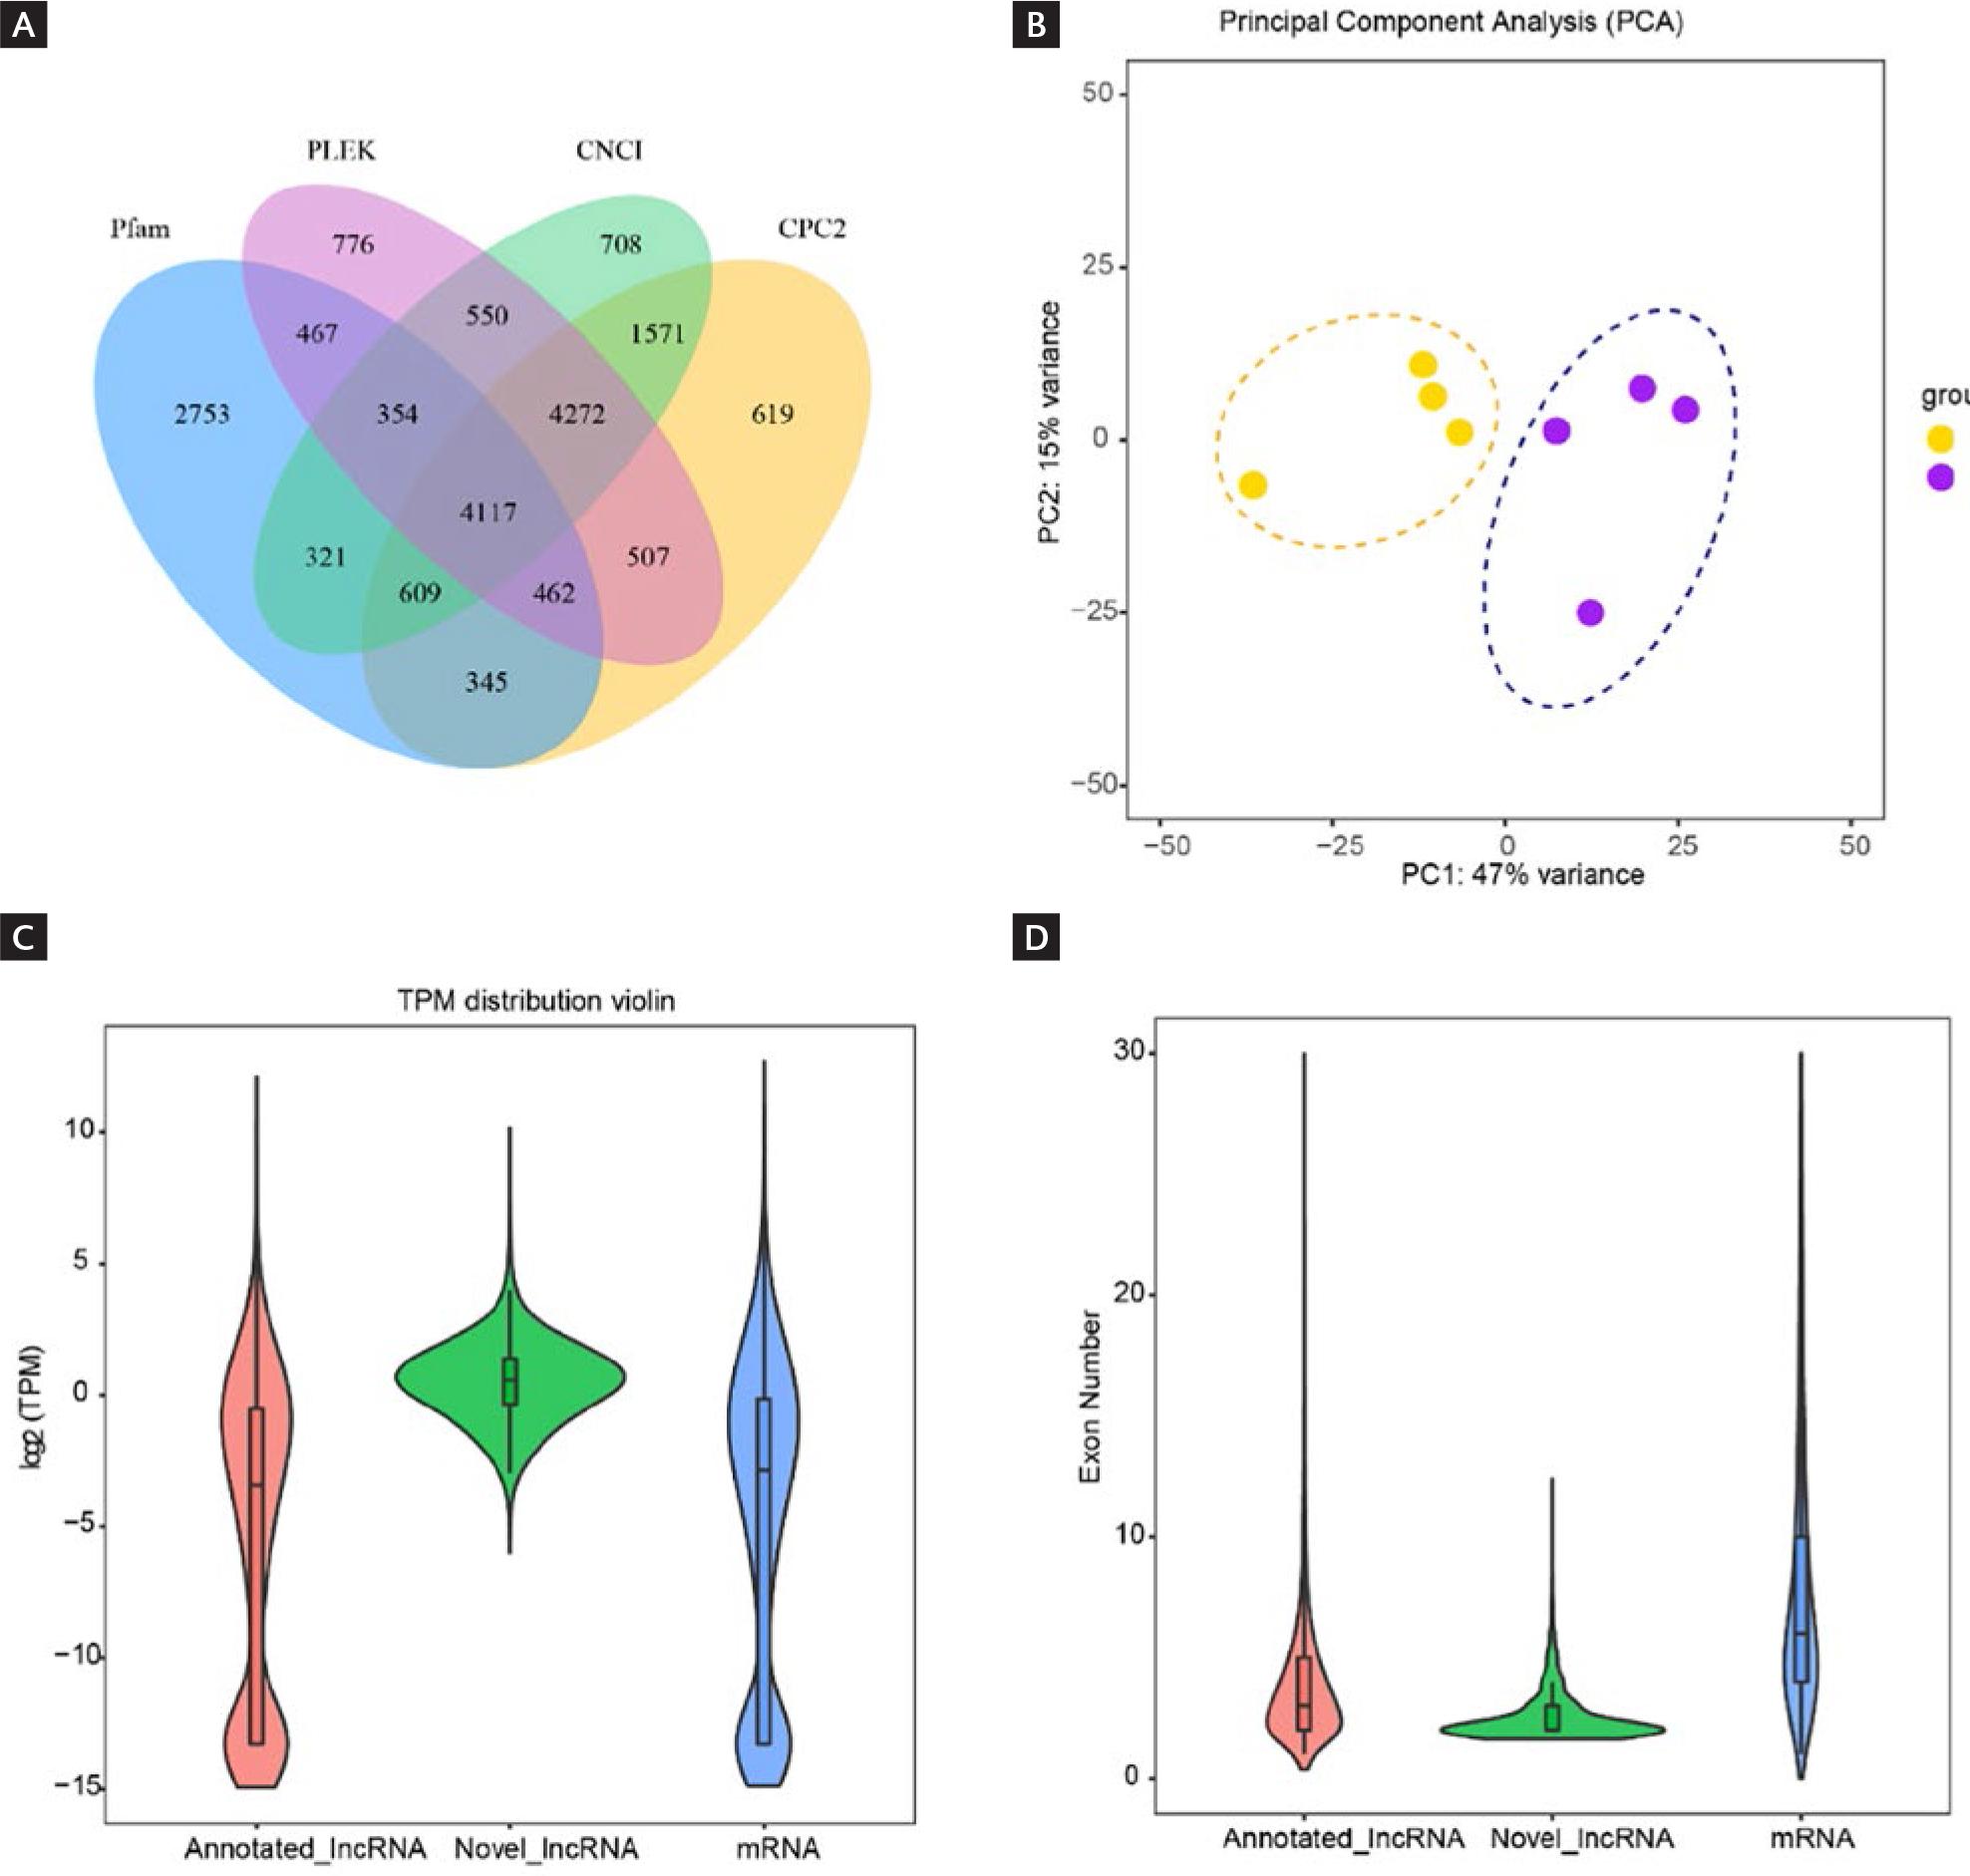
Figure 5. Overview of the expression of lncRNA. A: Venn diagram shows the overlap of lncRNAs identified by four different computational tools (CNCI, CPC2, Pfam, and PLEK). Each circle represents lncRNAs predicted by one tool, and the overlapping regions indicate lncRNAs identified by multiple tools. B: Principal Component Analysis plot displays the overall similarity and differences in lncRNA expression patterns across all samples. The two main axes (Principal Component 1 and Principal Component 2) summarize the most significant variations in the data. Samples that are closer together have more similar lncRNA expression profiles. C: violin plot (lncRNA expression) shows the distribution of lncRNA expression levels across all samples. The width of the violin shape represents the density of data points at different expression levels. D: violin plot (number of exons) illustrates the distribution of the number of exons (coding regions) in lncRNAs. The width of the violin shape indicates the density of lncRNAs with a specific number of exons.
Changes in lncRNA expression caused by H1N1 infection
Utilizing the aforementioned set of identified lncRNAs, we proceeded to delve into their transcriptional characteristics in response to H1N1 infection. Initially, we classified these lncRNAs based on their genomic locations, resulting in the identification of 327 long intergenic non-coding RNAs (lincRNAs), 1224 sense intronic lncRNAs, 508 antisense lncRNAs, and 2058 sense overlapping lncRNAs (Fig. 6A). This classification provides insights into the diverse origins and biogenesis of lncRNAs. To gain a broader understanding of the chromosomal distribution of these lncRNAs, we examined their allocation across each chromosome. Notably, chromosome 1 exhibited the highest abundance of lncRNAs, whereas the Y chromosome displayed the lowest number of lncRNAs (Fig. 6B). Employing differential expression analysis, we identified 508 lncRNAs that displayed altered expression levels upon H1N1 infection. Among these, 327 lncRNAs were up-regulated, while 181 lncRNAs were down-regulated (Fig. 6C), and the heat map showed expression patterns of these differentially expressed lncRNAs and provided an overview of the expression characteristics and patterns exhibited by the altered lncRNAs during H1N1 infection (Fig. 6D).
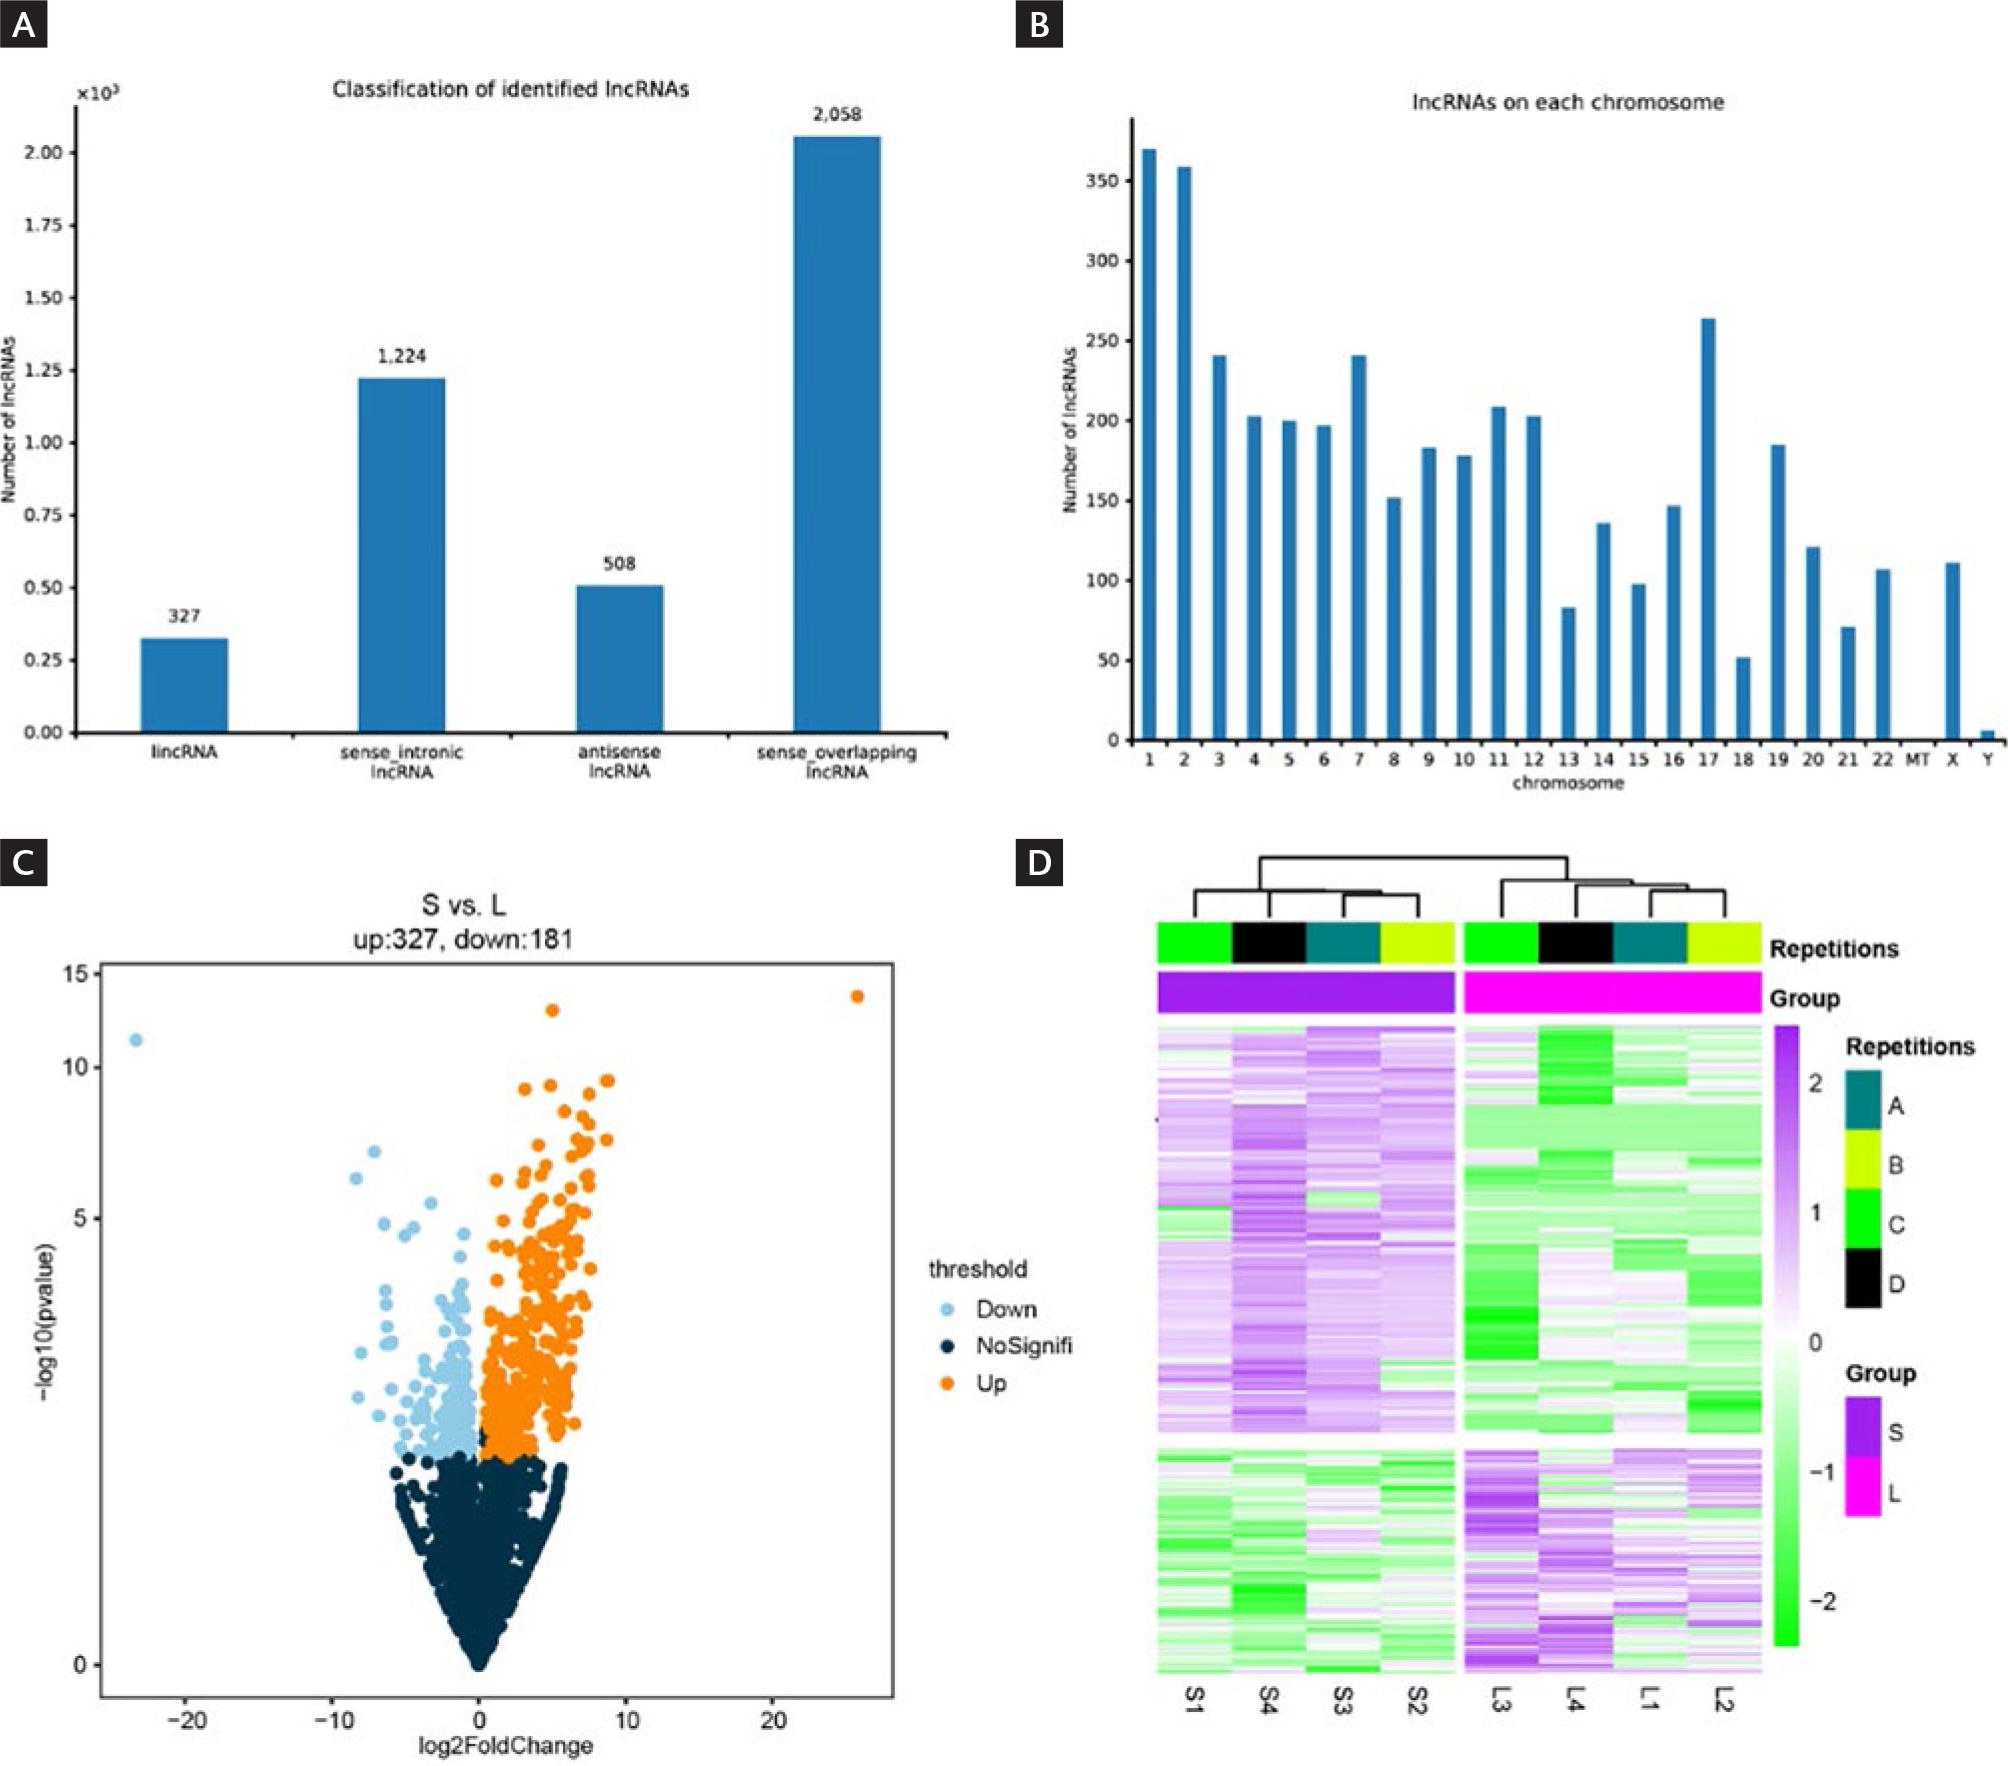
Figure 6. Expression characteristics of lncRNA. A: the bar plot shows lncRNA counts for different classification features. Each bar represents the count of lncRNAs belonging to a specific category. B: bar plot (chromosome location) displays the number of lncRNAs located on each chromosome. Each bar represents a chromosome, and its height indicates the total number of lncRNAs found on that chromosome. C: volcano plot (differential expression) shows the distribution characteristics of lncRNAs. The horizontal axis (log2 Fold Change) shows the magnitude of expression change, while the vertical axis (-log10 p value) indicates the statistical significance of these changes. Gold dots represent lncRNAs with increased expression (up-regulated), and sky-blue dots represent lncRNAs with decreased expression (down-regulated). D: heatmap (expression patterns) shows the expression levels of lncRNAs across different sample groups. Each row represents lncRNA, and each column represents a sample group. The color intensity indicates the expression level.
DISCUSSION
The ravages of influenza viruses around the world have posed new challenges to global public health security29. The infection of influenza virus requires entry into host cells and relies on host factors, such as cellular receptors, transcription machinery, and immune response regulators, to facilitate viral replication and propagation30-32. Host factors are integral components of the viral life cycle, including receptors, transport systems, transcription and translation mechanisms, immune responses, metabolic pathways, and host proteins. Host factors play a key role in every aspect of influenza virus infection and replication, determining the virus' pathogenicity and ability to spread33-35. After the virus infects host cells, it will induce an immune response in the body36. The normal immune response is conducive to virus clearance, while the abnormal immune response will induce a cytokine storm37. In the whole process of antiviral immunity, mRNA and lncRNA play crucial roles: mRNA encodes proteins essential for immune signaling and effector functions, while lncRNA regulates gene expression, immune cell activation, and viral replication through mechanisms such as chromatin remodeling, transcriptional interference, and miRNA sponging38-41. It has been reported that patients who are sensitive to IAVs can develop ARDS and even die, which is mainly due to triggering cytokine storms in the body7,42. Cytokine storm is due to excessive activation of immune cells, which makes inflammatory factors in the body not regulated over-release43. PBMCs include lymphocyte cells (T cells, B cells, NK cells) and monocytes, which are involved in immune responses and cytokine storm formation44.
LncRNAs can serve as disease biomarkers of viral infection and mediate cell death by promoting inflammation11,45. A previous study on microarray sequencing reported that H1N1 infection caused abnormal expression of non-coding RNA46; however, the RNA-seq used in this study can obtain transcripts more efficiently and with higher sensitivity47. Therefore, further studies of other lncRNAs discovered in the context of H1N1 infection may provide valuable indications for new approaches to managing and preventing future global crises. In this study, we investigated the transcriptional signature of PBMCs from H1N1-infected patients. Our current study showed that many lncRNAs (508), as well as protein-coding genes (3147), were acquired in patients with different degrees of H1N1 infection, including mild and severe. 327 lncRNAs were up-regulated, while 181 lncRNAs were down-regulated. Therefore, the dysregulation of these lncRNAs may play a significant role in shaping the host's immune response and contribute to the pathogenesis of H1N1 infection. Previous studies have demonstrated that lncRNAs play critical roles in virus-host interactions by acting as key regulators of transcriptional and post-transcriptional processes during viral infection48. lncRNAs regulate activation of pattern recognition receptor (PRR)-associated signaling and transcription factors (NF-κB), as well as production of IFNs and cytokines, and expression of critical IFN-stimulated genes. lncRNA regulates influenza virus replication by gene expression regulation and anti-viral activity during influenza virus infection. lncRNAs were predominantly associated with pathogen recognition and disease pathogenesis pathways49. To gain a broader understanding of the chromosomal distribution of these lncRNAs, we examined their positional distribution across each chromosome. Interestingly, we observed that chromosome 1 exhibited the highest abundance of lncRNAs, while the Y chromosome displayed the lowest number of lncRNAs.
There is consensus that IAVs hijack the host cell's protein synthesis machinery to produce more viral proteins50, causing the down-regulation of mRNA expression. In this study, we found that many mRNAs were differentially expressed in severe H1N1 patients compared with mild patients. Ribosome is one of the most important organelles in cells, which can synthesize corresponding proteins under the guidance of mRNA51. Functional enrichment analysis of downregulated genes revealed that, at the level of cellular components, these genes were involved in ribosome composition (Fig. 4). Moreover, "ncRNA processing" and "ribosome assembly" were down-regulated, which indicate that protein synthesis was blocked and ncRNA metabolism was disordered52,53. The top 10 KEGG pathway found that GnRH signaling pathway was enriched. This signaling pathway will have MAPK signaling pathway crosstalk, and our KEGG analysis also found the enrichment of MAPK signaling pathway54. The cascade reaction of the MAPK signaling pathway leads to the related regulation of translation and transcription in the cell and may induce the activation of cell cycle checkpoints55. It is worth noting that cytokine storms are one of the leading causes of death and are the deadliest manifestation of IAVs. The cytokine storm is caused by the over-activation of PBMCs44. Consistent with previous findings, we found that lncRNAs are involved in the course of IAVs infection and may be involved in the regulation of cytokine storms11. The regulatory role of lncRNAs may be due to MAPK cascade56. For up-regulated genes, we found that these genes participated in forming GTPase assembly. GTPases act as molecular switches or timers in many fundamental cellular processes, involved in signal transduction in response to activation of cell surface receptors57. Interestingly, we observed that "response to virus" and "defense response to virus" ranked as the top 2 terms in biological process level. This suggests a heightened immune response to H1N1 infection in critically ill patients, manifesting in more pronounced clinical features18.
In addition, the transcriptional functional characterization of up-regulated genes revealed enrichment in immune-related pathways, such as the RIG-I-like signaling pathway and cell cycle, corroborating the findings from the down-regulated enrichment analysis involving the MAPK signaling pathway. The up-regulation of the RIG-I-like signaling pathway has been associated with anti-viral responses, highlighting the activation of the body's intrinsic defense mechanisms during disease progression58. Furthermore, our analysis identified the PPAR signaling pathway as a key pathway involved in viral infection. PPARγ, a master regulator of metabolism, adipogenesis, inflammation, and cell cycle, was found to play a crucial role in the host response to infection. Previous studies have indicated that PPARγ's function in the infected adult brain can be beneficial in combating inflammation, oxidative stress, and viral replication and the transrepression of NF-κB by activated PPARγ contributes to immune evasion mechanisms59. On the other hand, the transcriptional functional characterization of down-regulated genes revealed that viruses exploit host ribosomes to translate viral mRNAs, often utilizing virally encoded functions to manipulate cellular translation factors. This strategy ensures the production of viral proteins while simultaneously suppressing innate host defenses that aim to restrict the protein synthesis capacity of infected cells. Viruses employ this mechanism to evade host immune responses, subvert host protein synthesis functions, and regulate mRNA translation within infected cells.
It is worth mentioning that we found that after H1N1 infection, more changes in lncRNA expression could be detected in critically ill patients. The study of lncRNA changes in H1N1 infection has been reported36,37. We found 508 differentially expressed lncRNAs, which were involved in the progression of H1N1 infection. These findings might translate into clinical applications, such as novel diagnostic markers or therapeutic targets. The DEGs identified in the study, especially those associated with ribosome assembly and key signaling pathways, could be validated as part of a biomarker panel for distinguishing between severe and mild H1N1 infections. This panel could be incorporated into molecular diagnostic assays to enhance the accuracy and specificity of early disease detection. Moreover, transcriptomic signatures reflecting the severity of H1N1 infection may serve as indicators of disease progression and outcome. By analyzing the expression levels of specific DEGs in patient samples, healthcare providers could stratify individuals based on their risk of developing severe illness, enabling personalized treatment and monitoring strategies. Furthermore, DEGs implicated in critical cellular processes and signaling pathways could represent potential targets for novel therapeutic interventions. Small molecule inhibitors or biologics designed to modulate the activity of these genes or pathways may offer new avenues for treating severe H1N1 infections and mitigating disease complications. Finally, continuously monitoring changes in the expression levels of key DEGs during the course of H1N1 infection may provide insights into the dynamic nature of the disease and guide adjustments in treatment strategies. Real-time assessment of transcriptomic signatures could help predict clinical trajectories and inform timely interventions.
However, it is important to acknowledge certain limitations of the study. The sample size, consisting of 4 severe and 4 mild H1N1-infected patients, may be relatively small, potentially impacting the generalizability of the findings. In addition, the study's focus on PBMC samples may not fully capture the complexity of the immune response to H1N1 infection, warranting consideration of other relevant cell types or tissues. Moving forward, future research could benefit from expanding the scope of transcriptomic analysis to encompass a larger patient cohort, facilitating a more robust validation of the identified DEGs as potential biomarkers for distinguishing between severe and mild H1N1 infections.
The novel aspects of the current study's results lie in the comprehensive analysis of transcriptional variances in mRNA and lncRNA between severe and mild cases of H1N1 infection. This approach represents a significant advancement in understanding the molecular mechanisms underlying the severity of H1N1 infections, particularly in the context of host gene expression.
While the study's findings offer valuable insights into the distinct transcriptomic features associated with severe H1N1 infections and their potential diagnostic and therapeutic implications, addressing the study's limitations and pursuing avenues for further research will contribute to a more balanced and comprehensive understanding of the topic in the academic realm. Molecular studies of H1N1 pathogenesis may reveal specific host factors, gene expression patterns, or molecular signatures associated with disease severity and outcomes. These insights can aid in the identification of biomarkers for early diagnosis, prognosis, and monitoring of H1N1 infection, allowing for more targeted clinical management and timely intervention in severe cases.

