


 nueva página del texto (beta)
 Inglés (pdf)
 Artículo en XML
 Referencias del artículo
 Enviar artículo por email
 Citado por SciELO
  Similares en
SciELO
Similares en
SciELO 
 Permalink
Statistical significance refers to the likelihood that a relationship between two or more variables, is caused by something other than chance.1 Statistical hypothesis testing is used to determine whether the result of a data set is statistically significant. In medicine usually it is used for the comparison of some characteristics of two groups. Two examples are patient’s age or weight previous to the intervention or glucose levels with the administration of two different drugs. Since in medicine we always work with samples and never with a whole population, we make inferences from the sample to estimate with the statistics the parameter whose values we really do not know (Figure 1). Then we use the knowledge derived from taking many samples from a population, distributing them (central limit theorem and the standard error of the mean), knowing the properties of the distribution (e.g. normal or Gaussian curve) and finally calculating the probability that the sample means difference is due to chance or shows a true difference present in the universe (p value). There is a risk to be wrong if we accept the difference as being true when in fact it does not exist (type I or alfa), and also a risk to accept the null hypothesis of no difference when in fact it does exist (type II or beta) (Figure 2).
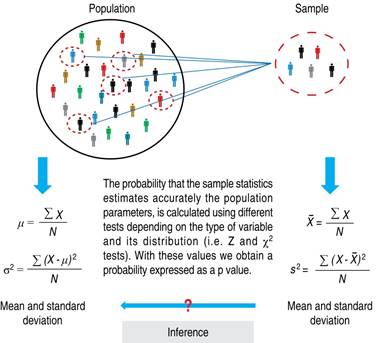
Figure 1: Sampling of a population, formulas to calculate mean and dispersion. The results obtained in the sample are used to estimate the probability that they reflect the population parameter values.
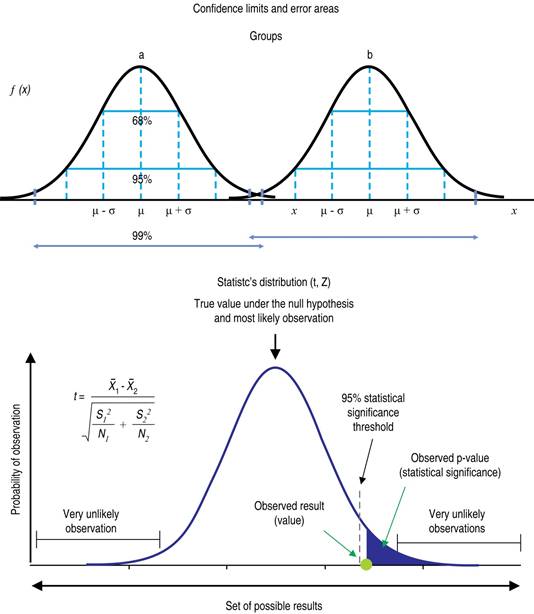
Figure 2: On the left side, distribution curves that point to the central trend (mean) and dispersion as standard deviation for two groups. In the right curve distributions of statistics (z or t) with the respective formula and limits to reject the null hypothesis (95% confidence). https://www.simplypsychology.org/p-
All the preceding discussion is related to the mathematical probabilities of the sample reflecting the universe appropriately, but clinical importance is a completely different matter.2 If the investigation is accepted in its design, execution and conclusions as having internal validity, the extrapolation to different populations has to be done with extreme care (external validity). The magnitude of the effect is to be analyzed looking at the differences of attributable risk and not in relative risk. The GRADE scale or other methods of qualifying a paper is a first step in deciding if the concept is solid. The clinically important difference can be calculated following the recommendations of groups like «The clinimetrics corner».
NNT or number needed to treat shows that the larger the effect, the smaller the NNT to obtain a benefit (e.g. avoiding a death). Consult The NNT page and the publications of David Sackett.
For example, we can observe a difference of 1% in absolute risk reduction (stroke or death) in five years of treatment (4% in the control group and 3% in the intervention group) but express it as a relative reduction of 25% because 1% is ¼ of the control group risk. The NNT would be treating 100 patients for 5 years to reduce a case. As the study includes 5000 patients, the difference is statistically significant.
But does it have a clinical importance? To decide in favor of an intervention it has to be proven in its efficacy, then in its effectiveness and finally in its cost-effectiveness as shown in the Cochrane model. Concepts to be considered include if the hypothesis has been subjected to falsification or confirmation in different settings, and the acceptance by patients and the medical community.

