


 nueva página del texto (beta)
 Inglés (pdf)
 Artículo en XML
 Referencias del artículo
 Enviar artículo por email
 Citado por SciELO
  Similares en
SciELO
Similares en
SciELO 
 Permalink
1. Introduction
The 2008 global financial crisis revealed how the drying up of stock market liquidity can act as a precursor to broader economic downturns. This experience renewed academic interest in the role of market liquidity as a leading indicator of business cycles and economic activity (Apergis et al., 2023; Chikwira & Mohammed, 2023; Im et. al., 2024; Næs et al., 2011). Florackis et al. (2014) have demonstrated that sharp declines in liquidity not only restrict the availability of long-term financing but also affect investor sentiment, leading to reductions in investment and consumption.
From a theoretical standpoint, liquid stock markets play a central role in economic development. They improve capital allocation, reduce the cost of funding, and enhance the informational content of asset prices (Levine,1991; Amihud, 2002). A liquid secondary market enables investors to adjust their portfolios with minimal transaction costs, thereby lowering the risk premium required to hold risky assets and supporting productive investment. Moreover, current asset prices in liquid markets tend to reflect investor expectations about future macroeconomic conditions, reinforcing the consumption-smoothing channel (Næs et al., 2011).
When financial systems face liquidity constraints, their vulnerability increases (Elliott et al., 2025; Huang et al., 2024; and Kim et al, 2024). A decline in equity prices may lead to reduced investment and can amplify economic recessions (Florackis et al., 2014). Moreover, liquidity should also convey information about future macroeconomic conditions. The “flight to quality” phenomenon, often observed before economic downturns, illustrates how investors, anticipating instability, reallocate capital away from equities toward safer assets. This behavior underscores the prospective nature of stock markets as forward-looking mechanisms that reflect investor expectations markets (Switzer & Picard, 2016).
Since 2010, the BRICS-Brazil, Russia, India, China, and South Africa-have emerged as major players in the global economy. Figure 1 illustrates the significant expansion of their stock markets, particularly in China and South Africa, where market capitalization as a share of GDP exceeds 100% in the latter (see Figure 1) (Pant, 2013). However, unlike developed markets, BRICS countries differ in their institutional quality, financial structures, and susceptibility to external shocks. These features let us raise an important question: Does stock market liquidity serve as a reliable predictor of economic growth and recession risk in BRICS countries?
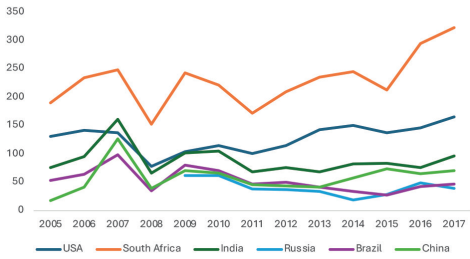
Source: Prepared by the authors with data from Federal Reserve Bank of St. Louis (n.d.).
Figure 1 Stock Market Capitalization to GDP for the BRICS Countries
Using quarterly data from the Federal Reserve Bank of St. Louis (n.d.) for the period 2010 to 2017, we examine whether stock market liquidity is a significant predictor of both economic growth and the likelihood of recession in BRICS countries. We estimate a dynamic panel data model to assess the short-run impact of liquidity on GDP growth. Following Estrella and Mishkin (1998), we also employ a probit model to evaluate the ability of liquidity indicators to anticipate recessions. To capture multiple dimensions of market liquidity, we rely on three standard proxies: the Amihud illiquidity measure (IRLM), trading volume, and the relative bid/ask spread (RS). Our findings suggest that lower levels of liquidity are significantly associated with weaker economic growth and a higher probability of recession, even after controlling for key macroeconomic variables, including money supply growth, interest rate spreads, and market volatility.
By focusing on emerging economies where the proportion of stock market capitalization to Gross Domestic Product (GDP) is substantial (averaging more than 50%), this study contributes to the growing literature on the predictive power of stock market liquidity. It provides policymakers with insights relevant to designing macroprudential frameworks in developing countries. The rest of the paper is structured as follows. Section 2 provides a brief literature review. Section 3 describes the methodology and data used to analyze the impact of stock market liquidity on economic growth, and Section 4 shows and discusses our results. Our concluding remarks appear in the last section.
2. Literature Review
The relationship between stock market liquidity and real economic activity has garnered growing attention, particularly in the aftermath of financial crises that have highlighted the role of financial markets in amplifying or transmitting shocks to the broader economy (Mattana & Panetti, 2014; Chu & Chu, 2020). Several theoretical frameworks suggest that stock market liquidity can affect growth through multiple channels. A liquid market reduces the cost of capital and improves resource allocation, enabling firms to undertake long-term investments that foster productivity and economic expansion (Levine, 1991; Amihud, 2002).
In addition to the investment channel, liquidity influences the economy through expectations embedded in asset prices. As noted by Næs et al. (2011), changes in stock market liquidity can precede shifts in macroeconomic conditions, as investors adjust their portfolios in anticipation of downturns. This phenomenon is often reflected in a “flight to quality” phenomenon, where capital moves away from equities and into safer assets during periods of uncertainty (Bao Dinh & Tran, 2024). Overall, stock market liquidity serves as a signaling mechanism for the future state of the economy, influencing both consumption and investment decisions.
2.1 Evidence from Developed Countries
The transmission channel of liquidity shocks in the stock market to the real economic cycle has been discussed very rarely in the literature. Primary studies are conducted in developed economies with deep financial markets and stable institutions. Levine (1991) examines the relationship between stock market development and long-term economic growth, reviewing the role of stock markets in economic development. Rousseau and Wachtel (2000) employed a pure cross-sectional empirical approach, utilizing a panel VAR, which revealed that stock market liquidity and the intensity of activity in traditional financial intermediaries have leading roles in influencing per capita output. Their findings indicate that changes in stock market liquidity are crucial for institutions in promoting economic activity.
Similarly, Næs et al. (2011) employed an alternative liquidity measure for the United States and Norway, showing that stock market liquidity can serve as an early indicator of the future state of macroeconomic variables. They also demonstrated that investors’ portfolio compositions change in response to the business cycle, and investor participation is linked to stock market liquidity, suggesting that systematic liquidity variation is associated with a “flight to quality” during economic downturns. Additionally, Meichle et al. (2011) suggest that financial variables convey leading information for predicting business cycles. They found that stock market liquidity is the primary predictor of economic activity in Switzerland.
Furthermore, Florackis et. al. (2014) examined the illiquidity of the stock markets using linear and non-linear models. Their results showed a statistically significant negative relationship between stock market liquidity and the future growth of the United Kingdom’s GDP. This relationship is stronger during periods of liquid market conditions and weak economic growth. They determine that liquidity is an early informative indicator of future economic conditions, as it serves as a signal revealing information about investors’ intentions. During periods of uncertainty or a negative outlook, investors tend to leave the stock market to invest in fixed-income assets.
Switzer and Picard (2016) examined the relationship between business cycles and market-wide liquidity in the United States using a non-linear approach to capture the non-linear dynamics of macroeconomic series and found a significant relationship. Galariotis and Giouvris (2015) obtained similar results regarding national and global stock market liquidity and its interaction with macroeconomic variables for six of the G7 economies.
Shi (2015) evaluated the quantitative importance of financial frictions in business cycles, demonstrating that a negative financial shock (such as an illiquid stock market) can cause aggregate investment, employment, and consumption to decline in tandem with output. Also, Chu and Chu (2020) studied the relationship between stock market liquidity and economic growth using a panel of 136 countries. The study reveals that stock market liquidity contributes to economic growth, but only up to a certain point. After certain levels, it can slow growth. This effect is more potent in rich countries.
2.2 Evidence from Emerging and Developing Economies
Despite these findings, several studies have limitations related to the specificity of the context, as they primarily focus on countries with high institutional stability and financial depth, which hinders their generalizability to emerging economies. In recent years, new research has expanded the understanding of the link between stock market liquidity and economic activity in emerging markets, addressing structural, technological, and institutional factors.
Chowdhury et al. (2017 and 2024) are among the primary studies that have focused on analyzing the interaction between macroeconomic variables and the liquidity of financial markets in emerging countries. They investigated the influence of monetary and fiscal policy variables on the market and firm-level liquidity of eight Asian stock markets. Using four different measures of liquidity and nine macroeconomic variables, they found a significant impact on liquidity.
Additionally, Ogunrinola and Motilewa (2015) examined the relationship between stock market liquidity and economic growth in Nigeria. Contrary to expectations, their results showed that stock market liquidity had no statistically significant impact on economic growth during the study period.
Chipaumire and Ngirande (2014) examined the impact of the stock market on economic growth in South Africa. These researchers employed ordinary least squares regression (OLS) using time series data from 1995 to 2010. They concluded that stock market liquidity has an impact on economic growth in South Africa. Pan and Mishra (2018) analyzed the impact of stock market activity on China’s economy using unit root tests with structural breaks and the ARDL (Autoregressive Distributed Lag) model . They found that the 2007-2012 global financial crisis had a significant impact on both the real and financial sectors.
Guru and Yadav (2019) analyzed the relationship between financial development and economic growth in BRICS countries from 1993 to 2014, using both banking and stock market indicators. The results showed that key banking indicators and the value of shares traded are significantly and positively associated with economic growth, highlighting their complementary roles. However, the Turnover Ratio (TUR) does not show the same effect when banking indicators are included, suggesting that not all market measures contribute equally to growth.
Recent contributions have expanded the scope of analysis, examining the relationship between liquidity and innovation, efficiency, and economic value. Liu and Suzuki (2024) conclude that stock market liquidity promotes innovation in small and medium-sized Chinese companies by alleviating financial constraints. However, Im et al. (2024) found that while liquidity enhances the economic value of patents, it may reduce the volume of innovation itself, highlighting a possible trade-off. Patra and Hiremath (2024) further demonstrated that market information efficiency varies according to liquidity levels.
Taken together, these studies confirm that stock market liquidity plays a key role in shaping macroeconomic outcomes. However, few studies have systematically explored this relationship in the BRICS context, using multiple liquidity proxies and both linear and non-linear modeling approaches. This paper aims to address this gap by examining whether liquidity is a significant predictor of economic growth and recession risk across five major emerging economies. Hence, we aim to test the following two hypotheses:
H1: Stock market liquidity has a positive and significant impact on future economic growth in the BRICS countries.
H2: Stock market liquidity has a negative and significant impact on the probability of economic recession in the BRICS countries.
3. Data and Methodology
3.1 Liquidity proxies
What is liquidity? Pástor and Stambaugh (2003), Uddin (2009), Papavassiliou (2013), and O’Hara (2004) define liquidity as the ability to trade large volumes of shares with minimal price impact, costs, and postponement. Many studies have developed diverse liquidity proxies because it is an unobservable factor. The literature that studies financial markets, use as liquidity proxies the margin between supply and demand (bid/ask spread), the depth, which is associated with the amount of assets that can be traded in a given moment at a certain price, and the impact on the price that measures the change in price due to a transaction of a specific size (Agudelo Rueda, 2010). Alternatively, high-frequency liquidity measures require intraday data on bid/ask quotes, order flow, and volume traded; however, these variables are not available for an extended period.
Each liquidity proxy has its advantages and disadvantages, particularly when applied in emerging markets. The IRLM is widely used due to its simplicity and data availability; nevertheless, it can be sensitive to extreme returns or periods of low volume, which are common conditions in less liquid markets. The TUR is easy to interpret and is usually reported systematically, although it may overestimate liquidity in speculative or highly volatile contexts. Additionally, the RS directly reflects transaction costs; however, in emerging markets, these quotes may not be updated frequently or may be distorted due to low transparency. For these reasons, this study simultaneously employs three complementary measures (price impact, traded volume, and transaction cost) to capture different dimensions of stock market liquidity and improve the robustness of the analysis applied to BRICS countries.
Cooper et al. (1985) define a liquidity proxy as a bid/ask spread and examine the existing relationship between common stock liquidity and price behavior during major up and down movements in the market. Amihud and Mendelson (1991) employ the same proxy to examine the impact of capital asset liquidity on their prices, yielding reliable outcomes on the liquidity effect in asset pricing. Common proxies of liquidity in the literature are the volume of trading (VTR), the TUR, the IRLM, and the RS (Apergis et al., 2015).
The VTR refers to the total number of shares traded in the stock market on a single trading day. The TUR is the total number of shares traded during a specific time interval, expressed as a percentage of the number of outstanding shares. The TUR measures the percentage of the issued shares that change hands during a trading window (Apergis et.al, 2015).
As we can see, the TUR involves the VTR, so we should expect a high correlation between them. Amihud (2002) proposed a liquidity measure that estimates the impact of trading based on the daily price response associated with a one-dollar increase in trading volume. The measure is computed as the daily ratio of absolute stock return to dollar value volume:
where DT is the number of observations within a time window T, |Ri,t| is the absolute return at day t for stock i, and VOLi,t is the trading volume in monetary values at day t for stock i.
Finally, the RS provides a relative measure of trading cost at day t for stock i (Jun et al., 2003):
where
Hence, the IRLM involves the trading volume, and the RS involves the relative price impact of turnover. Therefore, in this research, we will use two liquidity proxies: the IRLM and the RS.
3.2 Data description
The data used in this study were obtained from three primary sources: Bloomberg (n.d.), Refinitiv (n.d.), and the Federal Reserve Bank of St. Louis (n.d.). We analyze both daily and quarterly data for the five BRICS countries-Brazil, Russia, India, China, and South Africa-covering the period from 2010 to 2017. All variables are expressed in US dollars and growth rates to ensure consistency and cross-country comparability.
The choice of this time frame is motivated by both methodological and structural considerations. Prior to 2010, South Africa was not an official member of the BRICS group. After 2017, new countries such as Mexico, Indonesia, and Turkey were considered for inclusion; however, their economic and financial profiles differ significantly from those of the core BRICS economies.
Moreover, the 2010-2017 period reflects a relatively stable macroeconomic and financial environment across most BRICS countries. This stability helps minimize the influence of disruptive structural reforms-such as the pension reform in Brazil in 2018-or extraordinary policy interventions-like China’s monetary stimulus in 2019. An additional advantage of this period is the availability of consistent and uninterrupted time series for key financial variables in the databases, which reduces the risk of structural breaks and ensures homogeneous data coverage across countries.
To measure the economic activity, we use three leading indicators: the seasonally adjusted quarterly GDP growth rate (relative to the previous quarter), the private consumption growth rate, and the annual real money growth rate. The latter is defined as the difference between nominal money supply growth and the inflation rate (Florackis et al., 2014). To construct the two liquidity proxies, we use daily stock market data including closing prices, returns, trading volumes, the total number of outstanding shares, and the RS.
As control variables, we include the term spread (Y spread), approximated by the difference between the 10-year government bond yield and the 3-month T-bill rate, and stock market volatility (Vol). The latter is computed using a GARCH model- Generalized Autoregressive Conditional Heteroskedasticity-applied to the return series of the leading stock market index.
All variables used in this study are expressed in US dollars, which provides a standard base of comparison between countries and eliminates potential distortions resulting from local exchange rate volatility. However, this decision implies certain limitations, particularly in economies with high financial dollarization or strong sensitivity to exchange rate fluctuations. To mitigate these effects, growth rates and relative ratios are used instead of nominal levels, and country-specific shocks are controlled by using fixed effects for country and period in the estimated models.
3.3 Model
Our study focuses particularly on liquidity as a leading indicator of the economic cycle of these countries. We estimate the relationship between liquidity and economic growth using a dynamic panel data model, which includes time effects (Florackis et al., 2014). We define the following model:
Where Yt is the realized growth of the macroeconomic variables per quarter, XLIQt-l is the vector of stock market liquidity proxies, Xt-l is the vector of control variables: lagged GDP growth (GDPt-1), the term spread (Y spread), the annual real money growth (M2), and the stock market volatility in 90 days published by Bloomberg.
To quantify the predictive power of liquidity concerning future recessions, we employ a probit model (Estrella & Mishkin, 1998). The probit model is dictated by the fact that the variable being predicted takes on only two possible values: whether the economy is in or out of a recession. The model is defined as follows:
Where
Where Rt is the observable recession indicator.
Where F is the cumulative normal distribution function corresponding to εt. This model is estimated by maximum likelihood with the function:
4. Results
Table 1 presents descriptive statistics for the liquidity proxies, as well as the GDP growth and control variables used in the analysis (see Table 1). Table 2, in turn, presents the correlation matrix among these variables (see Table 2). The results indicate that the GDP growth rate is negatively correlated with all other variables, most notably with the stock market volatility (-0.59) and the relative spread (RS) (-0.41). The results also suggest that higher volatility and wider spreads are associated with slower economic growth. The IRLM also shows a negative correlation with GDP growth (-0.30), implying that lower market liquidity is associated with slower economic growth.
Volatility exhibits a strong positive correlation with the IRLM (0.74) and the RS (0.82), thus indicating that periods of high illiquidity are typically accompanied by increased stock market volatility. Additionally, the IRLM and the RS are positively correlated (r = 0.58), although the correlation is not perfect. This suggests that both proxies capture different aspects of market liquidity.
Table 1 Descriptive Statistics
| Variables | N | Mean | Min | Max | Sd | p5 | p25 | p50 | p75 | p95 |
|---|---|---|---|---|---|---|---|---|---|---|
| ΔGDP | 130 | 0.00645 | -0.02315 | 0.02375 | 0.00907 | -0.00915 | 0.00097 | 0.00660 | 0.01288 | 0.02092 |
| Recess | 164 | 0.39634 | 0.00000 | 1.00000 | 0.49064 | 0.00000 | 0.00000 | 0.00000 | 1.00000 | 1.00000 |
| IRLM | 155 | 0.02948 | 0.00000 | 0.27258 | 0.06183 | 0.00001 | 0.00005 | 0.00008 | 0.00649 | 0.19260 |
| RS | 170 | 0.01545 | 0.00640 | 0.04264 | 0.00577 | 0.00781 | 0.01111 | 0.01486 | 0.01798 | 0.02671 |
| Δ M2 | 161 | 0.02715 | -0.29357 | 0.31508 | 0.03993 | -0.00181 | 0.01179 | 0.02522 | 0.03785 | 0.06745 |
| Y spread | 134 | 0.00906 | -0.01433 | 0.03563 | 0.01043 | -0.00837 | 0.00253 | 0.00641 | 0.01650 | 0.03023 |
| Vol | 170 | 0.01603 | 0.01073 | 0.02448 | 0.00333 | 0.01159 | 0.01361 | 0.01515 | 0.01861 | 0.02258 |
Note: GDP growth rate is the quarterly growth rate of the GDP; Recess is a dummy variable for recession (1) and (0) otherwise; IRLM is the Amihud illiquidity measure; RS is the relative bid/ask spread; ΔM2 is the quarterly growth rate in money supply; Y spread is the end-of-quarter sovereign bond yield spread; and Vol is the quarterly volatility of the stock market.
Source: Prepared by the authors.
Table 2 Correlation Matrix
| ΔGDP | IRLM | RS | Recess | ΔM2 | Y spread | Vol | |
|---|---|---|---|---|---|---|---|
| ΔGDP | 1 | ||||||
| IRLM | -0.2969 | 1 | |||||
| RS | -0.4097 | 0.5784 | 1 | ||||
| Recess | -0.1871 | 0.0326 | 0.2554 | 1 | |||
| ΔM2 | -0.0289 | 0.0714 | 0.0896 | -0.154 | 1 | ||
| Y spread | 0.122 | -0.0761 | -0.1225 | -0.3422 | 0.0477 | 1 | |
| Vol | -0.5921 | 0.7432 | 0.8151 | 0.1811 | 0.0752 | -0.0737 | 1 |
Note: GDP growth rate is the quarterly growth rate of the GDP; Recess is a dummy variable for recession (1) and (0) otherwise; IRLM is the Amihud illiquidity measure; RS is the relative bid/ask spread; ΔM2 is the quarterly growth rate in money supply; Y spread is the end-of-quarter sovereign bond yield spread; and Vol is the quarterly volatility of the stock market.
Source: Prepared by the authors.
Table 3 presents the results of the dynamic panel estimations, highlighting the role of stock market liquidity, measured through the IRLM, as a significant leading indicator of economic activity. The coefficient associated with the first lag of the IRLM is consistently negative and statistically significant across all model specifications, suggesting that decreases in market liquidity are associated with immediate declines in GDP growth. In other words, periods of reduced market liquidity tend to precede short-term economic slowdowns (see Table 3).
Table 3 Dynamic Panel Regressions of GDP Growth on IRLM
| Δ GDP | ||||
|---|---|---|---|---|
| (1) | (2) | (3) | (4) | |
| ΔGDPt-1 | 0.493*** | 0.488*** | 0.252** | 0.188 |
| [0.103] | [0.104] | [0.123] | [0.130] | |
| IRLMt-1 | -4.725*** | -4.839*** | -3.985*** | -3.947*** |
| [1.536] | [1.557] | [1.488] | [1.572] | |
| IRLMt-2 | 3.331** | 3.314** | 3.031** | 3.506** |
| [1.476] | [1.490] | [1.403] | [1.502] | |
| IRLMt-3 | 0.120 | 0.220 | 0.933 | 0.597 |
| [1.408] | [1.428] | [1.361] | [1.404] | |
| Y spreadt-1 | -0.0252 | -0.0320 | -0.0198 | -0.0876 |
| [0.0915] | [0.0932] | [0.0876] | [0.104] | |
| ΔM2 | -0.0149 | -0.00883 | -0.00878 | |
| [0.0241] | [0.0227] | [0.0236] | ||
| Vol | -1.474*** | -1.636*** | ||
| [0.474] | [0.495] | |||
| Fixed Effects Year | No | No | No | Yes |
| Constant | 0.00481*** | 0.00524*** | 0.0288*** | 0.0255*** |
| [0.00162] | [0.00172] | [0.00776] | [0.00906] | |
| Overall | 0.4525 | 0.4575 | 0.5286 | 0.5866 |
| Observations | 73 | 72 | 72 | 72 |
This table presents panel regression results, where the dependent variable is the quarterly GDP growth rate (ΔGDP). The main independent variable of interest is the Amihud illiquidity measure (IRLM), which is used as a proxy for liquidity. Lags of the IRLM (t-1 to t-3) are included to capture dynamic effects. Columns (2) to (4) sequentially add control variables: the end-of-quarter sovereign bond yield spread (Y spread), quarterly growth in money supply (ΔM2), and quarterly stock market volatility (Vol). Column (4) includes year fixed effects. Significant standard errors are reported in brackets. *** p<0.01, ** p<0.05, * p<0.10.
Source: Prepared by the authors.
Interestingly, the second lag of the IRLM shows a positive and statistically significant effect on GDP growth, indicating a partial rebound in economic activity following the initial shock. This dynamic pattern suggests that liquidity shocks have a short-term contractionary effect, so their impact may be temporary, allowing for a delayed adjustment in investment or consumption behavior. Such short-term reversals may reflect the market’s ability to correct after initial overreactions, especially in environments where macroeconomic fundamentals remain relatively stable.
Our findings are consistent with the notion that liquidity shocks impair the financing of productive investments, raise the cost of capital, and contribute to macroeconomic fragility. The results align with the evidence reported by Næs et al. (2011) for developed markets, where liquidity was shown to anticipate cyclical turning points. Similarly, Florackis et al. (2014) found that stock market illiquidity negatively predicts GDP growth in the United Kingdom, especially during periods of low economic activity.
What distinguishes the present analysis is its focus on BRICS economies, where financial markets are less mature and potentially more sensitive to liquidity disruptions. The strong and immediate effect of liquidity observed here suggests that it may carry even greater information value in emerging markets, where alternative sources of financing are more limited.
Table 4 presents the results of the dynamic panel model estimations using the RS as an alternative proxy for market liquidity. Similar to the IRML, the results indicate a significant negative relationship between stock market liquidity and economic growth. However, notable differences emerge in terms of magnitude (see Table 4).
Table 4 Dynamic Panel Regressions of GDP Growth on Relative Bid/Ask Spread (RS)
| Δ GDP | ||||
|---|---|---|---|---|
| (1) | (2) | (3) | (4) | |
| ΔGDPt-1 | 0.497*** | 0.495*** | 0.370*** | 0.390*** |
| [0.0975] | [0.0996] | [0.110] | [0.115] | |
| RSt-1 | -0.465** | -0.463** | -0.201 | -0.525** |
| [0.230] | [0.235] | [0.253] | [0.250] | |
| RSt-2 | 0.267 | 0.264 | 0.226 | 0.213 |
| [0.243] | [0.250] | [0.244] | [0.285] | |
| RSt-3 | -0.317 | -0.329 | -0.109 | -0.374 |
| [0.212] | [0.218] | [0.231] | [0.229] | |
| Y spreadt-1 | 0.0184 | 0.0128 | 0.0489 | -0.0456 |
| [0.0782] | [0.0806] | [0.0797] | [0.0972] | |
| ΔM2 | 0.00339 | 0.00453 | 0.000871 | |
| [0.0232] | [0.0225] | [0.0245] | ||
| Vol | -0.987** | |||
| [0.412] | ||||
| Fixed Effects Year | No | No | No | Yes |
| Constant | 0.0113*** | 0.0116*** | 0.0214*** | 0.0148** |
| [0.00418] | [0.00437] | [0.00590] | [0.00739] | |
| Overall | 0.4013 | 0.4018 | 0.4439 | 0.4902 |
| Observations | 86 | 84 | 84 | 84 |
This table presents panel regression results, where the dependent variable is the quarterly growth rate of GDP (ΔGDP). The primary independent variable of interest is the relative bid/ask spread (RS), which serves as a proxy for liquidity. Lags of the RS (t-1 to t-3) are included to capture dynamic effects. Columns (2) to (4) sequentially add control variables: the end-of-quarter sovereign bond yield spread (Y spread), quarterly growth in money supply (ΔM2), and quarterly stock market volatility (Vol). Column (4) includes year fixed effects. Robust standard errors are reported in brackets. *** p<0.01, ** p<0.05, * p<0.10.
Source: Prepared by the authors.
The first lag of the Relative Bid/Ask Spread (RSt-1) shows a negative and statistically significant coefficient in three out of the four model specifications (columns 1, 2, and 4), with estimated values ranging from 0.46 to 0.52. This suggests that an increase in RS (higher transaction costs) is associated with a reduction in GDP growth in the following quarter. In contrast, the second and third lags of the RS variable are not statistically significant in any specification, implying that the impact of the RS on economic growth is short-lived and does not persist dynamically, unlike the pattern observed with the IRLM.
Market volatility (Vol) remains negative and statistically significant in model (3), reinforcing the evidence that higher market volatility tends to coincide with lower economic growth. Meanwhile, the control variables, term spread (Y spread) and money supply growth (ΔM2), do not show significant effects in any of the models, suggesting that RS carries an informational signal about GDP growth. Finally, the R² of the most comprehensive model (column 4) reaches 0.49, which is slightly lower than the explanatory power observed with the IRLM-based model (0.5866 in Table 3) (see Table 3). This suggests a modest loss of explanatory power when using the RS as the primary proxy for liquidity.
Our results are consistent with studies that highlight the role of the RS as an indicator of transaction costs and market friction, as shown by Jun et al. (2003), and more recently by Apergis et al. (2015), who validate the use of the RS as an effective measure of liquidity in emerging markets.
The significance of the first lag of the RS supports the argument by Næs et al. (2011), who contend that liquidity reflects investor confidence and can anticipate changes in real economic activity. However, unlike the IRLM, no compensatory effect is observed in the later lags, suggesting that the RS may better capture the contemporaneous impact of transaction costs, but not necessarily the full temporal dynamics of the market. Likewise, the fact that RS exhibits a more immediate but non-persistent effect is consistent with the findings of Galariotis and Giouvris (2015), who demonstrate that different liquidity proxies provide varying degrees of predictive power over the business cycle.
Figure 2 illustrates the behavior of the liquidity proxies during periods of economic recession in Brazil, Russia, India, China, and South Africa (see Figure 2). We can observe that during a recession, there is a decrease in liquidity in the stock market. Figure 3 provides additional information on the behavior of the liquidity proxies and the interest rate dynamics in Brazil, Russia, India, China, and South Africa (see Figure 3). It can be observed that during recession periods, there is a significant increase in the interest rates, with the most prominent peaks occurring during economic downturns.
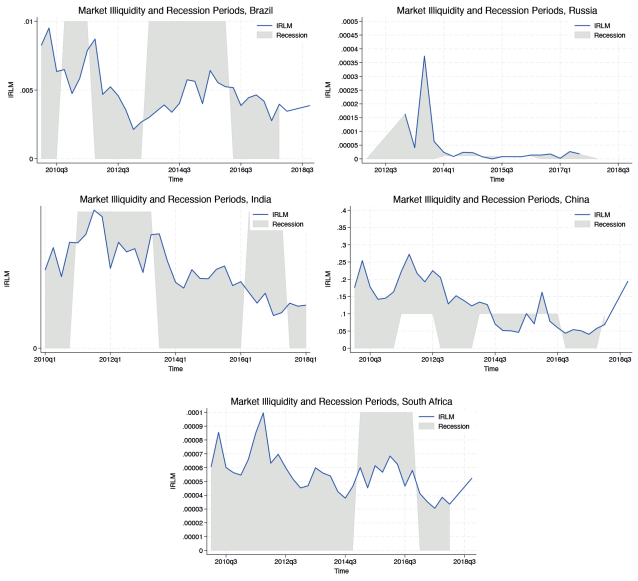
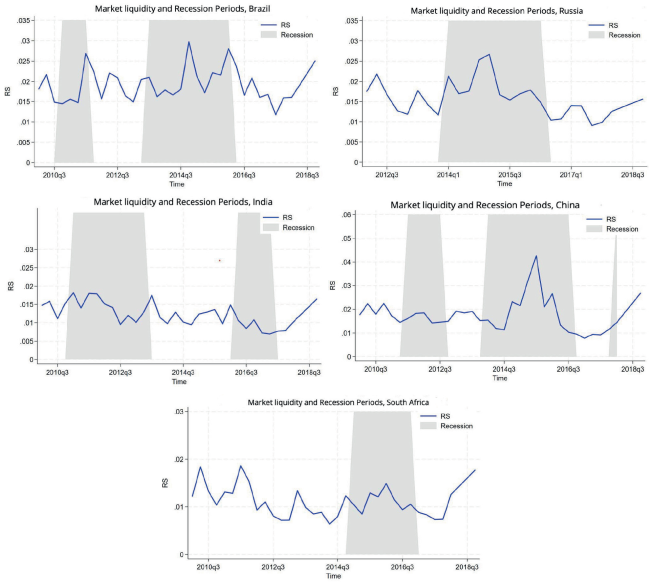
Table 5 presents the results of the probit model, which estimates the probability of an economic recession in the BRICS countries (see Table 5). The dependent variable in the model is a binary indicator of recession. In contrast, the independent variables include two proxies for market liquidity: the Relative Bid/Ask Spread (RS) and the IRLM, along with standard control variables, the sovereign bond yield spread (Y spread), growth in the money supply (ΔM2), and financial market volatility (Vol) (See Table 5).
Table 5 Probit Model
| Recession | Recession | |
|---|---|---|
| (1) | (2) | |
| RS | 1.096* | |
| [0.566] | ||
| IRLM | 3.938** | |
| [1.957] | ||
| Y spread | -53.00*** | -21.24 |
| [13.67] | [16.04] | |
| ΔM2 | -6.830 | -3.426 |
| [4.757] | [4.014] | |
| Vol | -30.51 | 66.22* |
| [53.95] | [39.27] | |
| Constant | 5.455* | -1.042 |
| [3.120] | [0.651] | |
| Pseudo R2 | 0.1491 | 0.0662 |
| AIC | 157.76 | 117.43 |
| BIC | 172.02 | 129.53 |
| Observations | 128 | 83 |
This table presents panel regression results, where the dependent variable is a dummy variable for recession, taking the value of 1 when a recession occurs and 0 otherwise. The independent variables are the relative bid/ask spread (RS) and the IRLM used as a proxy for liquidity. Other control variables are the end-of-quarter sovereign bond yield spread (Y spread), quarterly growth in money supply (ΔM2), and quarterly stock market volatility (Vol). Column (1) uses the RS as a measure of liquidity, and Column (2) uses the IRLM. Robust standard errors are reported in brackets. *** p<0.01, **p<0.05,*p<0.10.
Source: Prepared by the authors.
The results reveal that liquidity, as proxied by both the IRLM and the RS, significantly increases the probability of a recession. In Model (1), the RS coefficient is positive and statistically significant at the 10% level, indicating that wider bid/ask spreads, implying greater transaction costs and lower liquidity, are associated with a higher likelihood of economic contraction. In Model (2), the IRLM displays a stronger and more robust effect, significant at the 5% level, reinforcing its role as a leading indicator of macroeconomic fragility. This confirms that lower market liquidity systematically precedes downturns in economic activity across the BRICS economies.
Among the control variables, the yield spread is negative and highly significant in Model (1), consistent with the traditional interpretation that a flatter or inverted yield curve signals recession risks. However, this effect disappears in Model (2), likely due to the stronger explanatory power of the IRLM. Notably, market volatility becomes positive and significant in Model (2), suggesting that heightened volatility amplifies the adverse impact of liquidity on recession.
In terms of model performance, the IRLM-based specification shows superior fit (lower AIC and BIC values), underscoring the informational value of liquidity shocks in predicting macroeconomic downturns. These findings are consistent with previous studies, such as Florackis et al. (2014) and Næs et al. (2011), which found that stock market liquidity serves as a reliable early indicator of real economic activity, particularly during periods of heightened volatility. Overall, the evidence suggests that liquidity conditions in stock markets, particularly in emerging economies with more limited financing alternatives, may serve as effective predictors of recessions, complementing traditional indicators such as the term spread.
5. Conclusion
The relationship between stock market liquidity and economic growth is a crucial area of study, particularly in emerging markets where financial systems play a central role in supporting economic development. As shown by the sub-prime financial crisis, the drying up of liquidity in stock markets often serves as a precursor to broader economic downturns, highlighting the vital role liquidity plays in economic stability (Næs et al., 2011).
Our findings underscore this connection, as we observe that BRICS countries with more liquid stock markets tend to exhibit greater resilience against external shocks and more sound economic growth. Without sufficient liquidity, markets become less transparent, and price signals become distorted, resulting in inefficiencies in resource allocation.
Furthermore, a lack of liquidity exposes markets to higher volatility and instability. In times of heightened volatility or external shocks, illiquid markets are more vulnerable to abrupt price swings, which can exacerbate the severity of downturns (Muzaffar & Malik, 2024). Nevertheless, liquid markets possess a natural buffer, allowing for a smoother adjustment to adverse events. In this regard, liquidity serves as a stabilizing force, ensuring that markets can absorb shocks more effectively and maintain a degree of resilience in the face of external pressures.
Given the short-term impact of liquidity on economic growth, future research may explore whether or not behavioral biases exacerbate the impact of liquidity on economic growth. Those biases may include investors’ overconfidence, regret, or even market sentiment. In summary, fostering and maintaining stock market liquidity in countries where market capitalization constitutes a high proportion of the GDP is essential not only for the smooth functioning of daily trading but also for ensuring long-term economic stability and growth. Policymakers and market participants must prioritize mechanisms to foster stock market capitalization and enhance liquidity to safeguard against market disruptions and ensure sustainable development.

