


 nueva página del texto (beta)
 Inglés (pdf)
 Artículo en XML
 Referencias del artículo
 Enviar artículo por email
 Citado por SciELO
  Similares en
SciELO
Similares en
SciELO 
 Permalink
Introduction
Osteoporosis (OP) is a common chronic systemic disease, defined by a decrease in bone mineral density (BMD) with a progressive deterioration of bone tissue microarchitecture1,2. Worldwide, OP prevalence has been estimated to be 18.6% of the population, mostly in menopausal women3. In Chile the population pyramid is inverting as the elderly population is progressively increasing4. It is estimated that this demographic group will constitute an escalating proportion of patients treated for osteoporotic pathologies.
Spinal fractures are one of the most frequent OP associated pathologies, leading to an extensive source of morbimortality and resource expense. Therefore, it is essential to diagnose a decrease in BMD since it has been associated with postoperative complications2,5,6 such as additional fractures (pedicle and vertebral compression fractures), pseudoarthrosis, instrumentation failure due to poor fixation in osteoporotic bone or spinal disease progression due to altered biomechanics7.
Nowadays, dual-energy X-ray absorptiometry (DXA) through T-score calculator is the gold standard in the determination of BMD when diagnosing OP8-10.
Its accuracy ranges from 85 and 99%11. The World Health Organization (WHO) defines normal BMD within 1 standard deviation (SD) of the young adult mean (T-score > −1); osteopenia between −1 and −2.5 SD (T-score −1-2.5); and OP as BMD −2.5 SD (T-score < 2.5)10,12. DXA is a relatively affordable, low radiation and easy technique13. Nevertheless, most of osteoporotic fractures occur in patients with values above this threshold14, and its results may variate in patients with vertebral compression fractures, abdominal vessel calcifications, osteophytes, facet hypertrophy and spinal deformities15.
These limitations in DXA have prompted the search for other diagnostic methods for OP. Thereby, Hounsfield units (HU) have recently emerged as an alternative to BMD estimation in computed tomography (CT). Studies have shown a 86% sensitivity and 94% specificity for OP diagnosis16-20.
Over the last years, multiple studies have explored the validity of HU16-20 and demonstrated an adequate moderate to high correlation (r= 0.4-0.8) between BMD and HU10,16-20. Most patients that will undergo spinal surgery already have a CT scan as routine preoperative planning, providing an opportunity for OP examination. Furthermore, within the healthcare context, patients commonly undergo CT scans for various clinical indications, allowing opportunistic detection of OP.
Nowadays, this correlation has not been studied within the Chilean population. Thus, this study aims to determine the correlation between HU measured by opportunistic CT and DXA measured T-score to establish threshold values in healthy patients and female patients with OP in Clinica Alemana de Santiago.
Method
Study design
Analytical observational study with retrospective recruitment. The study was approved by the scientific ethics committee of Clínica Alemana de Santiago (CAS) and Universidad Del Desarrollo faculty of medicine. Code 2021-86.
Participants
Female Patients who had undergone abdomen-pelvic or lumbar CT scan and DXA for any diagnosis in our institution, within 6 months maximum. Recruitment was continuously done in CAS from April 2017 to November 2021. Inclusion criteria were > 50-year-old female. Patients with previous spinal surgery, undergoing tumoral pathology treatment and/or previous radiotherapy, rheumatic disease, hematological or metabolic bone disorders other than OP, and with a diagnosis of OP receiving medical treatment were excluded.
Measurements
DXA scans were performed using the G.E model ID XA densitometer. Standard CAS method. T-score was obtained through DXA scan in L1-L4 vertebrae. Patients were classified into three groups according to their DXA-obtained T-score (WHO recommendation). T-score < −2.5 was classified as OP, t-score −2.5-1.0 was classified as osteopenia, and t-score > 1.0 classified as Normal.
Imaging studies, abdomen-pelvic and/or lumbar CT, were performed by the following equipment: Siemens brand, 128-channel Somatom Definition AS model, General Electric, 64-channel Revolution GSI model, and Toshiba brand [Canon], 320 channel Aquilion One model. CT parameters included: A 2.0 mm slice thickness and a 1 mm slice interval or a 0.75 mm slice thickness and a 0.5 mm slice interval. All subjects were in a supine position with their arms up for spiral exploration of the lumbar spine, abdomen and pelvis.
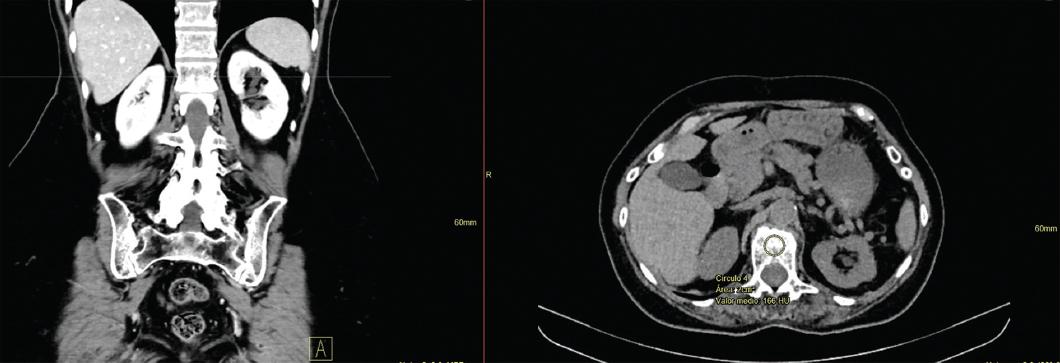
To determine HU, axial slice images with soft tissue windows at the L1 level were evaluated retrospectively using Enterprise imaging Xero viewer 8. 1. 4. 150. Soft tissue and bone windows were used to view the images. Coronal slices were used as a reference to locate L1. For measurement standardization, a 2 cm2 region of interest was determined within the trabecular bone in the L1 vertebral body, excluding the cortical margin. Then, the attenuation was measured through HU (Fig. 1).
Data analysis
Fisher's exact test was used for categorical data. One-way analysis of variance followed by post-hoc analysis with Bonferroni correction was used for continuous variables in independent samples. The correlation between HU and T-score was obtained through Pearsons correlation. A 144 subjects minimum sample size was calculated for a 0.4 correlation (r) with 95% confidence level and statistical power of 80%. Sensibility, specificity, and area under curve (AUC) of the receiver operating characteristic (ROC) curve were calculated for all three bone status groups. Maximum sensitivity and specificity criterion was utilized to determine the optimal cut-off point of HU in ROC curves. p < 0.05 values were considered statistically significant. Statav. 16 program was used.
Results
144 female patients were included in the data analysis (Table 1). The overall mean age was 68.39 years old. All patients were divided according to T-score. 52.1% were classified as osteopenia (−2.5-−1.0), followed by 36.8% with normal BMD (> −1.0) and 11.1% patients with OP (< −2.5). The mean age in each group was 69.49, 66.7, and 68.8, respectively. No significant differences were identified among them (p = 0.861).
Table 1 Group description according to BMD
| BMD | DXA | CT | ||
|---|---|---|---|---|
| Classification | n | Mean age (SD) | T-score (SD) | HU (SD) |
| Normal | 53 | 66.75 (8.7) | 0.3 (0.8) | 154.52 (38.9) |
| Osteopenia | 75 | 69.49 (8.5) | -1.72 (0.4) | 110.89 (30.7) |
| Osteoporosis | 16 | 68.68 (9.4) | -3.12 (0.4) | 89.4 (20.2) |
| Total | 144 | 68.39 (8.7) | -1.13 (1.3) | 124.56 (40.6) |
HU: Hounsfield Units; BMD: bone mineral density; DXA: dual-energy X-ray absorptiometry; CT: computed tomography; SD: standard deviation.
The mean HU value was 89.46 HU (SD = 20.2) for the group with OP, 110.87 HU (SD = 30.74) for the osteoporotic group, and 154.53 HU for the normal BMD group. These differences in HU values among groups were statistically significant (p < 0.01) (Fig. 2).
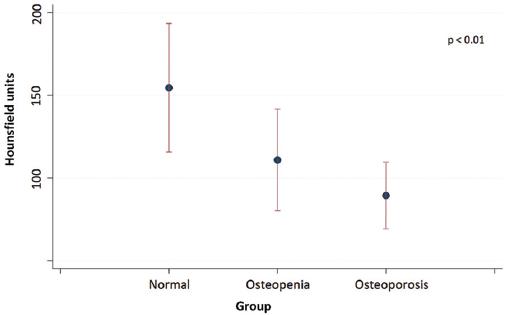
Figure 2 Mean Hounsfield Units (HU) values (± standard deviation), stratified by normal bone mineral density, osteopenia, and osteoporosis. (According to DXA reference standard). The differences in HU among the three sub-groups are statistically significant (p < 0.01).
For all patients, a moderate correlation of 0.6 was found between T-score and HU. This correlation was statistically significant (p < 0.001) (Fig. 3).
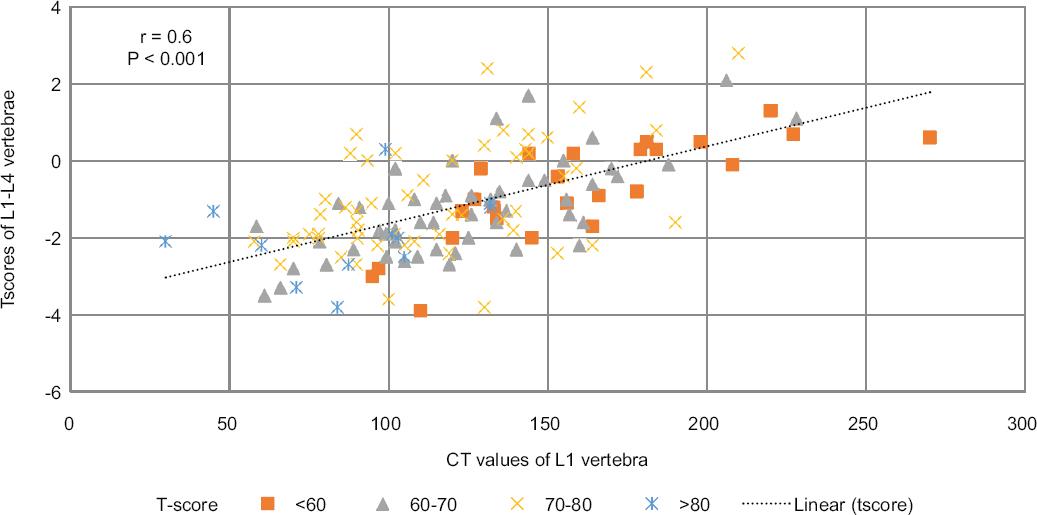
Figure 3 Scatterplots showing correlation between mean Hounsfield Units (HU) and T-score (r = 0.6, p < 0.001) in L1-4 vertebrae, stratified into age groups: less than< 60, 60-70, 70-80 and more than 80 years.
HU values as diagnostic cut-off point and ROC curves
The diagnostic capacity of HU through CT to differentiate OP from no OP (osteopenia, normal BMD) with an equilibrated cut-off point was 101 HU (75% sensibility, 75% specificity), (AUC 0.81 [IC 95% 0.72-0.9]). (Fig. 4A) 118 HU was determined as the cut-off value for high-sensitivity results (89% sensibility, 59% specificity). While 80 HU was determined as the cut-off value for high-specificity results (40% sensibility, 90% specificity). 126 HU was found to be the equilibrated cut-off point to discriminate normal BMD patients from osteopenia patients (79% sensitivity, 73% specificity), (AUC 0.8102 [IC 95% 0.766-0.9001]) (Fig. 4B). 155 HU was determined as a high sensibility value (89.3% sensitivity, 48% specificity) while 102 was determined as a high specificity value (52% sensitivity, 88.7% specificity).
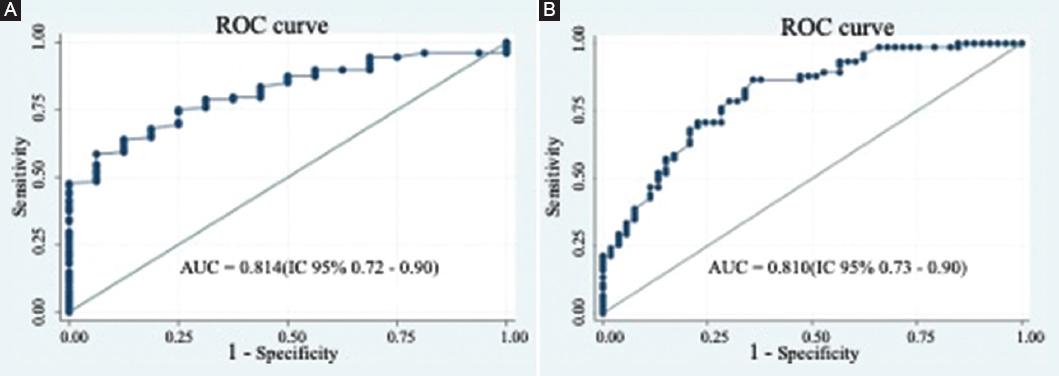
Figure 4 Receiver operating characteristics curves for computed tomography attenuation prediction performance with hounsfield units in L1 vertebrae, compared to DXA diagnostics. A: to discriminate non osteoporotic patients (osteopenia-normal bone mineral density [BMD]) from osteoporotic patients. B: to discriminate patients with normal BMD from osteopenia patients.
Discussion
Although BMD has been historically measured through DXA10-12-21, HU as a CT attenuation measure is considered an alternative method21,22-26. Our findings validate its use as an option for OP opportunistic diagnosis in the Chilean population.
Within our institution, we obtained a balanced cut-off point with adequate sensibility and specificity values compared to Gold Standard, AUC 0.81 (IC 95% 0.72-0.9). Recently, a systematic review by Pinto et al.24 determined that current data support the possibility of establishing a threshold value to diagnose OP with HU, measured through CT, with HU values ranging from 90.9 and 138.7 (IC 95% p < 0.001). Buckens et al.27 determined a 99 HU cut-off point in L1 vertebrae to diagnose OP, with balanced sensitivity (Sensibility = 62% and Specificity = 79%). Similarly, Kim et al.28, reported a 95 HU cut-off point for OP diagnosis (Sensitivity = 82% and Specificity = 66.4%).
Considering the validity, reproducibility, and numerous studies that report excellent interviewer variability16,21,29, the orthopedic surgeon may use these values in preoperative planning for OP screening. Also, it does not implicate additional costs or side effects22,26,30. Thus, low BMD diagnosis in preoperative planning can be timely and valid26,31,32.
Therefore, preoperative OP identification could optimize its diagnosis, perioperative management through appropriate treatment, and surgical strategies adapted to the patient's needs that would decrease postoperative complications24,25,33.
Study strengths and limitations
To our knowledge, this is the first study reported on the Chilean population. Literature findings correspond to our results, but we suggest a new study with a larger sample to guarantee the results credibility. Finally, the population studied was female, which could tend to differences in the cut-off points of the population general. We recommend national studies that include men and women.
Conclusion
Even though the implementation of CT measured HU for OP diagnosis needs to be corrected for optimal results, our findings suggest that it can be applied to national clinical practice, according to evaluation purposes. Thus, recognizing patients with < 101 HU in L1 vertebrae would allow an optimal identification of OP risk, justifying referral to specialists, additional treatment, and measures in surgical planning. Meanwhile patients with > 126 HU OP diagnosis could be excluded, avoiding further studies.

