


 nueva página del texto (beta)
 Inglés (pdf)
 Artículo en XML
 Referencias del artículo
 Enviar artículo por email
 Citado por SciELO
  Similares en
SciELO
Similares en
SciELO 
 Permalink
Introduction
Gastric cancer is the fifth most common type of cancer and the fourth most common cause of cancer-related death1. Gastric cancer is an aggressive disease with a poor prognosis; the 5-year survival was 5.3% for advanced disease and 68.8% for localized disease. The absolute number of diagnosis for gastric cancer has been increased although its global incidence decreases2. The treatment strategies of patients are tried to be guided according to the poor prognostic features determined through investigations on the relationship between prognosis and demographic, clinical, and histopathological variables in gastric cancer.
Inflammation in the tumor microenvironment stimulates malignant cell proliferation, angiogenesis, and metastasis, impairs the adaptive immune response, and promotes cancerous tissue survival3. Cancer-related inflammation, called the 7th hallmark of cancer, can be measured using cellular (white blood cell counts, neutrophils, lymphocytes, monocytes, and platelets) and humoral components4. It was shown that neutrophil (N) has an effect on cancer development and progression, monocyte (M) progression and metastasis, and lymphocyte (L) inhibits the proliferation of cancerous cells. The systemic inflammation response index (SIRI) was developed by incorporating these three parameters as M × N/L5,6. The SIRI was developed for the 1st time as a poor prognostic factor in pancreatic cancer, and later it was associated with many cancer types such as hepatocellular cancer, lung cancer, esophageal cancer, breast cancer, and oral squamous cancer5,7,8. Studies were shown that SIRI was correlated with some prognostic variables such as stage, tumor size, and lymphovascular invasion (LVI) in cancer patients, and can be a predictor of poor prognosis7,8. There are limited studies on the relationship between gastric cancer and SIRI. In these studies, reported from China, SIRI was shown as a poor prognostic factor6,9,10.
The purpose of this study is to investigate the relationship between SIRI and 3-and 5-year survival as well as to examine its relationship to demographic, clinical, and pathological data of gastric cancer in the Turkish population.
Method
This study consisted of 178 patients who underwent elective gastric surgery with a diagnosis of gastric adenocancer between January 2011 and December 2016 to achieve 5-year survival, retrospectively. This study was performed in line with the principles of the Declaration of Helsinki. Approval was granted by the Local Ethics Committee.
The study included men and women over 18 years of age with gastric adenocancer who were operated under elective conditions. Exclusion criteria were as follows: (1) post-operative mortality in the first 30 days, (2) metastasis, positive surgical margins, or < 15 lymph node extraction (both D1 and D2 lymph node dissection), (3) receiving neoadjuvant therapy, (4) patients with chronic hematological or inflammatory diseases, and known additional cancers dialysis patients, (5) patients had blood transfusions up to 2 months before the operation. Patients' age, gender, preoperative laboratory results (CEA, CA19-9, N, M, and L), tumor location and Borrmann Classifications according to gastroscopy results, type of gastrectomy (total/subtotal), lymph node resection width (D1/D2), post-operative pathology results (tumor size, tumor-node-metastasis [TNM] stage-AJCC), In the 8th edition of the Gastric Cancer Staging System, the degree of differentiation, the presence of LVI, and the presence of perineural invasion (PI) were used in the analyses.
SIRI was calculated using N×M/L formula. The cutoff value was determined for SIRI by performing a Receiver operating characteristic (ROC)-curve analysis. According to this value, the patients were divided into two groups: group 1, which had a SIRI value of low, and group 2, which had a SIRI value of high.
Statistical analyses were performed using SPSS (Statistical Package for the Social Sciences, SPSS Version 15.0, Chicago, IL). The descriptive statistics of the patients were presented as mean ± standard deviation (SD) or median (minimum-maximum) depending on the normality assumption being met for numerical variables and frequency (percentage) for categorical variables, respectively. Comparisons were made using the Independent Samples t-test or Mann-Whitney U test for numerical variables and the Chi-square test for categorical variables. The normality of the numerical variables was assessed with the Kolmogorov-Smirnov test. The Kaplan-Meier method was implemented to construct the 3-and 5-year survival curves, and the equality of the 3-and 5-year survival distributions was compared with the Mantel-Cox (log-rank) test. The effect of the prognostic factors on 3-and 5-year survival was assessed with the Cox Proportional Hazards Model. Variables that had a p < 0.20 were included in the Multiple Cox Model, and the Backward Likelihood Ratio Test methods were used for variable selection. The p < 0.05 was considered as statistically significant.
Results
The analyses were conducted using the information of 178 patients who met the criteria. There were 60 (33.7%) female and 118 (66.3%) male patients. The mean age of the patients was 61.74 ± 11.43. In 97 patients (54.5%), a total gastrectomy was performed. There were 20 (11.2%) Stage 1 patient, 45 (25.3%) Stage 2 patients, and 113 (63.5%) Stage 3 patients. Only five out of 178 gastric adenocarcinoma patients had signet ring cell subtypes, while pathological results revealed signet ring cells in 41 (23%) patients whose signet cells were present on final pathology but not enough percentage to be labeled as a signet ring cell subtype. LVI was detected in 112 (68.5%) patients and PNI (66.9%) was detected in 119 patients. When the ROC curve was made for SIRI, the area under the curve was 0.564 and the cut-off point was determined as 1.35. There were 77 (43.3%) patients in the group 1 (SIRI ≤ 1.35) and 101 (56.7%) in the group 2 (SIRI > 1.35).
There was a statistically significant correlation between Group 2 and tumor size, advanced T stage (T3 and T4 disease), advanced disease (Stage 2/Stage 3 disease), and CA 19-9 level (p = 0.039, p = 0.001, p < 0.001, p = 0.013, respectively) (Table 1).
Table 1 Demographic, 0clinical, and pathological data
| Variables | Group 1 (SIRI ≤ 1.35) n = 77 (43.3%) | Group 2 (SIRI > 1.35) n = 101 (56.7%) | p |
|---|---|---|---|
| Age (year), mean ± SD | 61.32 ± 11.94 | 62.05 ± 11.07 | 0.676 |
| Gender | 0.342 | ||
| Female | 29 (37.66) | 31 (30.69) | |
| Male | 48 (62.34) | 70 (69.31) | |
| Localization | 0.470 | ||
| Kardia | 15 (19.48) | 25 (24.75) | |
| Non-kardia | 62 (80.52) | 76 (75.24) | |
| Borrmann classification | 0.156 | ||
| Type 1 | 17 (22.08) | 15 (14.85) | |
| Type 2 | 26 (33.77) | 30 (29.70) | |
| Type 3 | 29 (50.65) | 44 (43.55) | |
| Type 4 | 0 | 6 (5.95) | |
| Type 5 | 5 (6.50) | 6 (5.95) | |
| Surgery | 0.879 | ||
| Total gastrectomy | 41 (53.25) | 56 (55.45) | |
| Subtotal gastrectomy | 36 (46.75) | 45 (44.55) | |
| Lymph node dissection | 1.000 | ||
| D1 | 6 (7.79) | 9 (8.91) | |
| D2 | 71 (92.21) | 92 (91.09) | |
| Tumor size, cm, median (min-max) | 5.50 (0.70-25.0) | 6.00 (2.00-17.00) | 0.039* |
| T stage | 0.001* | ||
| T1 | 14 (18.18)a | 2 (1.98)a | |
| T2 | 7 (9.10)a,b | 5 (4.95)a,b | |
| T3 | 39 (50.65)b | 64 (63.37)b | |
| T4 | 17 (22.07)b | 30 (29.70)b | |
| N stage | 0.554 | ||
| N0 | 25 (32.46) | 27 (26.73) | |
| N1 | 6 (7.79) | 12 (11.88) | |
| N2 | 13 (16.88) | 23 (22.77) | |
| N3 | 33 (42.85) | 39 (38.62) | |
| TNM stage | <0.001* | ||
| Stage 1 | 17 (22.08)c | 3 (2.97)c | |
| Stage 2 | 12 (15.58)d | 33 (32.67)d | |
| Stage3 | 48 (62.34)d | 65 (64.36)d | |
| Differentiation degree | 0.291 | ||
| Poor | 37 (48.05) | 57 (56.44) | |
| Moderate/Well | 40 (51.95) | 44 (43.56) | |
| Signet ring cell | 0.858 | ||
| Presence | 17 (22.08) | 24 (23.76) | |
| Absence | 60 (77.92) | 77 (76.24) | |
| Lymphovascular invasion | 0.417 | ||
| Presence | 50 (64.94) | 72 (71.29) | |
| Absence | 27 (35.06) | 29 (28.71) | |
| Perineural invasion | 0.053 | ||
| Presence | 45 (58.44) | 74 (73.27) | |
| Absence | 32 (41.56) | 27 (26.73) | |
| CEA,(U/mL), Median (Min-Max) | 1.84 (0.61-65.80) | 1.94 (0.37-350.71) | 0.376 |
| CA19-9, (U/mL), Median (Min-Max) | 9.63 (0.60-4351.00) | 16.30 (0.001-460.20) | 0.013* |
*Statistically significant difference. ab,cd: There was a statistically significant difference between those grouped with different letters. SD: standard deviation; cm: centimeter; T: tumor; N: nodal status; TNM: tumor-node-metastasis; CEA: carcinoembryonic antigen; CA 19-9: carbohydrate antigen 19-9.
The 3-year survival rate was 51.1%, and the 5-year survival rate was 42.7%. The 3-year and 5-year survival rates in group 2 were significantly lower than those in group 1, according to the Kaplan-Meier curve and log-rank test (p = 0.014 and p = 0.027, respectively) (Figs. 1 and 2).
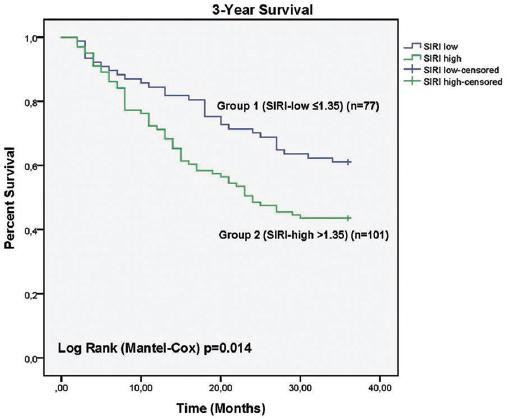
Figure 1 Systemic inflammation response index low and systemic inflammation response index high Group 3 years follow-up, Kaplan-Meier Analysis.
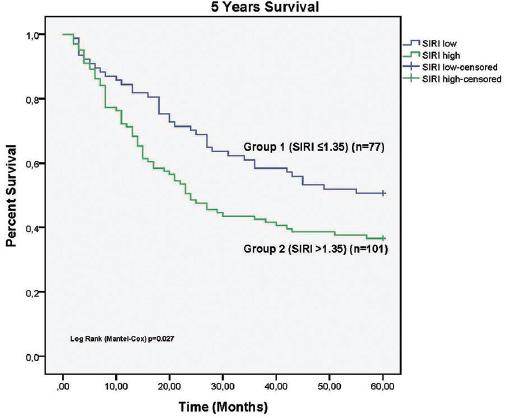
Figure 2 Systemic inflammation response index low and systemic inflammation response index high Group 5 years follow-up, Kaplan-Meier Analysis.
According to univariate analyses, age, tumor size, T stage, N stage, TNM stage, signet ring cell presence, and PI presence were associated significantly with 3-year survival. SIRI value is also related to 3-year survival (hazard ratio (HR): 1.321, 95% CI: 1.102-1.584, p = 0.003) (Table 2). According to univariate analysis, T stage, N stage, TNM stage, signet ring cell presence, and PI presence had a significant correlation with 5-year survival. Furthermore, SIRI was associated with the highest 5-year survival (HR: 1.261, 95%CI: 1.062-1.498, p = 0.008) (Table 3).
Table 2 Univariate and multivariate survival analysis for 3 years followed up
| Variables | Univariate analysis | Multivariate analysis | ||
|---|---|---|---|---|
| HR (95% CI) | p | HR (95% CI) | p | |
| Age (year) | 1.021 (1.002-1.040) | 0.030* | 1.024 (1.002-1.047) | 0.031* |
| Male gender | 1.312 (0.829-2.077) | 0.246 | ||
| Non-kardiac localization | 1.026 (0.623-1.691) | 0.920 | ||
| Borrmann classification | 0.639 | |||
| Type 1 | Reference | |||
| Type 2 | 1.255 (0.645-2.442) | 0.504 | ||
| Type 3 | 1.496 (0.798-2.803) | 0.209 | ||
| Type 4 | 2.013 (0.656-6.179) | 0.222 | ||
| Type 5 | 1.080 (0.385-3.209) | 0.884 | ||
| Total gastrectomy | 1.480 (0.962-2.277) | 0.075 | ||
| D2 lymph node dissection | 0.698 (0.361-1.349) | 0.285 | ||
| Tumor size, cm | 1.054 (1.002-1.108) | 0.043* | ||
| T Stage | 0.023* | |||
| T1 | Reference | |||
| T2 | 0.286 (0.032-2.556) | 0.263 | ||
| T3 | 2.247 (0.813-6.211) | 0.119 | ||
| T4 | 3.063 (1.076-8.722) | 0.036 | ||
| N stage | 0.001* | |||
| N0 | Reference | |||
| N1 | 1.263 (0.485-3.287) | 0.632 | ||
| N2 | 2.602 (1.321-5.122) | 0.006 | ||
| N3 | 3.094 (1.698-5.637) | < 0.001 | ||
| TNM stage | < 0.001* | 0.001* | ||
| Stage 1 | Reference | Reference | ||
| Stage 2 | 1.435 (0.468-4.403) | 0.527 | 0.960 (0.300-3.071) | 0.945 |
| Stage 3 | 3.928 (1.432-10.772) | 0.008 | 2.920 (1.016-8.387) | 0.047 |
| Poor differentiation | 1.254 (0.821-1.916) | 0.295 | ||
| Signet ring cell presence | 2.013 (1.286-3.153) | 0.002* | 1.772 (1.074-2.924) | 0.025* |
| Lymphovascular invasion presence | 1.571 (0.961-2.568) | 0.072 | ||
| Perineural invasion presence | 1.715 (1.048-2.804) | 0.032 | ||
| CEA, (U/mL) | 1.004 (0.999-1.008) | 0.093 | ||
| CA19-9, (U/mL) | 1.000 (1.000-1.001) | 0.562 | ||
| SIRI | 1.321 (1.102-1.584) | 0.003* | 1.367 (1.105-1.689) | 0.004* |
(*) Statistically significant difference. HR: hazard ratios; CI: confidence interval; cm: centimeter; T: tumor; N: nodal status; TNM: tumor-node-metastasis; CEA: carcinoembryonic antigen, CA 19-9: carbohydrate antigen 19-9; SIRI: systemic inflammation response index.
Age, TNM stage, and signet ring cell presence were found to be associated with 3-year survival after multivariate analyses (Table 2). Multivariate analysis also showed that a high SIRI value was significantly associated with 3-year survival (HR: 1.367, 95% CI: 1.105-1.689 p = 0.004) (Tables 2 and 3). According to the multivariate analysis, it was observed that age, TNM stage, and signet ring cell presence were relevant to 5-year survival. The high SIRI value was also significantly associated with 5-year survival (HR: 1.304, 95%CI: 1.069-1.592, p = 0.009) (Table 3).
Table 3 Univariate and multivariate survival analysis for 5 years followed up
| Variables | Univariate analysis | Multivariate analysis | ||
|---|---|---|---|---|
| HR (95% CI) | p | HR (95% CI) | p | |
| Age (year) | 1.017 (1.000-1.035) | 0.051 | 1.021 (1.002-1.041) | 0.034* |
| Male gender | 1.299 (0.852-1.982) | 0.224 | ||
| Non-kardiac localization | 0.993 (0.624-1.581) | 0.978 | ||
| Borrmann classification | 0.328 | |||
| Type 1 | Reference | |||
| Type 2 | 1.091 (0.590-2.017) | 0.781 | ||
| Type 3 | 1.506 (0.854-2.657) | 0.158 | ||
| Type 4 | 2.233 (0.816-6.106) | 0.118 | ||
| Type 5 | 1.078 (0.422-2.756) | 0.875 | ||
| Subtotal gastrectomy | 0.754 (0.509-1.117) | 0.159 | ||
| D2 lymph node dissection | 0.796 (0.414-1.530) | 0.493 | ||
| Tumor size, cm, | 1.050 (1.002-1.100) | 0.043* | ||
| T stage | 0.032* | |||
| T1 | Reference | |||
| T2 | 1.140 (0.285-4.558) | 0.853 | ||
| T3 | 2.947 (1.072-8.103) | 0.036 | ||
| T4 | 3.438 (1.210-9.772) | 0.020 | ||
| N stage | < 0.001* | |||
| N0 | Reference | |||
| N1 | 1.392 (0.601-3.225) | 0.441 | ||
| N2 | 2.622 (1.406-4.888) | 0.002 | ||
| N3 | 3.190 (1.842-5.522) | < 0.001 | ||
| TNM stage | < 0.001* | < 0.001* | ||
| Stage 1 | Reference | Reference | ||
| Stage 2 | 2.070 (0.701-6.118) | 0.188 | 1.464 (0.479-4.476) | |
| Stage 3 | 5.003 (1.829-13.685) | 0.002 | 3.702 (1.629-12.786) | 0.014 |
| Poor differentiation | 1.239 (0.838-1.831) | 0.283 | ||
| Signet ring cell presence | 2.174 (1.435-3.295) | < 0.001* | 1.915 (1.210-3.030) | 0.006* |
| Lymphovascular invasion presence | 1.510 (0.967-2.359) | 0.070 | ||
| Perineural invasion presence | 1.776 (1.129-2.792) | 0.013* | ||
| CEA, (U/mL) | 1.004 (0.999-1.008) | 0.102 | ||
| CA19-9, (U/mL) | 1.000 (1.000-1.001) | 0.242 | ||
| SIRI | 1.261 (1.062-1.498) | 0.008* | 1.304 (1.069-1.592) | 0.009* |
(*) Statistically significant difference. HR: hazard ratios; CI: confidence interval; cm: centimeter; T: tumor; N: nodal status; TNM: tumor-node-metastasis; CEA: carcinoembryonic antigen; CA 19-9: carbohydrate antigen 19-9; SIRI: systemic inflammation response index.
Discussions
The severity of cancer-related inflammation can be measured by cells such as neutrophils, lymphocytes, monocytes, and leukocytes in peripheral blood, and indices created with different combinations of these cells can show the severity of cancer-related inflammation3,4. Neutrophils, the first cells of the immune response to inflammation, can promote tumor progression by inducing tumor cell proliferation, stimulating angiogenesis, and deactivating antitumor immunity11. Monocytes, which migrate to other tissues in the body and turn into macrophages, and whose number increases in the peripheral circulation with the activation of the immune system, exhibit prognostic value in diseases such as cancer, chronic kidney disease, and pneumonia12. After tumor-induced immune regulation, the first line of defense against tumor cells, monocytes and macrophages become tumor-supportive and aid in tumor growth, angiogenesis, invasion, and metastasis12. Lymphocytes show an antitumor effect and prevent tumor progression, and studies showed that lymphopenia is associated with low survival in cancers13. SIRI was developed using these three parameters, which are known to be associated with the development of cancerous tissue and which are one of the indexes showing the severity of inflammation in cancer7,8.
In this study, the relationship between SIRI and 3-year survival, and 5-year survival as well as clinical and pathological features of gastric cancer was investigated. The 3- and 5-year survival was better in the SIRI low group. Furthermore, the SIRI highness was found to be significantly associated with the T stage, TNM stage, tumor size, and CA19-9 levels.
SIRI is a parameter that was defined in 2016 and is associated with prognosis in different types of malignancies5,7,8. It was shown that high SIRI is associated with poor prognosis when evaluated alone or in combination with parameters such as fibrinogen and albumin when it is considered specifically for gastric cancer6,9,10. However, these studies were of Chinese origin. There were no studies on its effectiveness in different societies. To the best of our knowledge, this is the first study conducted by a Turkish/Western society on gastric cancer. In this study, it was shown that there is a statistically significant relationship between high SIRI and poor prognosis in both 3-year and 5-year survival rates and that SIRI is an independent variable of survival. Furthermore, the statistical relationship between 3-year survival and SIRI appears to be more significant than the statistical relationship between 5-year survival and SIRI, and this can be considered a stronger predictor of SIRI value in post-operative early-period surveillance.
The TNM classification is the most important independent prognostic factor in gastric cancer, and it is the main guiding factor in the treatment of patients14. The TNM staging system, published by the American Joint Commission on Cancer, and constantly revised with up-to-date data, was last updated with the 8th edition in 201615. It is tried to reach a prediction about the extent of the tumor in the tissue, the severity of the tumor, and the prognosis of the disease by evaluating the T stage indicating the depth of the tumor in the tissue, the N stage determined by the number of lymph nodes to which the tumor has spread, with at least 15 lymph nodes, and the M stage indicating the distant organ metastasis of the tumor14,15. In our study, it was shown that there was a significant difference between SIRI elevation and patients with Stage 1 and Stage 2-3 in the TNM staging system, and the SIRI elevation was higher in Stage 2-3 patients with a worse prognosis. When we looked at the subgroups of TNM staging, it was seen that there was a difference between T1-T2 groups and T3-T4 groups at the T stage, and SIRI was statistically higher in T3-T4 groups. In addition, no relationship was found between the N stage and SIRI elevation in our study, and when patients with distant metastases were not included, the relationship with the M stage and its relationship with patients with TNM Stage 4 could not be evaluated. Consistent with the literature, T stage, N stage, and TNM stage gave significant results in both 3- and 5-year survival in univariate analyses, but when multivariate analyses were examined, only TNM staging for both 3- and 5-year survival gave a statistically significant result.
The effect of gastric cancer tumor size on prognosis is controversial. In previous studies, it was shown that tumor size may increase the depth of tumor invasion and lymph node/distant metastasis, that is, as the size increases, the success of en-bloc resection may decrease. Hence, there may be a significant relationship between tumor size and prognosis16. In our study, it was seen that the SIRI is significantly higher in patients with high tumor sizes (p = 0.009). Therefore, as the tumor size increases, cancer-related inflammation also increases. In addition, while tumor size was statistically associated with poor prognosis for both 3-year survival and 5-year survival in univariate analysis, this effect could not be seen in multivariate analysis.
CA 19-9 is a Lewis blood group antigen, not secreted in approximately 5-7% of the population, is thought to affect cell adhesion, and can be secreted from normal epithelial cells such as the gallbladder, pancreas, stomach, and prostate17. It is known that CA 19-9 is increased in many types of cancer, especially pancreatic adenocarcinoma as well as non-malignant diseases such as cholecystitis, pancreatitis, diabetes mellitus, and autoimmune disorders17. The relationship between CA 19-9 and gastric cancer is unclear. Studies are showing that CA19-9 elevation is associated with lymph node metastasis and CA19-9 positivity at the time of recurrence is poor prognostic18,19. CA 19-9 might be used as a marker in gastric cancer, especially in advanced cases as a prognostic marker to predict recurrence/metastasis and post-treatment follow-up but cannot be used in early diagnosis and screening17. In this study, the relationship between CA 19-9 level and prognosis could not be demonstrated. However, it has been shown that CA 19-9 level is associated with SIRI, which is a poor prognostic factor. The CA 19-9 level is higher in the group with high SIRI.
Some limitations exist in our retrospective study. The surgical records of the patients were used to determine the D1 and D2 lymph node dissections. Furthermore, TNM staging was reported in patients who had more than 15 lymph nodes removal, depending on pathological findings.
Conclusions
In this study, there was a significant relationship between high SIRI and 3- and 5-year survival, and high SIRI was associated with poor survival. In addition, this study was the first in the West for gastric cancer to show a survival relationship with SIRI. Furthermore, a relationship was found between high SIRI and advanced TNM stage, advanced T stage, larger tumor size, and high CA19-9 levels, which are poor prognostic factors of gastric cancer. This is valuable for predicting prognosis before treatment with a low-cost and standardized test.

