


 nueva página del texto (beta)
 Inglés (pdf)
 Artículo en XML
 Referencias del artículo
 Enviar artículo por email
 Citado por SciELO
  Similares en
SciELO
Similares en
SciELO 
 Permalink
Introduction
In addition to providing perioperative regional anesthesia, spinal anesthesia (SA) has many advantages such as controlling the sympathetic response that develops in response to surgical stress, post-operative analgesia, and shortening the recovery period with early mobilization followed by early discharge1. SA can be preferred for short-term surgeries, such as lower extremity venous insufficiency, where SA provides sufficient surgical comfort. With the development of technology, new surgical techniques such as laser and radiofrequency ablation have started to be preferred frequently in the treatment of lower extremity varicose veins2. Chronic venous insufficiency may cause not only cosmetic but also life-threatening consequences such as embolism. Therefore, early mobilization is important for the treatment processes.
On the other hand, hypotension due to SA (HSA) is a condition with a high incidence of 70%, impairing patient comfort and anesthesia quality and increasing morbidity3. It is thought that HSA develops due to a decrease in the preload as a result of vasodilation of veins and venous blood pooling due to a decrease in peripheral vascular resistance4.
Patient's basic peripheral vasomotor-sympathetic tone and volume status are among the criteria determining the risk of developing HSA5. It is important to predict the risk of developing HSA and take precautions to ensure that the patient has a more stable surgery. For this purpose, existing parameters were evaluated and some invasive and non-invasive hemodynamic measurements were developed. Pleth variability index (PVI) is one of these measurements that automatically calculates respiratory variables in pulse oximetry amplitude and predicts fluid response. PVI is calculated by measuring the dynamic changes in the perfusion index, defined as the ratio of the non-pulsatile flow to the pulsatile flow in the capillary bed during a respiratory cycle6.
Another non-invasive method used to determine volume status is ultrasonography of inferior vena cava (USG IVC) diameter measurement7. The use of ultrasonography (USG) has advantages such as being simple, non-invasive, and reproducible.
The case of being able to predict HSA will give clinicians the opportunity to be prepared and take preventive measures. Therefore, in our study, we aimed to determine the predictability of the risk of developing HSA by measuring PVI and USG IVC diameter and area and the reliability of these methods in patients who underwent SA due to peripheral varicose surgery.
Method
After the approval of the Ethics Committee (date: 19 October 2018, number: 54132726-000-22167) and the informed consents of the patients were obtained, the study was conducted in the Department of Anesthesia and Reanimation of the Health Sciences University Ümraniye Training and Research Hospital between January 2019 and May 2019, as a cross-sectional, observational, and prospective study on the patients who were planned to undergo elective lower extremity varicose vein surgery under SA. It was chosen because it is short-them and would not affect the patient's volume status as there is no blood loss.
The patients who were between 18 and 65 years of age, with American Society of Anesthesiologists (ASA) physical status classification I-II, without cardiac disease, no contraindications for SA and no diagnosis of diabetes mellitus or hypertension were included in the study. Patients who did not give consent and/or gave up participating the study and patients whose SA procedure were unsuccessful were excluded from the study.
HSA was defined as a 25% decrease in systolic arterial pressure from the value measured before the SA or a decrease in systolic blood pressure (SBP) more than 90 mmHg within the first 10 min after SA. The patients who developed HSA were recorded as "Group 1" and the patients who did not develop as "Group 2".
The number of patients in Groups 1 and 2 was determined by taking the patients who met the study criteria in a certain time interval into account according to the power analysis performed in line with the sample study (n = 30 for group 1 and n = 34 for group 2).
All patients included in the study were administered 2 mg midazolam IV in the pre-operative care unit. Afterward, IVC diameter measurements were made in the supine position with USG and PVI values were recorded using Masimo Radical 7 pulse oximetry.
IVC measurements were made using Toshiba Istyle Aplio Xg ultrasound device, with a 4 MHz convex probe, using the liver window from the 7th intercostal space on the anterior axillary line while the patient was in the supine position. In cases where a quality image could not be obtained from the 7th intercostal space, measurements were made from the 6th or 8th intercostal space. The widest IVC image in the interval between the left renal vein and hepatic vein pouring into the IVC was recorded at the end of the expiration and p wave, and anteroposterior, transverse diameters and area were measured. Measurements were made at the end of the expiration and by the same person using the device in all patients. PVI measurements were recorded on the Masimo Radical 7 monitor by attaching the pulse-oximetry probe to the index finger of the right hand in all patients.
After the measurements, the patients were taken to the operating room and 5 mL/kg 0.9% NaCl IV infusion was given in 30 min for hydration. Standard monitoring, pulse oximetry (oxygen saturation), non-invasive SBP, diastolic blood pressure (DBP), mean arterial pressure (MAP) measurements, and three-lead precordial electrocardiogram monitoring were performed.
SA was administered to all patients in a sitting position under sterile conditions with a 26-gauge spinal needle and 15 mg 0.5% heavy bupivacaine intrathecally in L3-L4 interspace. Unsuccessful SA was defined as inability to enter the interspace after a maximum of 3 attempts, failure to achieve T10 block level within 10 min, and pain in the first 10 min intraoperatively. Patients who had unsuccessful attempts within these interspaces were switched to general anesthesia and these patients were excluded from the study.
Demographic data (age, gender, height, weight, body mass index [BMI], ASA, and additional diseases) of the patients participating in the study were recorded. SBP, DBP, and MAP values were recorded before SA, at the time of performing the SA (minute =0), and at the 5th, 10th, 15th, 20th, 25th, and 30th min after SA.
At the end of the operation, the patients were followed up in the post-operative recovery room for 20 min.
Statistical analysis
While evaluating the findings obtained in the study, IBM Statistical Package for the Social Sciences (SPSS) Statistics 22 (IBM SPSS, Turkey) program was used for statistical analysis. The conformity of the parameters to the normal distribution was evaluated with the ShapiroWilk normality test and it was determined that all parameters were normally distributed. Students t-test was used for the comparison of parameters between two groups and paired samples t-test was used for intragroup comparisons. Continuity (Yates) Correction was used to compare qualitative data. The most appropriate cutoff values were chosen based on the receiver operating characteristic (ROC) curve analysis. Statistical significance was evaluated at the p < 0.05 level.
The ROC curve is one of the most important evaluation criteria to control the performance of any classification model. When each value is accepted as the cut-off value for a positive result, sensitivity (sensitivity) and specificity (specificity) values are predicted for the diagnosis of the disease. At the end of the analysis, as the value indicated as area under the curve (AUC) approaches 1, the diagnostic value increases8,9. The diagnostic value of PVI and IVC diameter measurements for patients who developed SHA was evaluated with ROC curves and AUC.
Results
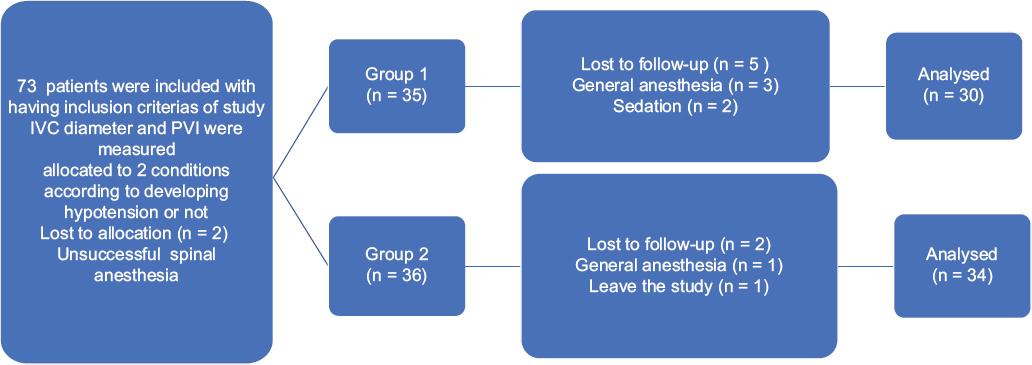
The study was conducted with a total of 64 patients (27 [42.2%] males and 37 [57.8%] females) aged between 22 and 65, with a mean age of 44.80 ± 10.74 years (Group 1= 30 [46.8%], Group 2 = 34 [53.1%]). A total of 73 patients who met the criteria were included in the study. Eight patients were excluded from the study because SA was unsuccessful for two patients, SA was switched to general anesthesia due to pain after the operation started for four patients sedation was given because the patient was incompatible for two patients, and one of them wanted to leave the study after SA was applied (Fig. 1).
Demographic data such as age, height, weight, BMI, gender distribution, and ASA scores of the patients were similar among the groups (p > 0.05; Table 1). Therefore, the patient's comorbidities did not affect our outcomes and findings.
Table 1 Comparison of the groups in terms of demographic characteristics
| Demographic Characteristics | Group 1 | Group 2 | p |
|---|---|---|---|
| Mean ± SD | Mean ± SD | ||
| Age (year) | 46.87 ± 10.48 | 42.97 ± 10.79 | 0.149* |
| Height (cm) | 1.8 ± 0.08 | 1.69 ± 0.08 | 0.764¨ |
| Weight (kg) | 86.3 ± 17.59 | 81.79 ± 16.6 | 0.296* |
| BMI | 30.65 ± 6.97 | 28.54 ± 4.86 | 0.171* |
| Gender | n (%) | n (%) | p |
| Male | 13 (43.3) | 14 (41.2) | 1.000† |
| Female | 17 (56.7) | 20 (58.8) | |
| ASA | n (%) | n (%) | p |
| 1 | 14 (46.7) | 8 (23.5) | 0.093† |
| 2 | 16 (53.3) | 26 (76.5) | |
BMI: body mass index.
*Student t test;
†continuity (yates) correction.
The decrease in the measurements made at the 10th min and later in SBP and MAP, and only at the 15th min in DBP in Group 1 was statistically significant compared to Group 2 (p < 0.05); (Table 2 and Fig. 2). When PVI and IVC diameter (AP) and IVC diameter (transverse section), IVC area measurements were compared between the groups, the mean PVI was significantly higher in Group 1 compared to Group 2 (p = 0.000). IVC AP diameter, transverse diameter, and mean area were significantly higher in Group 2 than Group 1 (p = 0.002, p = 0.000, and p = 0.001, respectively); (Table 3).
Table 2 Evaluation of the groups in terms of SBP, DBP, and MAP
| SBP | Group 1 | Group 2 | p |
|---|---|---|---|
| Mean ± SD | Mean ± SD | ||
| Before spinal anesthesia | 156.4 ± 26.37 | 148.18 ± 19.94 | 0.162 |
| 0 min | 143.47 ± 31.88 | 142.26 ± 20.21 | 0.86 |
| 5 min | 127.77 ± 23.56 | 133.59 ± 19.99 | 0.289 |
| 10 min | 117.93 ± 20.71 | 131.26 ± 19.49 | 0.011* |
| 15 min | 118.2 ± 18.56 | 129.79 ± 16.15 | 0.010* |
| 30 min | 118.3 ± 15.07 | 130.71 ± 16.19 | 0.002* |
| DBP | Group 1 | Group 2 | p |
| Mean ± SD | Mean ± SD | ||
| Before spinal anesthesia | 96.73 ± 18.34 | 92.74 ± 16.9 | 0.368 |
| 0 min | 83.73 ± 19.51 | 85.82 ± 15.18 | 0.632 |
| 5 min | 76.37 ± 20.72 | 82.91 ± 18.34 | 0.185 |
| 10 min | 73.1 ± 20.41 | 80.53 ± 14.96 | 0.099 |
| 15 min | 69.03 ± 17.83 | 78.18 ± 12.34 | 0.019* |
| 30 min | 71.1 ± 15.77 | 77.59 ± 11.91 | 0.066 |
| MAP | Group 1 | Group 2 | p |
| Mean ± SD | Mean ± SD | ||
| Before spinal anesthesia | 118.9 ± 22.34 | 113.03 ± 19.93 | 0.215 |
| 0 min | 109.03 ± 25.8 | 107.41 ± 19.62 | 0.777 |
| 5 min | 91.50 ± 21.39 | 99.65 ± 16.6 | 0.092 |
| 10 min | 84.07 ± 18.59 | 96.59 ± 16.62 | 0.006* |
| 15 min | 85.93 ± 15.73 | 96.50 ± 17.0 | 0.013* |
| 30 min | 82.43 ± 14.60 | 95.97 ± 16.23 | 0.001* |
SBP: systolic blood pressure; DBP: diastolic blood pressure; MAP: mean arterial pressure. Students t-test.
*p < 0.05.
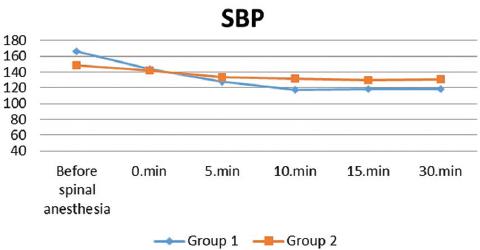
Table 3 Comparison of PVI and IVC diameters between groups
| Parameters | Group 1 | Group 2 | p |
|---|---|---|---|
| Mean ± SD | Mean ± SD | ||
| PVI (%) | 20.2 ± 3.09 | 14.24 ± 4.86 | 0.000* |
| IVC diameter AP (mm) | 18.54 ± 2.05 | 20.19 ± 1.91 | 0.002* |
| IVC diameter Transverse (mm) | 17.28 ± 2.23 | 20.22 ± 1.74 | 0.000* |
| IVC area (mm2) | 2.89 ± 0.72 | 3.60 ± 0.82 | 0.001* |
PVI: pleth variability ındex; IVC: inferior vena cava; AP: anteroposterior. Students t-test
*p < 0.05.
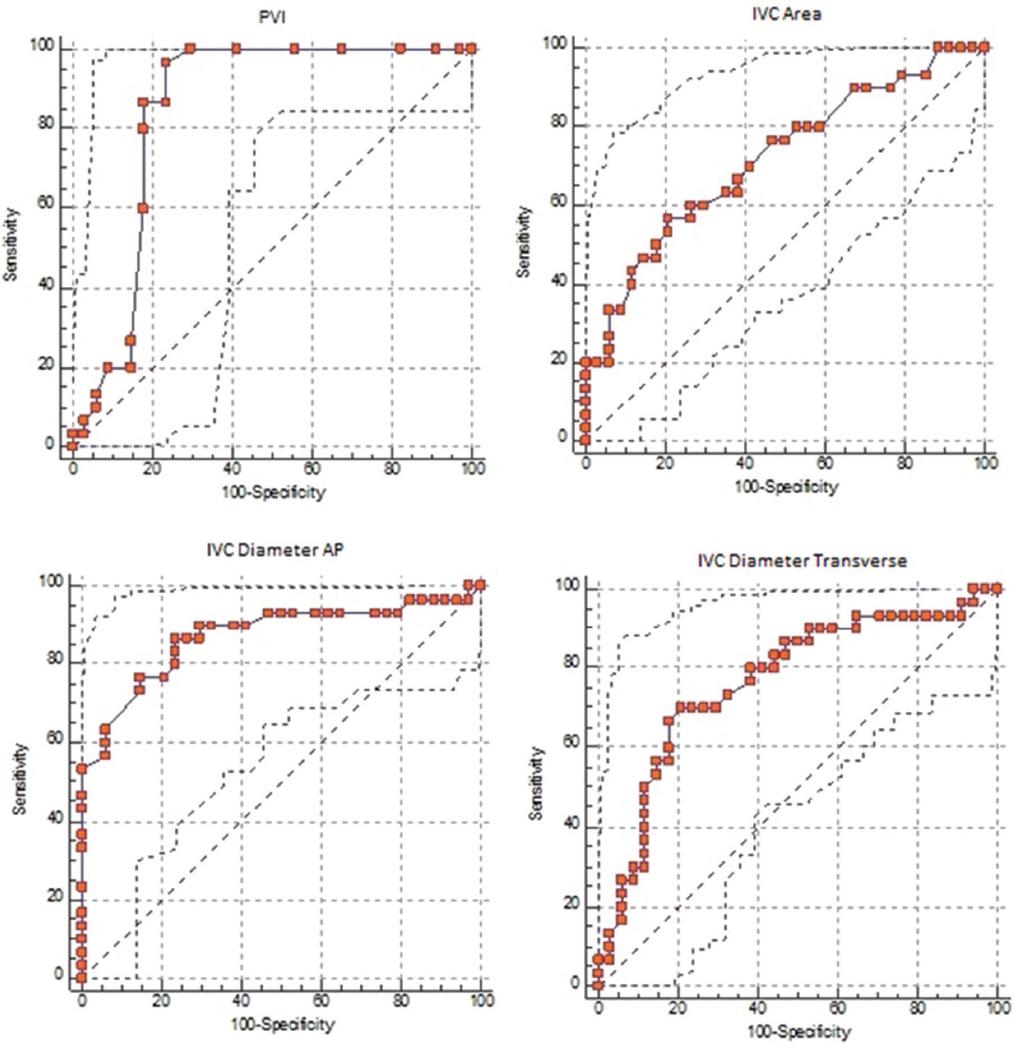
The ROC curve including the AUC, cut-off, sensitivity, and specificity values drawn to evaluate the predictability of PVI, IVC AP diameter, IVC transverse diameter and BMI-IVC area measurements for the risk of developing hypotension are shown in Table 4.
Table 4 Comparison of ROC analyses for PVI, IVC diameter AP, IVC diameter transverse and IVC area
| Parameters | AUC | Cut-off value | Sensitivity (%) | Specificity (%) |
|---|---|---|---|---|
| PVI | 0.848 | > 15% | 96.7 | 76.5 |
| IVC diameter AP (mm) | 0.719 | ≤ 18.7 mm | 56.7 | 79.4 |
| IVC diameter Transverse (mm) | 0.873 | ≤ 18.8 mm | 86.7 | 76.5 |
| IVC area (mm2) | 0.765 | ≤ 2.98 mm2 | 70 | 79.4 |
PVI: pleth variability ındex; IVC: inferior vena cava; AP: anteroposterior; ROC: receiver operating characteristic; AUC: area under the curve.
AUC measurement values of all four parameters were found to be significantly >0.5. In our study, the threshold values predicting the development of hypotension were found to be > 15% for PVI, ≤ 18.7 mm for IVC diameter (AP), ≤ 18.8 mm for IVC diameter (transverse), and ≤ 2.98 mm2 for IVC area, respectively (p = 0.001, p < 0.05); (Table 4, Fig. 3).
Discussion
HSA that develops during SA is an expected but undesirable side effect as it adversely affects perioperative morbidity and mortality10. Therefore, it is crucial to predict which patients may develop HSA during SA and to prevent it before developing. One of the most probable causes of HSA is hypovolemia. Hypovolemia may result from decreased systemic vascular resistance due to SA and/or the patient may already be pre-operatively hypovolemic. There are studies investigating the role of pre-operative volume status in predicting the development of HSA4,11,12. pulse index continuous cardiac output (PICCO) is a standard but invasive method to measure the volume status of patients. Alternatively, non-invasive measurements of PVI and IVC diameter and area have emerged.
In our study, as a primary outcome, we aimed to determine whether the measured PVI and IVC values through USG before the SA is performed are effective in predicting HSA and as a secondary outcome, if they are effective, we aimed to determine the cut-off values.
The study of Carpenter et al., reported advanced age (≥ 40 years) and high sensory block level as risk factors for hypotension after spinal block13. In our study, however, since there was no significant difference between the groups in terms of SA levels, age, gender, BMI, and ASA scores of the patients we compared in two groups according to hypotension and non-hypotension development, these parameters were not considered as risk factors for developing hypotension.
In a study conducted by Ceruti et al., HSA incidence decreased by 15% in patients who were given fluid therapy before SA after IVC diameter measurements by ultrasound14. In various studies conducted on trauma patients with hypovolemia or hemorrhagic shock in the intensive care unit, on patients receiving hemodialysis, or in healthy volunteers, ultrasonographic IVC diameter measurements were shown to be an effective method for evaluating the volume status of patients and their response to fluid therapy15-19.
The fact that IVC is an elastic vessel, USG is an operator-dependent method, and the measurement quality varies depending on the device used, and the skill and experience of the operator may affect the measurements. This issue is the most important limitation of this method. To eliminate these factors in our study, the same device was used for the measurements made on each patient and all measurements were made by the same operator.
PVI is a new algorithm used to automatically calculate respiratory variables in pulse oximetry amplitude that predicts fluid response5. It is an easy-to-use, non-invasive method with the measurements made by the pulse oximetry probe that is independent of the operator using it. In a study of Yu et al. with 30 patients who underwent major abdominal surgery, it was observed that hemodynamic stabilization was achieved with a smaller amount of fluid replacement in patients whose fluid status was evaluated with PVI in addition to MAP, compared to patients evaluated with MAP alone20. A previous meta-analysis indicated that PVI is a reliable indicator of fluid response in the perioperative and critically ill patients, especially adults undergoing mechanical ventilation21. In the study of Kuwata et al., hypotensive states were reported to be able be defined with PVI and whether fluid loading is required in patients who breathe spontaneously and had undergone cesarean section under SA3. In our study, supporting these studies, hemodynamic stabilization was achieved with fluid replacement, and less HSA was observed.
Yokose et al., however, argued that PVI could not be a reliable indicator of intravascular volume in spontaneously breathing pregnant women during cesarean section22. In our study, measurements were made after premedication with midazolam IV to minimize the effects of respiratory pattern on IVC and PVI measurements. Since IVC is also measured at the end of expiration in all patients, respiratory variability is eliminated.
Cannesson et al. were among the first researchers of this method, and in their study of 25 patients undergoing coronary bypass surgery; they suggested that PVI > 14% was a variable that could evaluate fluid response23. In similar studies, threshold values were found between 10% and 16%24-26. In our study, IVC diameter was measured at the end of expiration in AP and transverse section and its area was calculated, and the cut-off point for PVI in the diagnosis of hypotension was found to be > 15%.
Similar to our study, in a study in which measurements of PVI and IVC diameter were made and compared together, measurements of PVI and IVC diameter were reported as the methods that can be used to evaluate fluid response in intubated patients followed up in the intensive care unit27. As a result of our study, the risk of developing HSA is high in patients with high PVI values (especially the cut-off values > 15%, which was found in our study) and/or low IVC diameter measurement (especially the cut-off values < 2.98 mm2, which was found in our study), and we suggest that that pre-SA fluid resuscitation and perioperative follow-up should be done with caution.
Conclusion
In the light of the findings of our study, we suggest that PVI and IVC diameter measurement with the help of USG can be used as non-invasive methods to predict hypotension that may develop due to SA. Early and accurate prediction of HSA can improve the clinical decision process, modify therapeutic management, and may be helpful for appropriate early intervention. It should be noted that IVC diameter measurements provide more subjective data as they are device- and operator-dependent, while PVI measurements conducted with fingertip probes provide objective data. Although PVI is a method that has been studied frequently recently, a definite threshold value or reference range indicating the fluid status has not been defined as the studies are insufficient for such data. As the number of studies on PVI increase, it will be possible to determine the threshold value. The lack of samples can be considered a limitation of this study. Other studies with larger samples are needed to confirm the results in this study.

