


 nueva página del texto (beta)
 Inglés (pdf)
 Artículo en XML
 Referencias del artículo
 Enviar artículo por email
 Citado por SciELO
  Similares en
SciELO
Similares en
SciELO 
 Permalink
Introductıon
Chronic low back pain is a prevalent issue leading to significant social and economic challenges. In industrialized nations, it is believed that between 70% and 85% of individuals will experience low back pain at some point in their lives1-4. The primary cause of this pain is lumbar degenerative disease (LDD), encompassing conditions like lumbar disc herniation, lumbar spinal stenosis, and lumbar spondylolisthesis. At present, LDD can be treated through non-invasive or surgical means. While non-invasive therapies can reduce symptoms for many, surgery remains the primary solution for advanced LDD cases4,5.
One common method employed is the PLSRR6. Spinal fusion is often deemed the primary treatment for LDD. Some techniques boast a fusion success rate of 100%, though clinical outcomes typically range between 60% and 80%. Even with the positive results from this surgery, there are potential complications, such as issues with the instruments used, non-union, infections, and donor site discomfort. Crucially, spinal fusion might boost the range of motion (ROM) in neighboring segments, possibly causing adjacent segment degeneration (ASD)6-8.
Due to the limitations of fusion, experts have investigated surgeries that maintain motion, such as artificial lumbar disk replacement and dynamic stabilization. The PLSDR serves as a substitute for traditional rigid tools and fusion in treating LDD. In principle, it provides the benefit of conserving motion in the neighboring segments and reducing strain on the adjacent discs and facet joints7,8.
To the best of our knowledge, there are limited studies that compare the clinical results of the PLSDR and PLSRR. Therefore, this research aims to assess the clinical and radiological outcomes of both PLSDR and PLSRR when treating LDD.
Materials and methods
Study design and groups
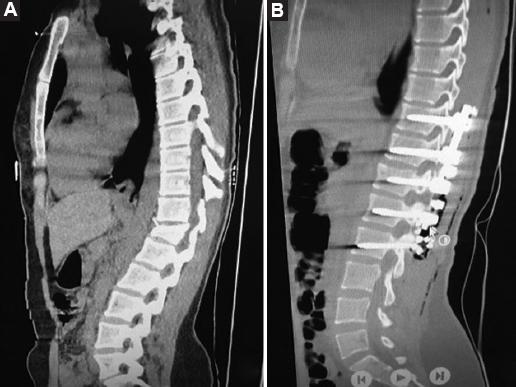
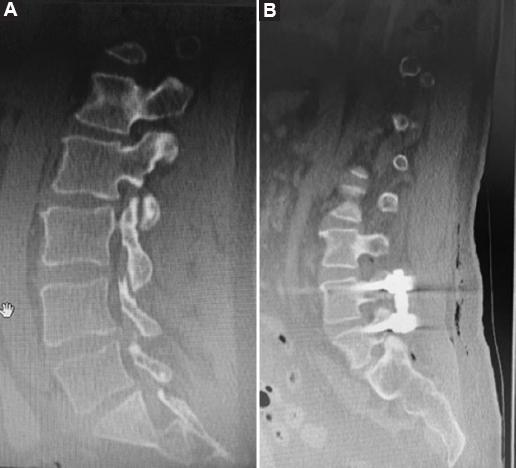
A retrospective review of 98 patients who underwent posterior stabilization surgery with a posterior approach in our clinic between 2018 and 2023 was conducted. The patients were divided into two groups based on the type of implant used: Those with PLSRR (Group 1, Fig. 1) and those with PLSDR (Group 2, Fig. 2).
Patient data including age, gender, presence of comorbid diseases, and follow-up durations were recorded. All patients underwent lumbar magnetic resonance imaging. Radiological evaluations focused on assessing degeneration in the proximity of the proximal and distal segments for both systems. Degeneration assessment considered the presence of discopathy, facet hypertrophy, stenosis, scoliosis, and listhesis. In addition, for the differentiation between discopathy and disk degeneration, staging was conducted based on the Pfirrmann grading system (Table 1)9.
Table 1 Pfirrmann grading system9
| Grade | Definitions |
|---|---|
| Grade I | A normal disc |
| Grade II | An inhomogeneous disc with normal disc height and a clear difference between the nucleus and annulus |
| Grade III | An inhomogeneous gray disc with a loss of the clear border between the nucleus and annulus and normal to slightly decreased disc height |
| Grade IV | An inhomogeneous hypointense dark gray disc with significant disc height loss |
| Grade V | A inhomogeneous black disc with disc space collapse |
Eligibility criteria
Patients who had undergone posterior stabilization for traumatic lumbar spine injuries, lumbar interbody fusion, and posterior thoracic stabilization were excluded from this study. Patients who had posterior stabilization surgeries targeted at lumbar degenerative spine were included in this study.
Ethical approval and informed consents
The study was approved ethically by non-interventional ethics committee of Sancaktepe Training and Research hospital (date: October 11, 2023. No: 211). Written informed consents were obtained from all patients and/or their guardians.
Surgical procedures
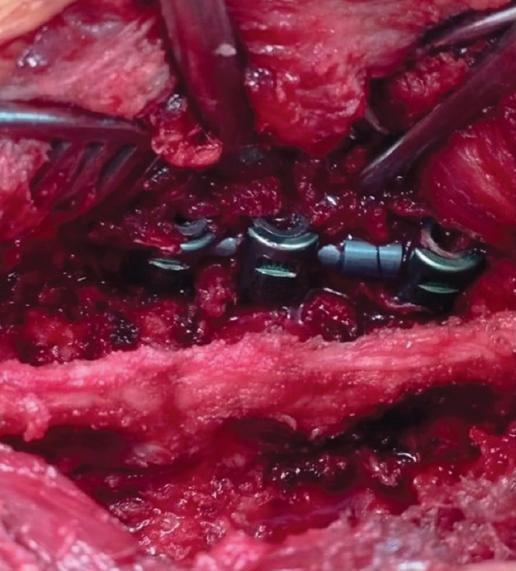
All surgeries were performed by the same surgical team and similar techniques were used for both groups. After general anesthesia, patients were positioned in the prone position and an incision was made in the posterior midline. Muscles were dissected to reveal the bone structures. In Group 2, pedicle screws were placed first and the placements of the pedicle screws were checked under fluoroscopy. After placing the dynamic rod system, a laminectomy was performed to achieve decompression, and it was ensured that the medial facet joints were preserved as much as possible. For many patients, basic decompression was performed, but in cases of significant narrowing, extensive decompression was required. In cases with lumbar disk herniation, partial discectomy and foraminotomy were performed (Fig. 3)10,11.
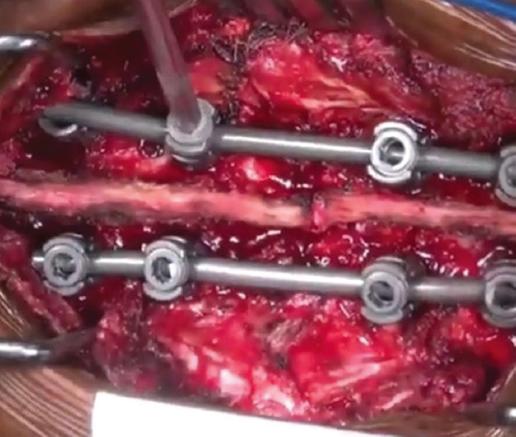
For Group 1, patients were first positioned in the prone position and a midline incision was made, passing through the skin and subcutaneous layers. Bone structures were exposed through blunt muscle dissection. Under fluoroscopy guidance, pedicle screws were appropriately placed. The rigid rod system was locked to the pedicle screws. Procedures such as laminectomy, hemilaminectomy, or facetectomy were performed for decompression. Discectomy was applied to some patients. Fusion was performed for patients using allogeneic and autologous bone grafts, 5 cc for each level. Decortication was applied to the bones to expand the fusion area (Fig. 4)10,11.
Patients were allowed to walk on the 3rd day post-surgery. They were advised to wear a lumbar brace for 12-week post-surgery, after which they could resume their regular activities.
Statistical analysis
The patient information was evaluated using various statistical techniques, including the creation of descriptive statistics, the calculation of frequencies, and the analysis of other factors spanning all categories. Quantitative figures were represented as mean ± standard deviation. The distribution normality of continuous data was assessed through the ShapiroWilk and KolmogorovSmirnov tests. For continuous variables that followed a normal distribution, the Students t-test was utilized. For data not adhering to a normal distribution, non-parametric tests were used. Categorical data were analyzed using the χ2 test. The data analysis was conducted using SPSS Statistics for Windows, Version 24.0 (IBM Corp., Armonk, NY, USA). A two-tailed p ≤ 0.05 was deemed to indicate statistical significance.
Results
A total of 98 patients were included in our study, with 49 patients from Group 1 and 49 patients from Group 2. Table 2 summarizes the comorbidities. The most prevalent comorbidities were diabetes (15.7%) and hypertension (13.9%). Gastrointestinal diseases and hyperlipidemia followed, with 9.3% and 8.3%, respectively. Anxiety/Depression affected 7.4% of participants. Notably, 18.5% had no comorbidities.
Table 2 Comorbidity of the individuals
| Comorbidity | n | % |
|---|---|---|
| Diabetes | 17 | 15.7 |
| Hypertension | 15 | 13.9 |
| Gastrointestinal diseases | 10 | 9.3 |
| Hyperlipidemia | 9 | 8.3 |
| Anxiety/depression | 8 | 7.4 |
| Coronary artery disease | 6 | 5.6 |
| Gonarthrosis | 5 | 4.6 |
| Hypothyroidism | 5 | 4.6 |
| Urogenital diseases | 4 | 3.7 |
| Arthritis | 4 | 3.7 |
| Vertigo | 2 | 1.9 |
| Asthma | 1 | 0.9 |
| Anemia | 1 | 0.9 |
| Psoriasis | 1 | 0.9 |
| None | 20 | 18.5 |
| Total | 108 | 100 |
In our comparative analysis, both groups presented a closely matched age profile, with an average age of 53.3 ± 13.53 years in Group 1 and 52.5 ± 10.41 years in Group 2 (p = 0.744). Gender distribution revealed a marked contrast with males constituting 18.4% in Group 1 and rising to 43% in Group 2, a variation found to be significant (p = 0.009). Discopathy was more prevalent in Group 1 (49%) than in Group 2 (24.5%) (p = 0.012). Regarding surgical operating levels, Group 2 had a slight lead in single-level operations (4.1%) compared to Group 1 (0%). For two-level surgeries, Group 1 had 45% and Group 2 reported 51%. Three-level surgeries were conducted on 30.5% of Group 1 and 40.8% of Group 2. Four-level operations were more common in Group 1 (16.3%) than in Group 2 (4.1%). Interestingly, only Group 1 reported five-level surgeries, affecting 8.2% of its cohort (p = 0.033). In terms of the Pfirrmann disk degeneration grade, a glaring distinction was noted. Group 2 predominantly fell under Grade I (77.6%) compared to Group 1 (36.7%). While Group 1 had 26.5% individuals in Grade II, Group 2 had a slight reduction at 16.3%. Grade III was observed in 18.4% of Group 1 versus 6.1% of Group 2. Grade IV was unique to Group 1 with 16.3%, and only 2% of Group 1 was classified under Grade V. This gradient in disk degeneration grades across both groups was notably significant (p < 0.001). When examining stenosis, Group 1 showcased a higher prevalence (57.1%) in contrast to Group 2s 28.6% (p = 0.004). Facet hypertrophy was also more common in Group 1 (71.4%) than in Group 2 (47%) (p = 0.014). While Group 2 presented a 4.1% incidence of scoliosis, it was absent in Group 1 (p = 0.153). The prevalence of listhesis was minimal across groups, at 2% for Group 1 and 4.1% for Group 2 (p = 0.558). The incidence of ASD was markedly higher in Group 1 (81.6%) compared to Group 2 (51%) (p = 0.001). Concerning the ASD degeneration location, Group 2 had 4% at the distal end, whereas proximal degeneration was dominant in both groups: 100% in Group 1 and 96% in Group 2 (p = 0.202). Notably, compression fractures were absent in both groups. During the follow-up period, Group 1 participants averaged a duration of 41.7 ± 7.62 months, while Group 2's duration was slightly extended at 43.7 ± 6.98 months (p = 0.183) (Table 3).
Table 3 Comparison of the groups
| Variables | Group 1 (n = 49%) | Group 2 (n = 49%) | p-value |
|---|---|---|---|
| Age (year)* | 53.3 ± 13.53 | 52.5 ± 10.41 | 0.744 |
| Gender (M) | 9 (18.4) | 21 (43) | 0.009 |
| Discopathy | 24 (49) | 12 (24.5) | 0.012 |
| Operating levels | 0.033 | ||
| 1 level | 0 (0) | 2 (4.1) | |
| 2 levels | 22 (45) | 25 (51) | |
| 3 levels | 15 (30.5) | 20 (40.8) | |
| 4 levels | 8 (16.3) | 2 (4.1) | |
| 5 levels | 4 (8.2) | 0 (0) | |
| Pfirrmann disc degeneration grade | < 0.001 | ||
| Grade I | 18 (36.7) | 38 (77.6) | |
| Grade II | 13 (26.5) | 8 (16.3) | |
| Grade III | 9 (18.4) | 3 (6.1) | |
| Grade IV | 8 (16.3) | 0 (0) | |
| Grade V | 1 (2) | 0 (0) | |
| Stenosis | 28 (57.1) | 14 (28.6) | 0.004 |
| Facet hypertrophy | 35 (71.4) | 23 (47) | 0.014 |
| Scoliosis | 0 (0) | 2 (4.1) | 0.153 |
| Listhesis | 1 (2) | 2 (4.1) | 0.558 |
| ASD (yes)& | 40 (81.6) | 25 (51) | 0.001 |
| Location of the degeneration ASD& | 0.202 | ||
| Distal | 0 (0) | 1 (4) | |
| Proximal | 40 (100) | 24 (96) | |
| Compression fracture | 0 (0) | 0 (0) | N/A |
| Follow-up (month)* | 41.7 ± 7.62 | 43.7 ± 6.98 | 0.183 |
*Mean ± standart deviation.
&ASD: Adjacent segment degeneration; N/A: non-applicable.
Discussion
Spinal fusion surgery is recognized as an effective approach for addressing lumbar degenerative conditions. While this surgical intervention is commonly recommended for conditions like isolated disk degeneration, primary and secondary instabilities, recurrent disk herniation, and pseudarthrosis, existing studies have highlighted potential risks such as ASD, equipment malfunction, pseudoarthrosis, nonunion, infections, and pain at the donor site. To mitigate these challenges, dynamic semi-rigid stabilization was introduced in 199412,13. This technique aims to maintain motion at the treated sections while preventing excessive movement and subsequent spondylosis at neighboring segments. Prior research indicates that Dynesys stabilization combined with decompression offers promising short- and long-term results for lumbar degenerative conditions. The method not only alleviates back and leg discomfort but also maintains the movement of stabilized segments, limits tissue damage, and eliminates the need for bone harvesting for fusion12,13.
A systematic review previously conducted by Chou et al. indicated no notable differences between fusion and dynamic stabilization in terms of visual-analog scale (VAS), oswestry disability ındex (ODI), complications, and subsequent surgeries7. Existing research does not provide long-term evidence establishing whether dynamic stabilization reduces ASD rates. However, when assessing post-operative ASD and operated segment ROM, PLSDR has statistically lower outcomes compared to fusion. Our findings diverge from those reported by other researchers. In a meta-analysis led by Wang et al., both fusion and Dynesys were shown to be equally effective in treating degenerative lumbar diseases, as evidenced by no significant differences in the VAS scores for back and leg pain. Prior studies have also shown both methods, leading to marked improvements in VAS for back and leg pain as well as ODI8. Yet, no discernible differences between the two methods were identified at any evaluation period. In our study, ROM was not evaluated. In terms of ASD, the incidence of ASD was markedly higher in PLSRR group (81.6%) compared to PLSDR group (51%) (p = 0.001). Concerning the ASD degeneration location, Dynesys had 4% at the distal end, whereas proximal degeneration was dominant in both groups.
Dynamic stabilization primarily offers the benefit of maintaining motion at the treated segment, which could potentially minimize the risk of ASD. This anticipated decrease in ASD is chiefly due to preventing increased stress on adjacent segments. Data from our research indicate a significantly higher occurrence of ASD in the fusion group compared to the Dynesys group. Nonetheless, regarding the preventative aspect against ASD, earlier research has yielded mixed findings. Cakir et al. indicated that monosegmental posterior dynamic stabilization using Dynesys did not influence adjacent segment mobility when compared to monosegmental fusion14. Past researchers have posited that while the dynamic system curtails instability at the treated segment, its efficacy in thwarting ASD remains ambiguous15. Conversely, Wu et al. demonstrated that, when compared to PLIF, Dynesys stabilization retains the movement of the stabilized segments, exerting minimal impact on the proximal adjacent segment, and may assist in deterring the onset of ASD16. Within our cohort, Group 1 exhibited a marked increase in the prevalence of stenosis at 57.1%, which is significantly higher than that observed in Group 2, which had a prevalence of 28.6% (p = 0.004). This stark contrast between the two groups in our study underscores the varying manifestations of post-operative stenosis in different surgical interventions.
This study has limitations: Firstly, the cohort size is comparatively limited, necessitating a more extensive patient group to corroborate our findings. Secondly, given that our research is retrospective, it has certain inherent constraints; there's a need for a future prospective study. Thirdly, there might be potential discrepancies due to individual variations between the surgeons conducting the procedures and those assessing the radiographic images, despite both having extensive experience at the same institution. Finally, the average observation period for this research is 41 month; a more extended period is essential to comprehensively evaluate both clinical and radiographic differences between the two groups.

